 | |||
|
| Home > Astronomy > Site Quality |
 | |||
|
| Home > Astronomy > Site Quality |
Site Quality
The four sections below summarise information about observing conditions at
the observatory:
The meteorological data used here were obtained using the ING weather stations. Please refer to the environmental conditions pages for an analysis of the relevant atmospheric parameters to health. See these other papers for a comparison from other ORM weather stations: M. Gaug et al., 2024, "Detailed analysis of local climate at the CTAO-North site on La Palma from 20 yr of MAGIC weather station data", MNRAS, 534, 2344 [ Paper ].
Measurements of the temperature, wind speed, humidity etc from 1999
are available from the
the ING
meteorology and seeing archive. On average, 25% of observing time
at the
William Herschel Telescope is lost to bad weather
(when cloud,
wind speed, dust, humidity, dew or ice exceed the operational limits (semester A runs from February to July, and semester B from August to January):
As measured by the RoboDIMM seeing monitor, a few 10s of m north of the WHT building, the median seeing at zenith is 0.80 arcsec April - November (0.72 arcsec in August - September), and 1.07 arcsec December - March. The RoboDIMM measures the seeing every few minutes on most nights. The measurements are made by observing a convenient star with zenith distance < 30 deg, and correcting to be representative of zenith. The RoboDIMM was not intended as a site-characterisation tool, and it's known to under-detect very good seeing (< 0.5 arcsec), so the numbers quoted here are likely to be slightly pessimistic. Nevertheless, on a given night there's generally reasonable agreement with other DIMMs on the mountain-top, and the RoboDIMM measurements give a good idea of the shape of the seeing distribution, and of the seasonal variation. The variation of RoboDIMM median seeing with month is similar from year to year, and the monthly medians for 2012-15 are: Month: Jan Feb Mar Apr May Jun Jul Aug Sep Oct Nov Dec Seeing (arcsec): 1.04 1.13 1.00 0.87 0.83 0.83 0.84 0.72 0.72 0.79 0.87 1.13 The distributions of 2012-15 RoboDIMM seeing during April - November, and December - March, are shown below:
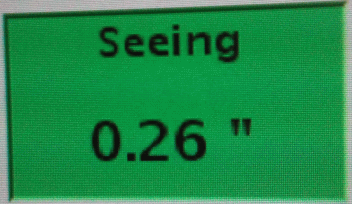
There is no significant correlation between seeing and time during the night. Seeing is expected to vary roughly as airmass0.6. Dome seeing at the WHT is usually negligible. There may be some mirror seeing when the primary mirror is more than 3 degC warmer than the dome internal temperature (which is the case on ~ 10 - 20% of nights). The finite PSF delivered by the WHT itself (optical aberrations, < 0.3 arcsec) will significantly degrade only the very best site seeing. As is evident from the histograms above, seeing of just a few tenths of an arcsec is occasionally recorded by the DIMM monitor outside the WHT. On the night of 11 January 2018, it recorded seeing ~ 0.3 arcsec for several minutes (screenshot by Fiona Riddick):

The seeing at the INT tends to be worse than at the WHT, probably due to the thermal inertia of the building below the telescope.
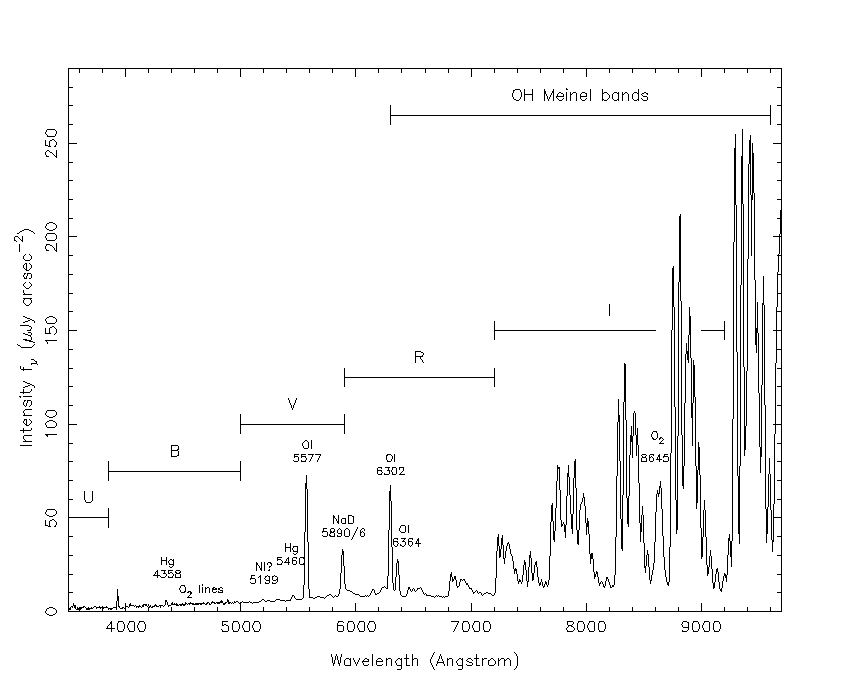
Further information can be found on the ING seeing pages, and on the IAC's sky-quality web pages. Atmospheric extinction above the observatory on La Palma is typically 0.12 mag in V band, and varies with wavelength. See La Palma technical note 31 (King 1985) for further information. During July, August, September, a pall of neutral-extinction ('grey') Saharan dust (properties described by Murdin 1986 in La Palma technical note 41) hangs over the islands, and the total extinction may be as high as 1 mag. The Carlsberg Meridian Telescope (CMT) provided a nightly record of extinction between 1984 and 2013. García-Gil et al. (2010, PASP, 122, 1109) carried out a statistical analysis of the CMT data. The median moonless night sky brightness above La Palma at high elevation, high galactic latitude and high ecliptic latitude, at sunspot minimum, is B = 22.7, V = 21.9, R = 21.0, rms 0.1 mag/arcsec2. The sky brightness in U and I is less well-determined, U approx 22.0 mag/arcsec2 (few data), I approx 20.0 mag/arcsec2 (variable). As at other dark sites, the main contributions to sky brightness are airglow and zodiacal light, in the ratio 2.5:1 at high ecliptic latitude. The sky is brighter at low ecliptic latitude (by 0.4 mag); at solar maximum (by 0.4 mag, and at high airmass (0.25 mag brighter at airmass 1.5). The last solar minimum was ~ end 2019. The mean brightness of the sky varies by < 0.1 mag with time after astronomical twilight. Light pollution (from street lamps etc) is visible to the naked eye at certain azimuths on the horizon, but its contribution to the continuum brightness at the zenith is < 0.03 mag in all bands. The NaD emission from street lamps brightens the sky in both V and R broad bands by about 0.07 mag. Total contamination (line + continuum) at the zenith is < 0.03 mag in U, approx 0.02 mag in B, approx 0.10 mag in V, and approx 0.10 mag in R. The brightness of the sky shows no dependence on atmospheric extinction AV, for AV < 0.25 mag (as is the case on 80% of nights). In very dusty conditions (extinction more than a few tenths of a mag), the sky brightness may be several tenths of a mag brighter, probably because of enhanced back-scattering of streetlighting by the dust layer. Further details can be found in ING technical note 115 (Benn C.R., Ellison S, 1998, also available as a postscript file). For a more recent investigation of light pollution, see Marco Pedani's article "An Updated View of the Light Pollution at the Roque de los Muchachos Observatory" in the ING newsletter, 9, 28. For a world map of light pollution, see here. A typical La Palma night-sky spectrum is shown below (click for full size): |

|
The continuum is dominated by airglow (actually pseudo-continuum) and zodiacal
light. The bright OH lines in the near-IR and at 5577, 5890/6 (some of the
emission),
6302 and 6364 Å are airglow.
The remainder of the 5890/6 NaD line is light from La Palma's low-pressure sodium street-lights, back-scattered from the atmosphere above the telescopes. The faint 4358 and 5460 Å lines are from mercury street-lights. Typical broad-band filter bandpasses are shown. Moonlight When the moon is 60 deg from zenith, with extinction 0.15 mag, the zenith sky will brighten by ~ dmag magnitudes as tabulated below:
                     New  Crescent  Quarter  Gibbous  Full

  Phase angle (deg)  180     135       90        45      0
  Approx day:          1       4        8        12     15
  D, G or B:           D       G        G         B      B
  Illum. frac. %       0      25       50        75    100

  dmag (U, B, V)       0       0.5      2.0       3.1    4.3
  dmag (R)             0       0.3      1.3       2.4    3.5
  dmag (I)             0       0.2      1.1       2.2    3.3
Sky brightness for other values of lunar phase, lunar zenith
angle, sky position and extinction, can be estimated with
SIGNAL's sky-brightness calculator.
Note that the quarter moon (i.e. half disc illuminated) is a factor of 10 (not 2) fainter than full, due to the opposition effect (also responsible for gegenschein on the ecliptic and dry heiligenschein on earth). The contribution of moonlight in V has been calculated according to the scattering formula of Krisciunas & Schaefer (1991, PASP, 103, 1033), normalised (multiplied by a factor of 2.4) to agree with measurements of sky brightness made at the JKT on a dust-free night in 7/98. The moonlight contribution in the other bands is calculated according to the U-B, B-V, V-R, R-I colours of moonlight measured on the same night in 7/98. These numbers provide a rough guide to the brightness of the moonlit sky. The actual brightness on a given night will depend strongly on how much dust and cloud is present. Definitions of dark, grey and bright time can be found in La Palma technical note 127 (Skillen 2002). Moonlight diagrams can be found here. Twilight Measurements of twilight sky brightness vs time after sunset (or before sunrise) can be found on the twilight sky brightness page. Artificial satellites Information about artificial satellites (including flare predictions) can be found here. In November 2019, US company SpaceX launched a constellation of 122 internet-access satellites, known as Starlink, into earth orbit at an altitude of 550 km. SpaceX plans to launch another 12000. Simulations of the impact on the night sky can be found here. |
| Top | Back |
|