| |||
|
Home > Public Information > ING Newsletter > No. 9, March 2005 > An Updated View of the Light Pollution at the Roque de Los Muchachos Observatory |
|
SCIENCE |
|
|
|
Line | Group 1 |
Group 2 | Group 3 |
Group 4 | Group 5 |
Group 6 |
|
||||||
HgI λ4046 | 3.4 | 5.2 | 9.5 | 6.1 | 10.2 | 6.3 |
HgI λ4358 | 5.6 | 7.9 | 22.0 | 17.6 | 14.2 | 4.5 |
NI λ5199 | 1.5 | 15.4 | 3.2 | 11.2 | 5.1 | 3.1 |
HgI λ5461 | 4.4 | 5.5 | 25.7 | 10.9 | 8.6 | 4.7 |
OI λ5577 | 310 | 256 | 303 | 234 | 447 | 504 |
NaI λ5683–8 | 3.5 | 6.3 | 30.6 | 9.5 | 11.4 | 3.6 |
HgI λ5769 | n.d. | n.d. | 7.2 | n.d. | 1.9 | 1.4 |
HgI λ5790 | n.d. | n.d. | 4.7 | n.d. | 1.7 | 0.7 |
NaD λλ5890–6 |
189(156) | 148(89) | 658(431) | 284(134) | 251(162) | 270(161) |
NaI λλ6154–61 | n.a. | n.d. | 9.5 | n.a. | 9.6 | n.a. |
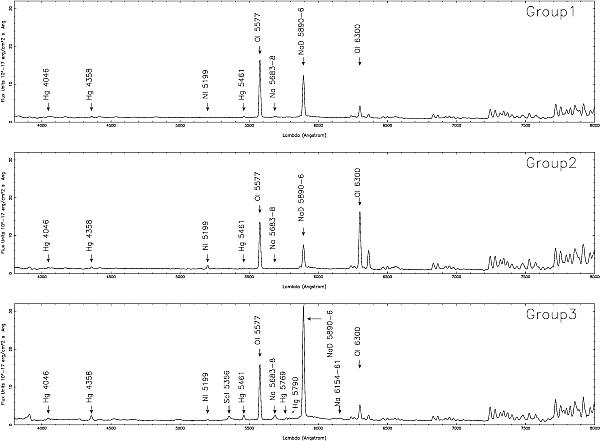
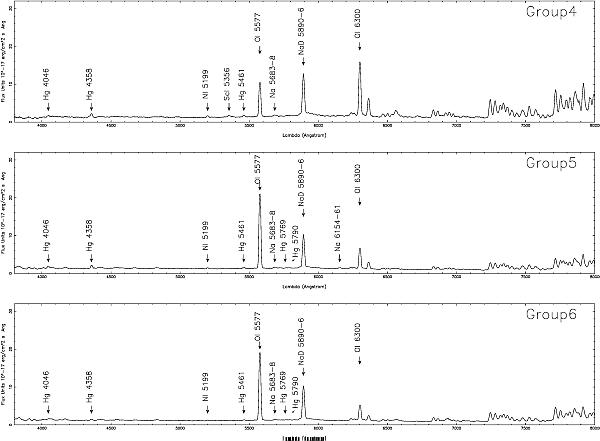
Table 1. Fluxes of the most important emission lines as measured in our spectra. Values are in R (rayleigh, see BE98 for some useful conversion formulas). When not detected, a line is labeled with “n.d.”; if the line was too noisy/faint or either blended with another line, it is labeled with “n.a.”. Contribution to NaD λλ5890–6 from light pollution is shown in parentheses. |
Figure 1. The night-sky spectra. The Group 1 (4 hrs total exposure) is the average of 8 spectra and best represents the average observing conditions at ORM. The Group 2 spectrum was taken towards the NW, the least light-polluted zone at ORM. The Group 3 spectrum was taken towards the most light-polluted region of sky at ORM, before midnight. The presence of thin clouds could explain the abnormally high fluxes of the light polluting lines. [ JPEG | TIFF ]. |
Figure 2. The night-sky spectra. The Group 4 spectrum was taken toward a moderately polluted region before midnight. The Group 5 spectrum was taken toward the meridian before midnight. The Group 6 spectrum was taken toward the meridian after midnight. [ JPEG | TIFF ]. |
Top | Back |
|