 | |||
|

| Home > Public Information > ING Annual Reports > 2000/2001 > Chapter 2 |
|
| |||
|
| Home > Public Information > ING Annual Reports > 2000/2001 > Chapter 2 |
Other available formats: PDF
Chapter 2
Operation, Maintenance and Enhancements
|
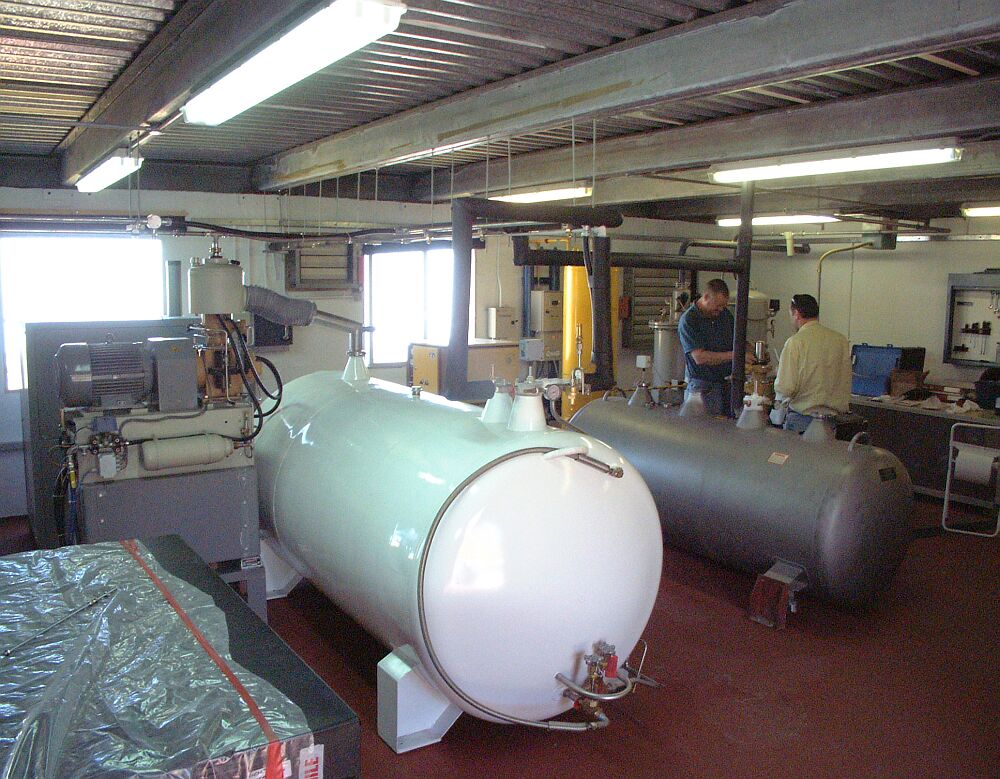
| Figure 1. A view of the ING liquid nitrogen plant
with the new production unit in the foreground. [ JPEG
| TIFF ] |
|
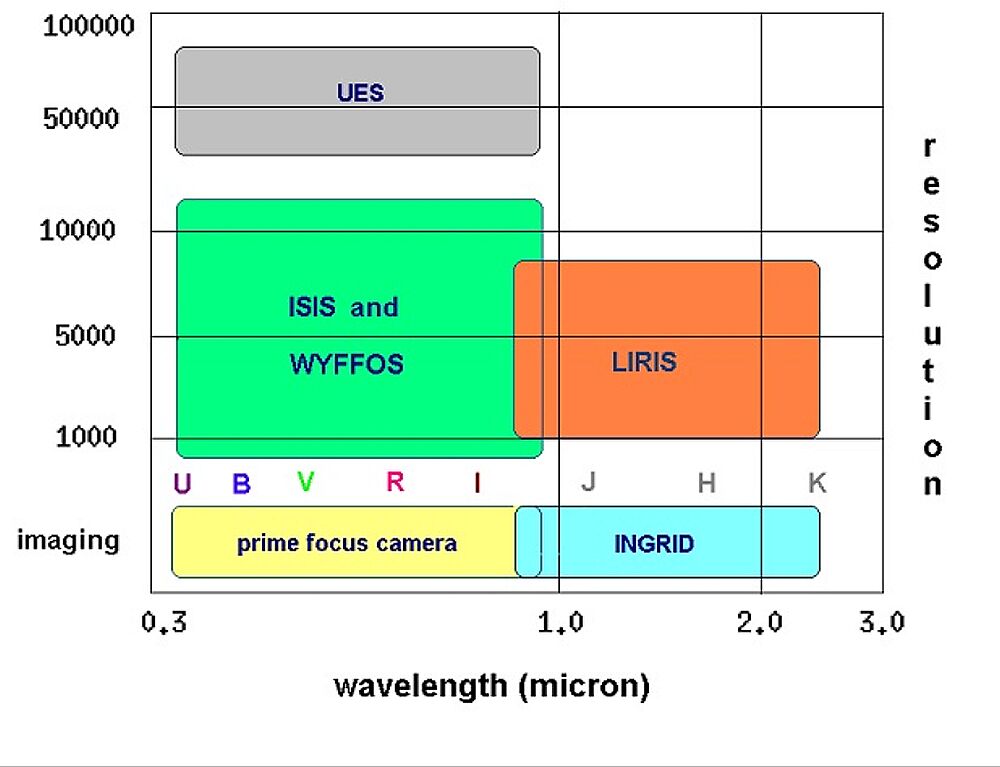
| Figure 2. Instrument capability of the William
Herschel Telescope. [ JPEG | TIFF ] |
|
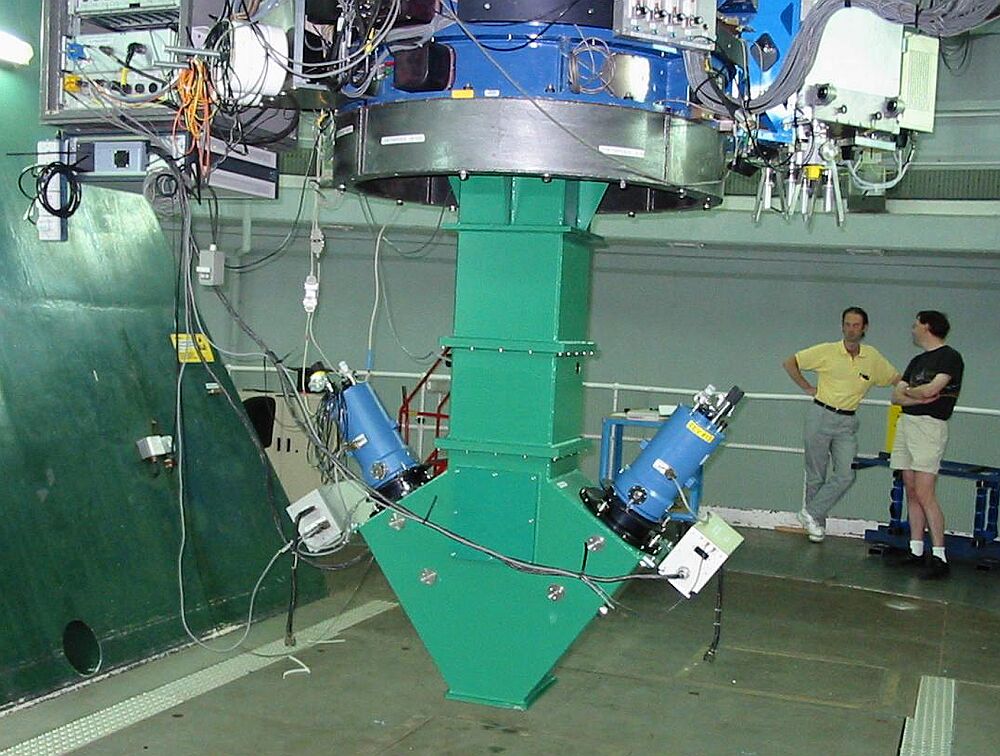
| Figure 3. The Planetary Nebula Spectrograph fully
assembled and integrated with the WHT, and EEV CCDs and controllers mounted
on each arm of the spectrograph. [ JPEG | TIFF ] |
|
|
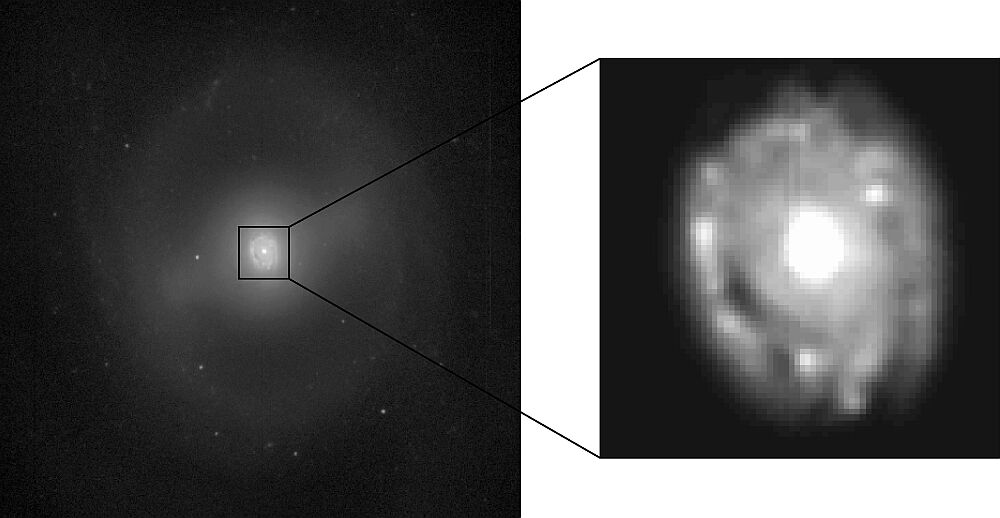
| Figure 4. Left: INGRID
mounted on one of the WHT folded Cassegrain foci (top right). The instrument
on the Cassegrain focus is SAURON. [ JPEG | TIFF ] Right: This image acquired
using INGRID on the first nights is a J-band image of M95. The inset on the
right shows the nuclear ring of enhanced star formation. [ JPEG | TIFF ] |
|
|
|
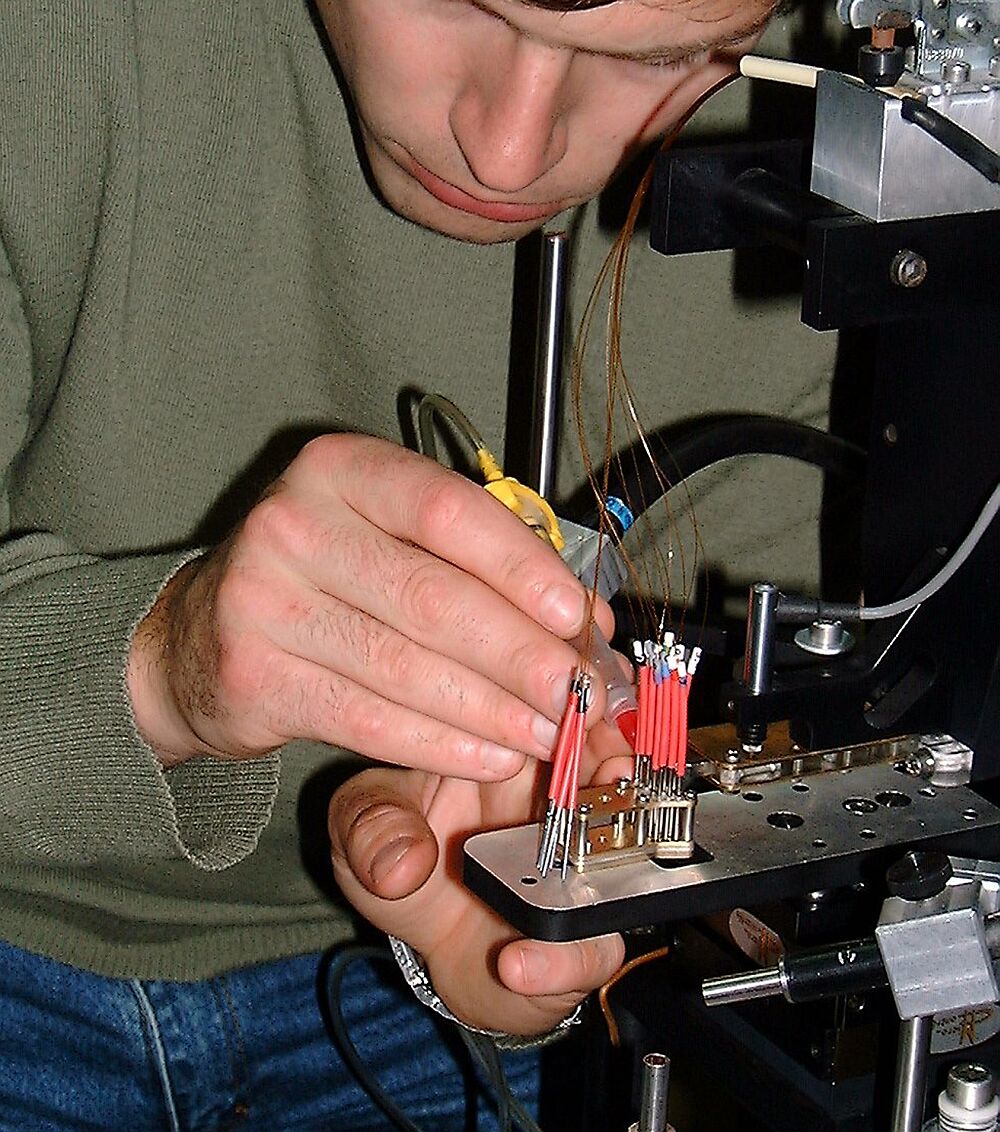
| Figure 5. Left: Alignment of fibres
into micro-lens finger holder at ING. [ JPEG |
TIFF ] Right: The Small Fibre Module at WHT
prime focus. [ JPEG | TIFF
] |
|
|
|
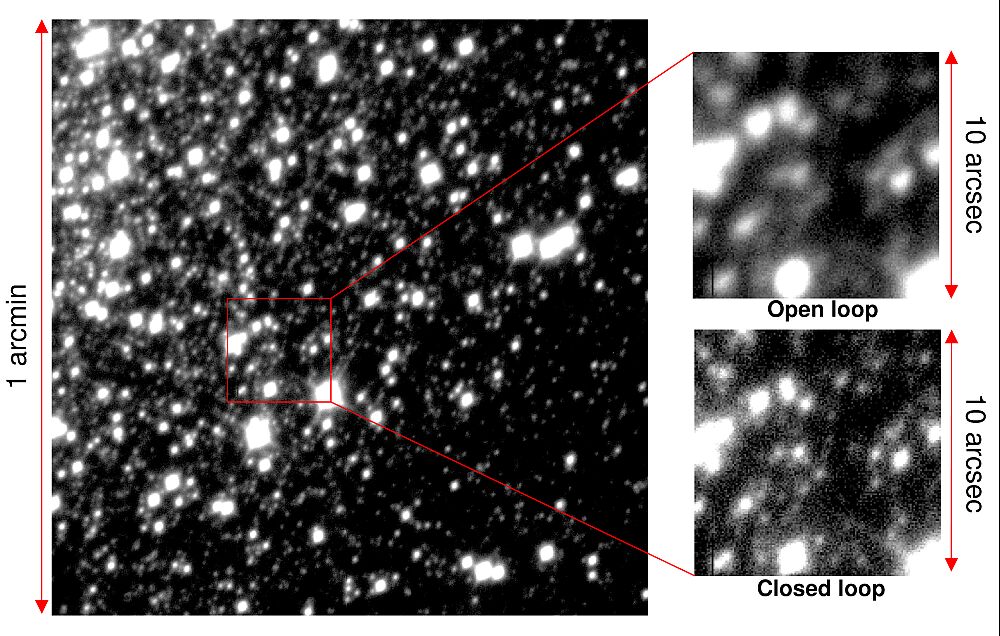
| Figure 6. Left: H-alpha image of globular
cluster M13 obtained using NAOMI. The FWHM has been improved from 0.8 arcsec
(natural seeing) to 0.4 arcsec, allowing many faint stars to be resolved.
The image was taken during September 2001 tests of NAOMI’s performance at
optical wavelengths, and provides a realistic outlook of the AO potential
at the William Herschel Telescope. Given that the median natural seeing on
La Palma is about 0.7 arcsec, an image quality of ~0.3 arcsec in the R and
I bands should be achieved regularly. [ JPEG
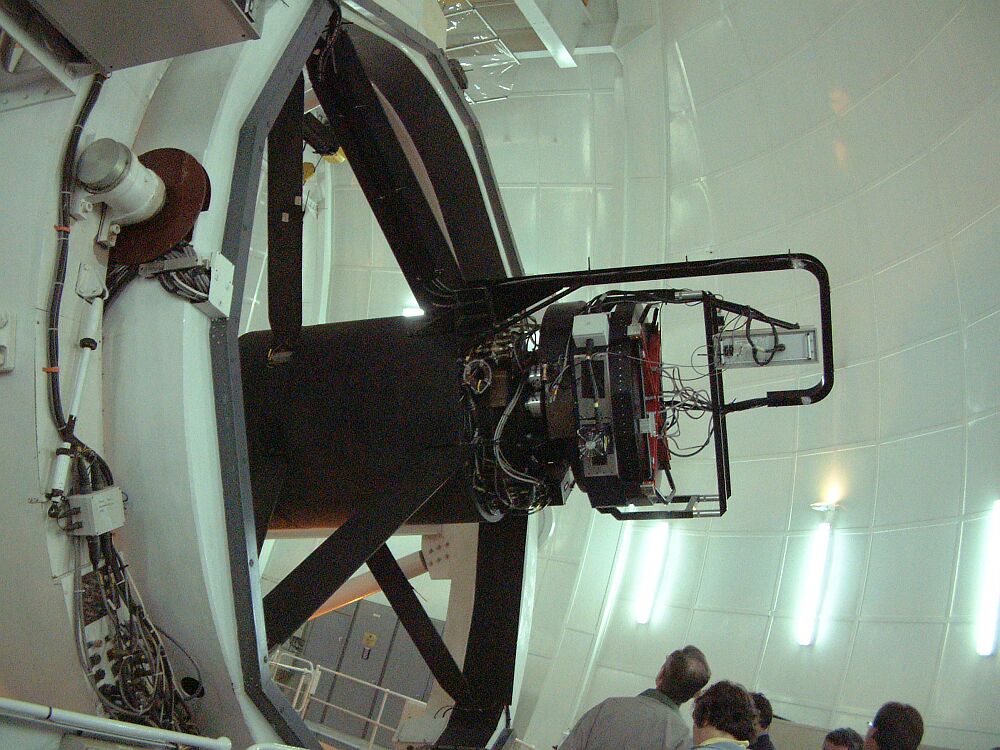
| TIFF ] Right: NAOMI in GHRIL, with INGRID in
the foreground. [ JPEG | TIFF ] |
|
|
|
|
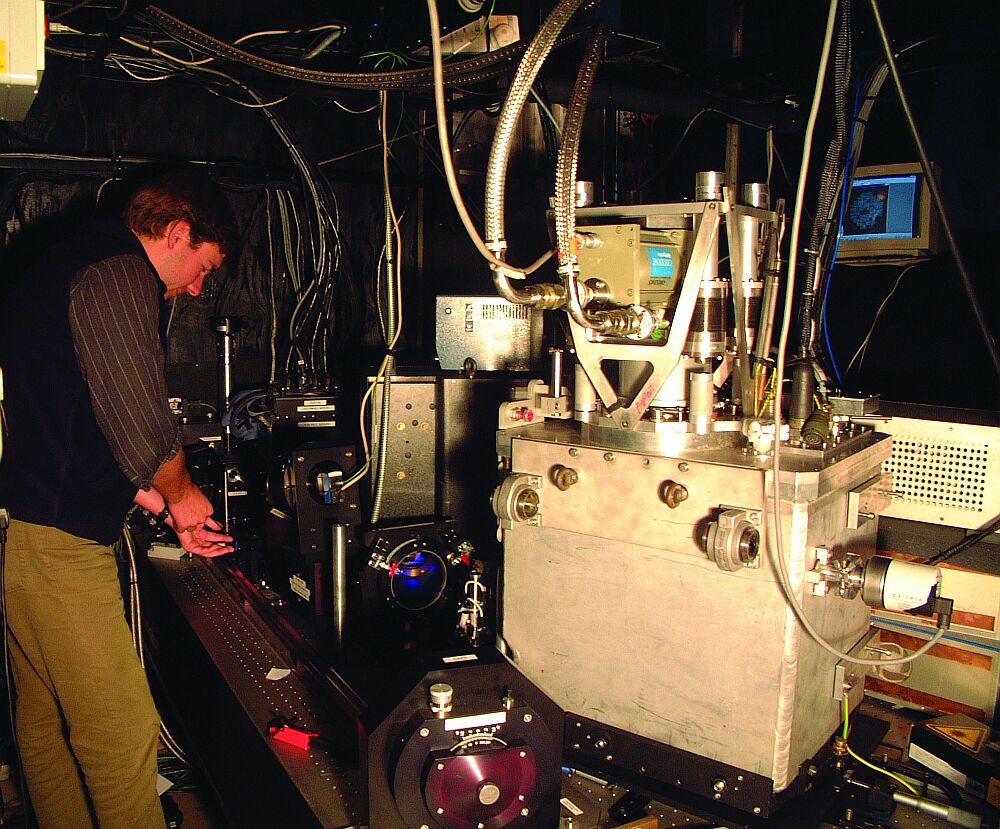
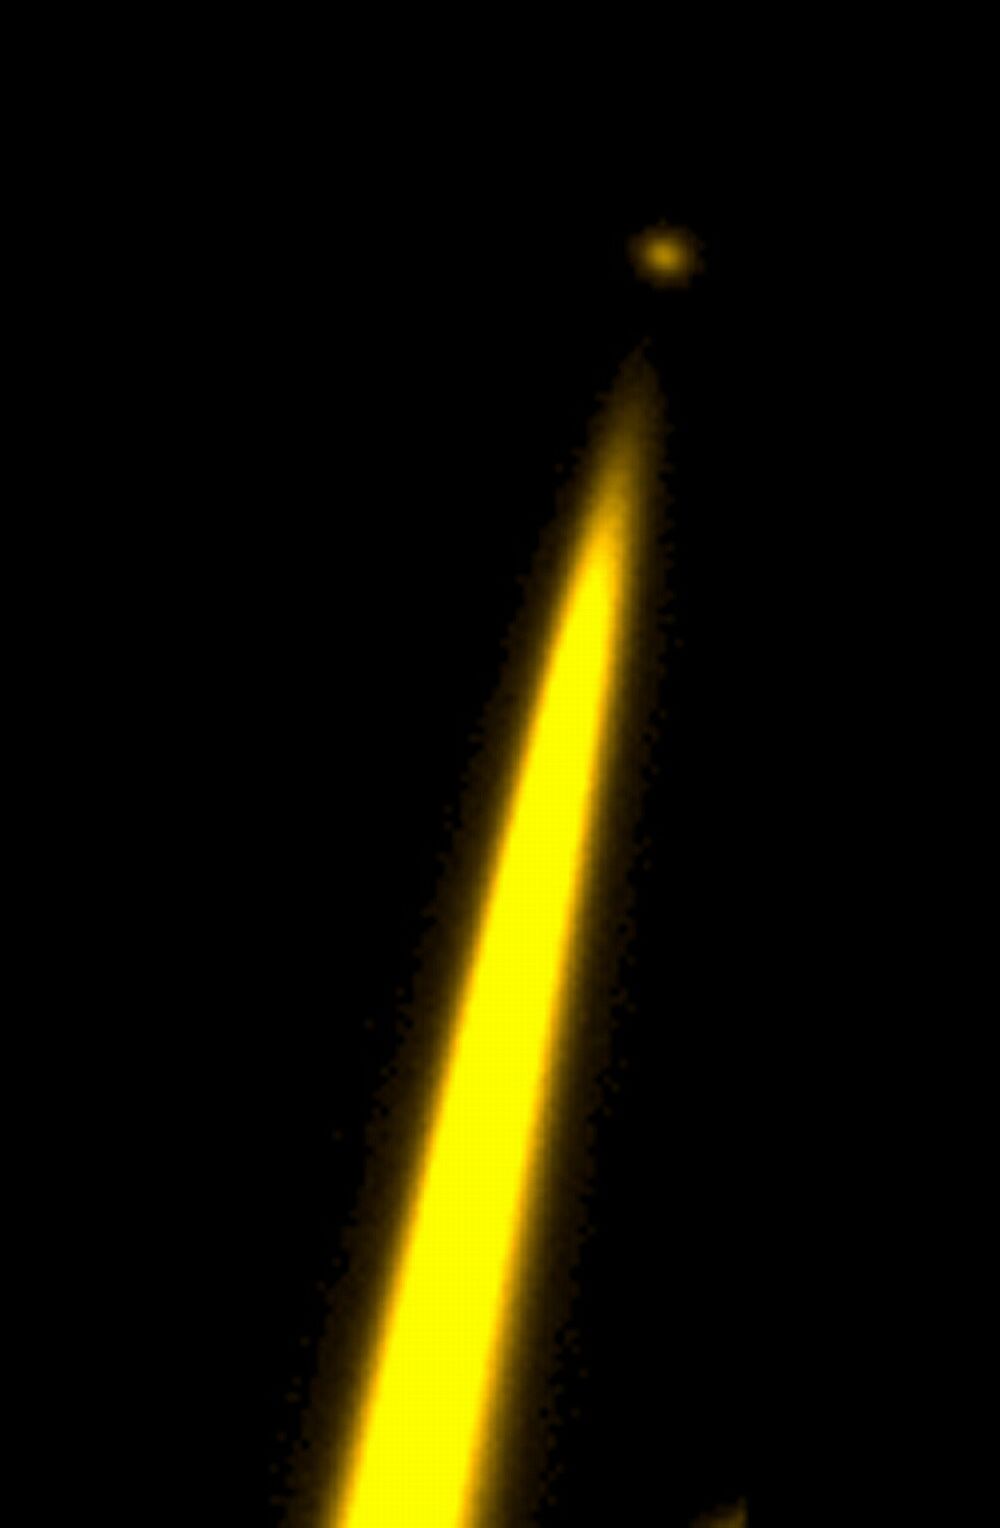
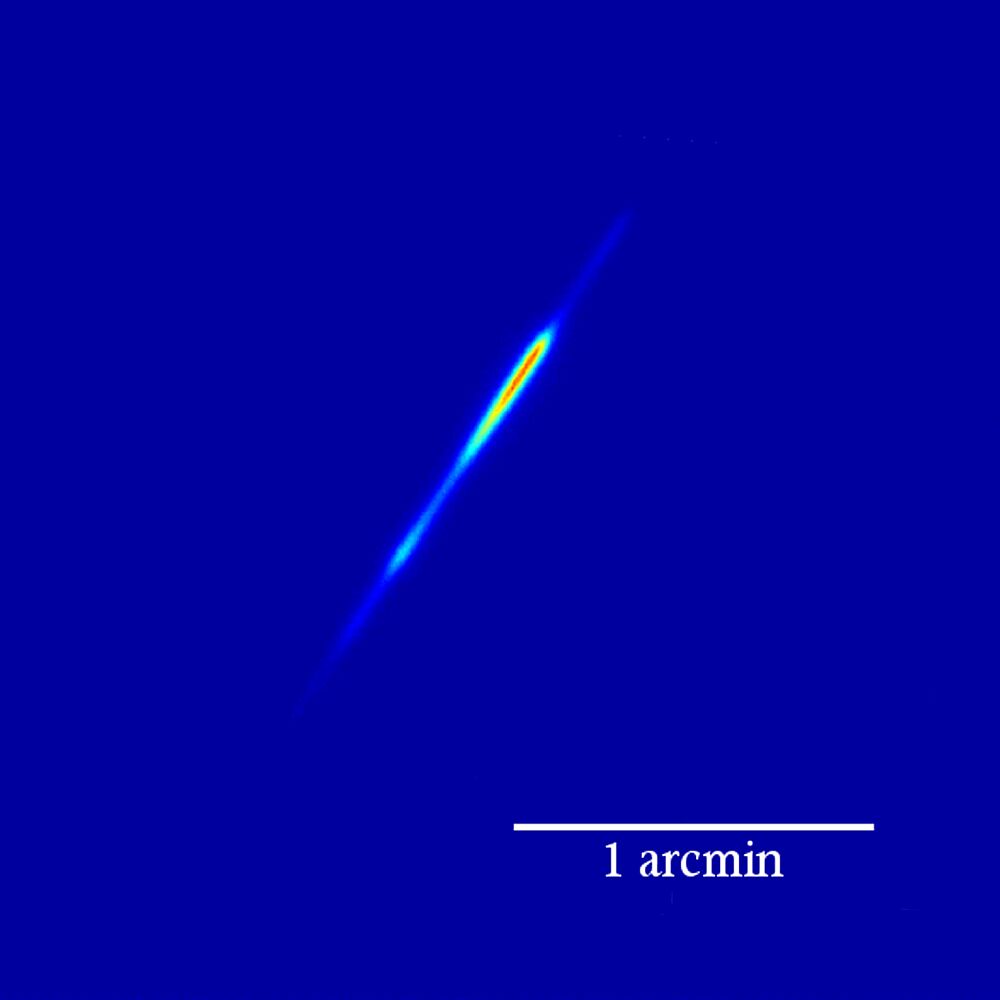
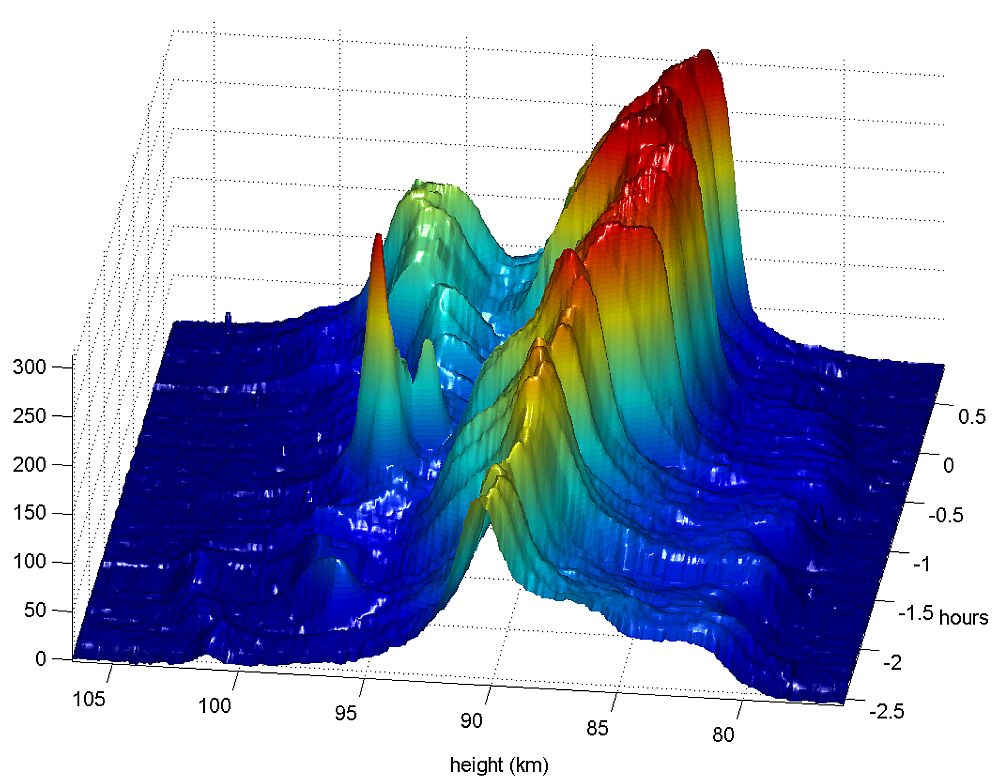
| Figure 7. Left: Sodium laser beam
projected in the sky. Clearly visible are the low altitude Rayleigh back
scatter plume and the sodium 'spot' at some 90 km above the observatory.
[ JPEG | TIFF ] Middle: The Sodium spot
at 90 km as seen from the Jacobus Kapteyn Telescope. Due to projection effects
the spot is seen elongated against the sky. [ JPEG | TIFF ] Right: Temporal and
spatial profile of the sodium spot during one observing night. [ JPEG | TIFF ] |
||
|
|
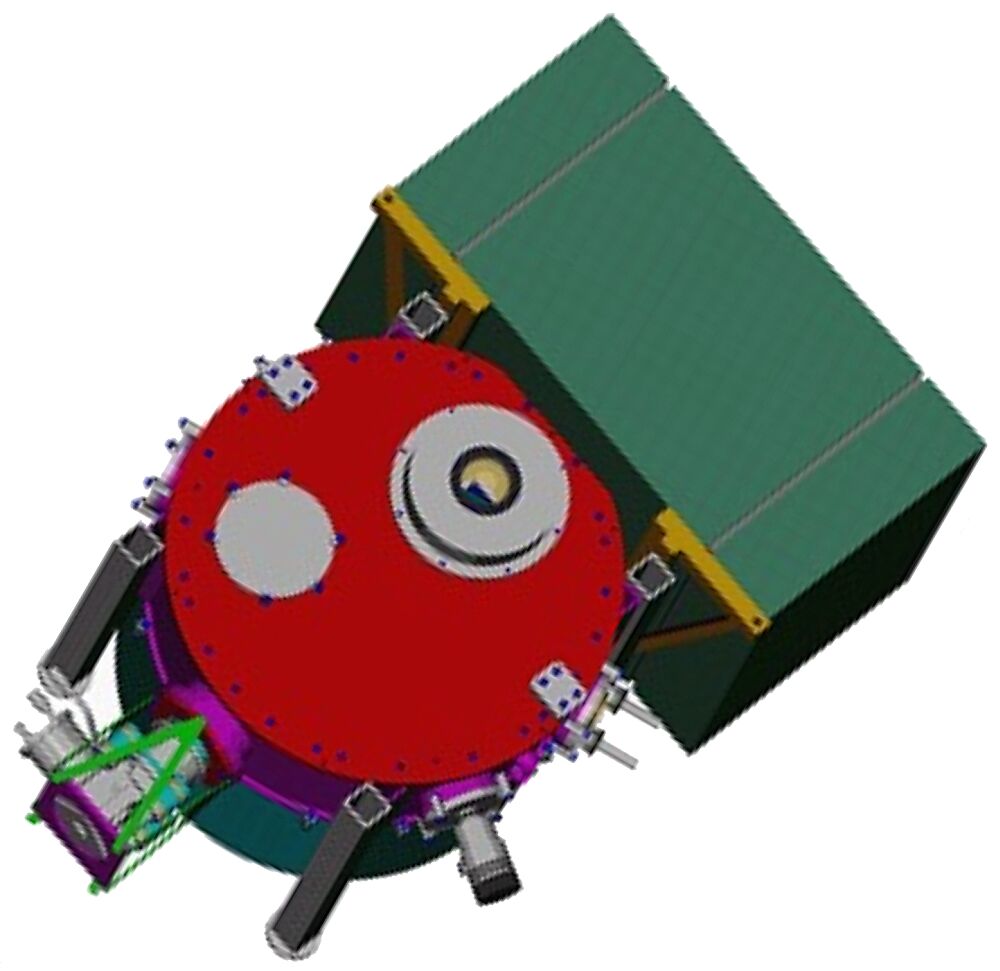
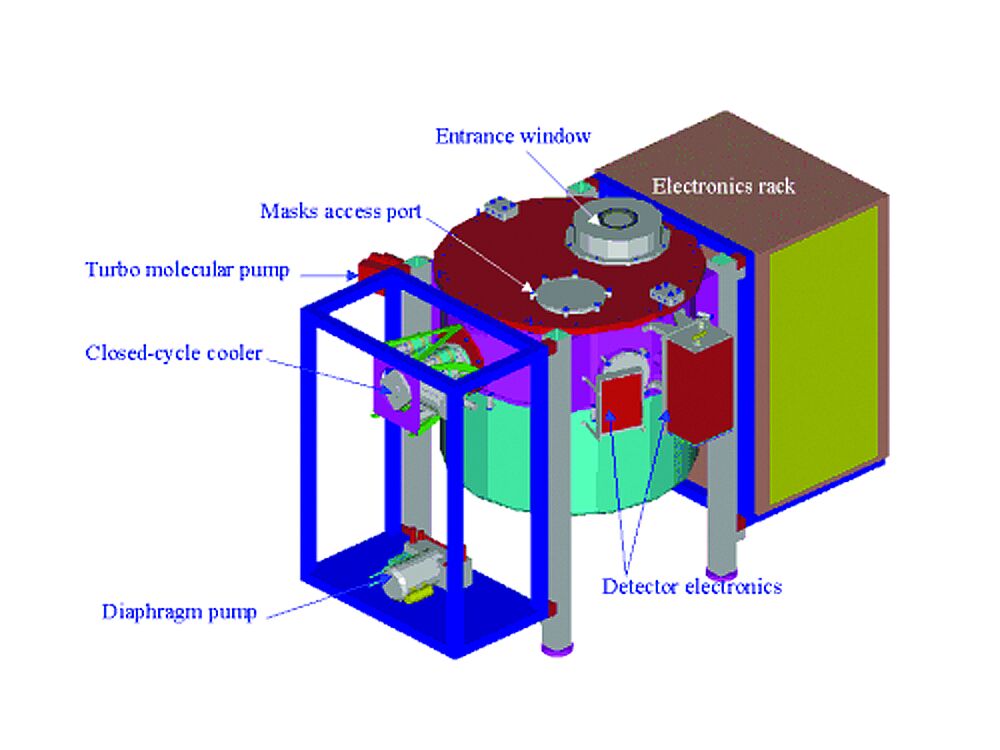
| Figure 8. LIRIS external schematic
view. Left: [ JPEG | TIFF
] Right: [ JPEG | TIFF
] |
|