 | |||
|

| Home > Public Information > ING Annual Reports > 2000/2001 > Chapter 3 |
|
| |||
|
| Home > Public Information > ING Annual Reports > 2000/2001 > Chapter 3 |
Other available formats: PDF
Chapter 3
Use of Observing Time and
Scientific Productivity
| WHT |
INT |
JKT |
||||
| 2000 |
2001 |
2000 |
2001 |
2000 |
2001 |
|
| UK PATT | 176 | 177 | 135 | 145 | 183 | 198 |
| NL NFRA PC | 42 | 43 | 34 | 35 | 48 | 51 |
| SP CAT | 62 | 66 | 71 | 70 | 68 | 72 |
| UK/NL WFS | — | — | 77 | 70 | — | — |
| ITP | 16 | 16 | 18 | 18 | 16 | 18 |
| Service | 26 | 24 | 21 | 18 | 16 | 16 |
| Instrument Builders’ Guaranteed Time | 1 | 6 | — | — | — | — |
| Commissioning | 25 | 16 | 4 | 3 | 5 | 0 |
| Discretionary | 16 | 17 | 3 | 6 | 15 | 10 |
| Stand-down | 2 | 0 | 3 | 0 | 15 | 0 |
| Total | 366 | 365 | 366 | 365 | 366 | 365 |
| Table 1. Allocation of nights from
semester 2000A to semester 2001B. UK PATT allocation on the JKT includes
Irish time, and Portuguese time to semester 2000B. Service nights include
UK and NL service time, and SP CAT time includes also Spanish service time. |
||||||
|
|
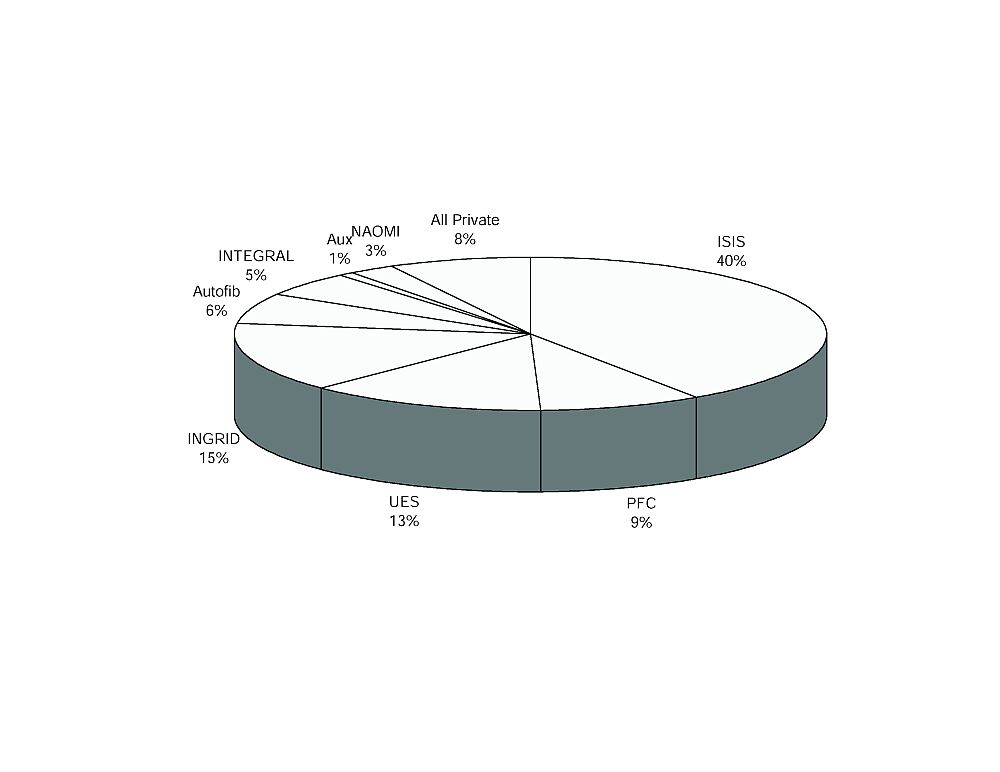
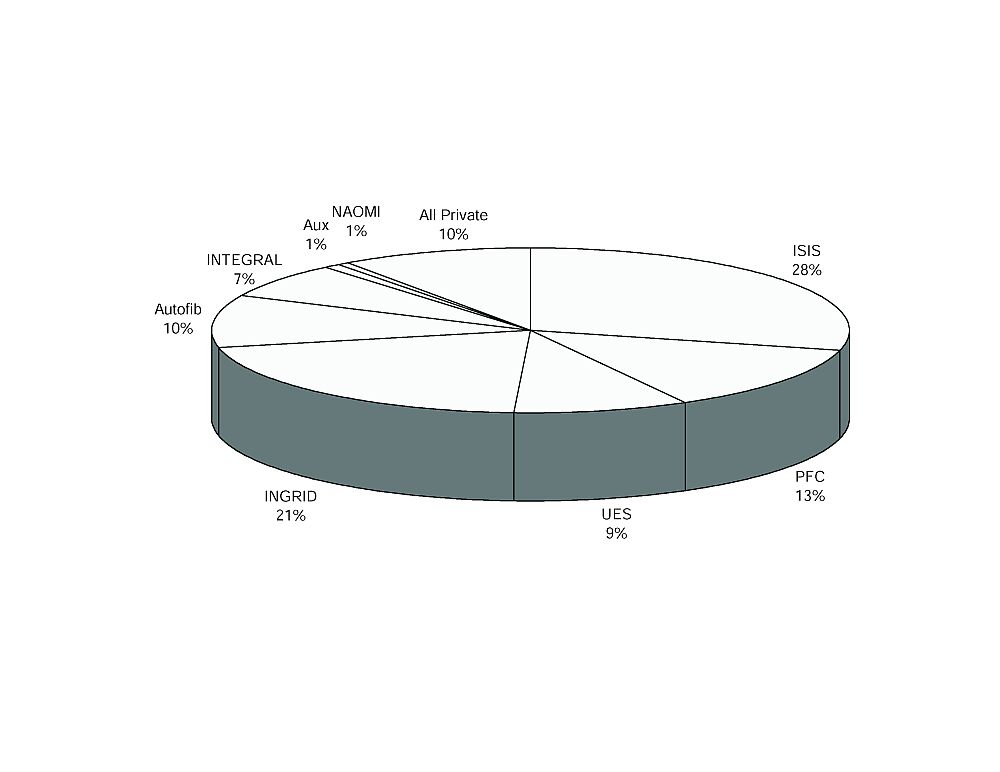
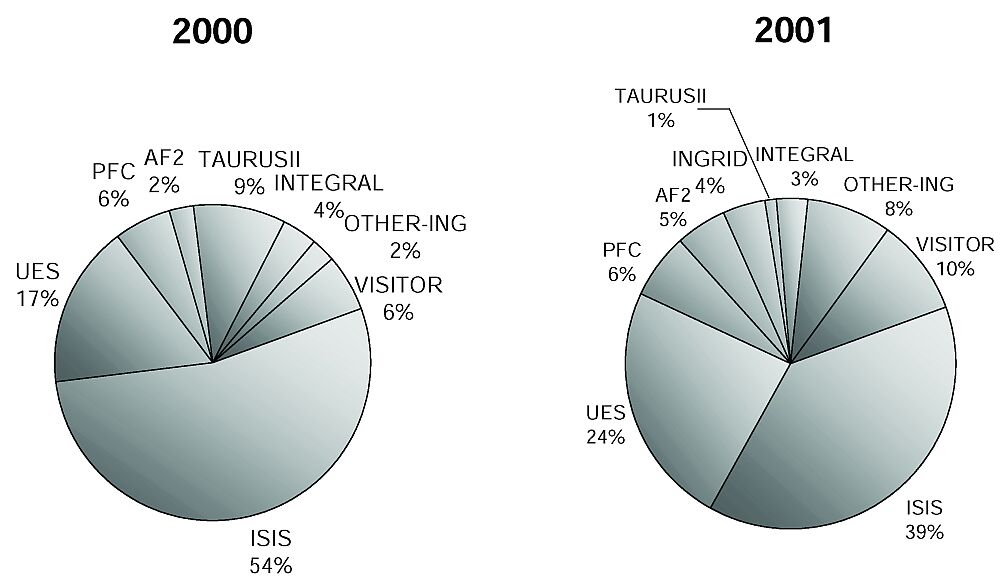
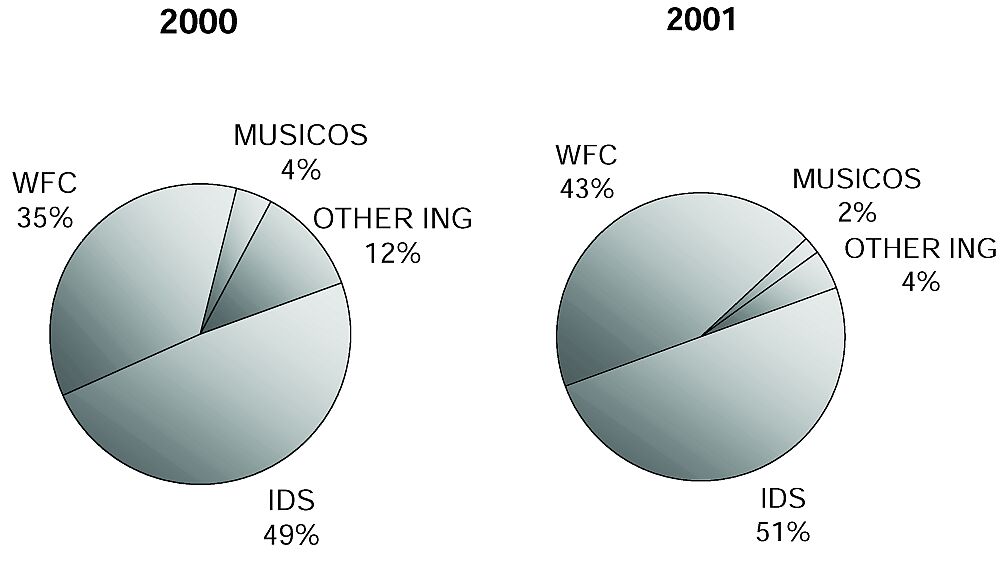
| Figure 1. Left: Use of instrumentation
in semesters 2000A and 2000B on the WHT. [ JPEG
| TIFF ] Right: The same for semesters 2001A
and 2001B. Commissioning nights are excluded. The abbreviations are explained
in Appendix K. [ JPEG | TIFF ] |
|
|
|
|
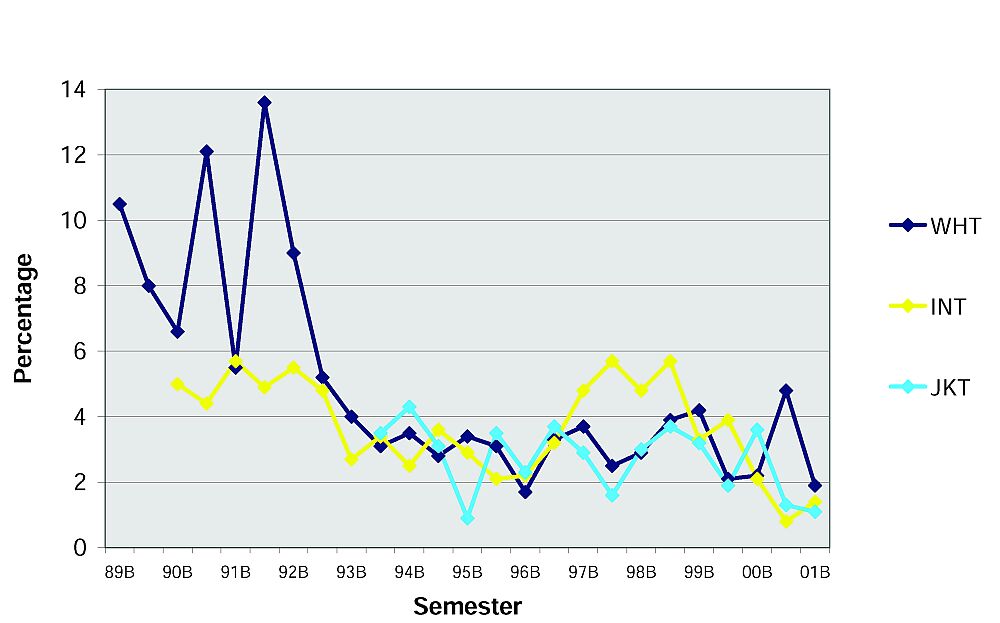
| Figure 2. Technical downtime per
semester. [ JPEG | TIFF
] |
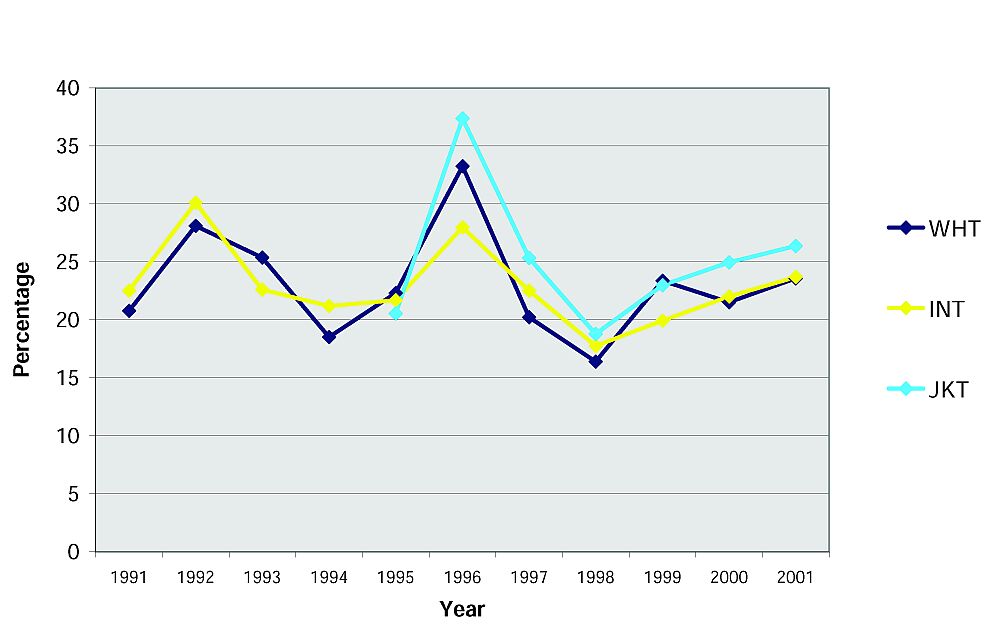
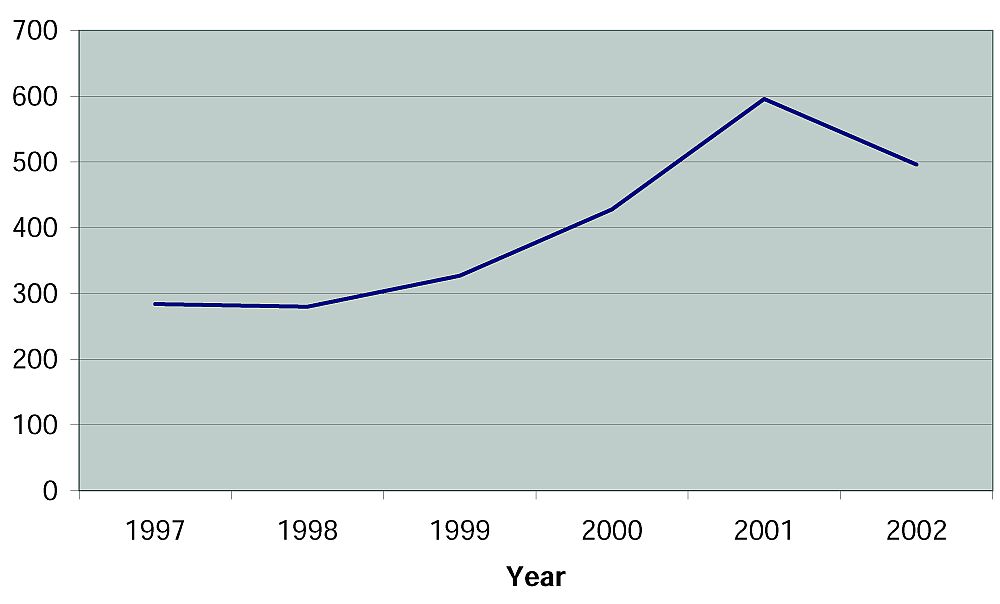
Figure 3. Weather down time per
year. [ JPEG | TIFF
] |
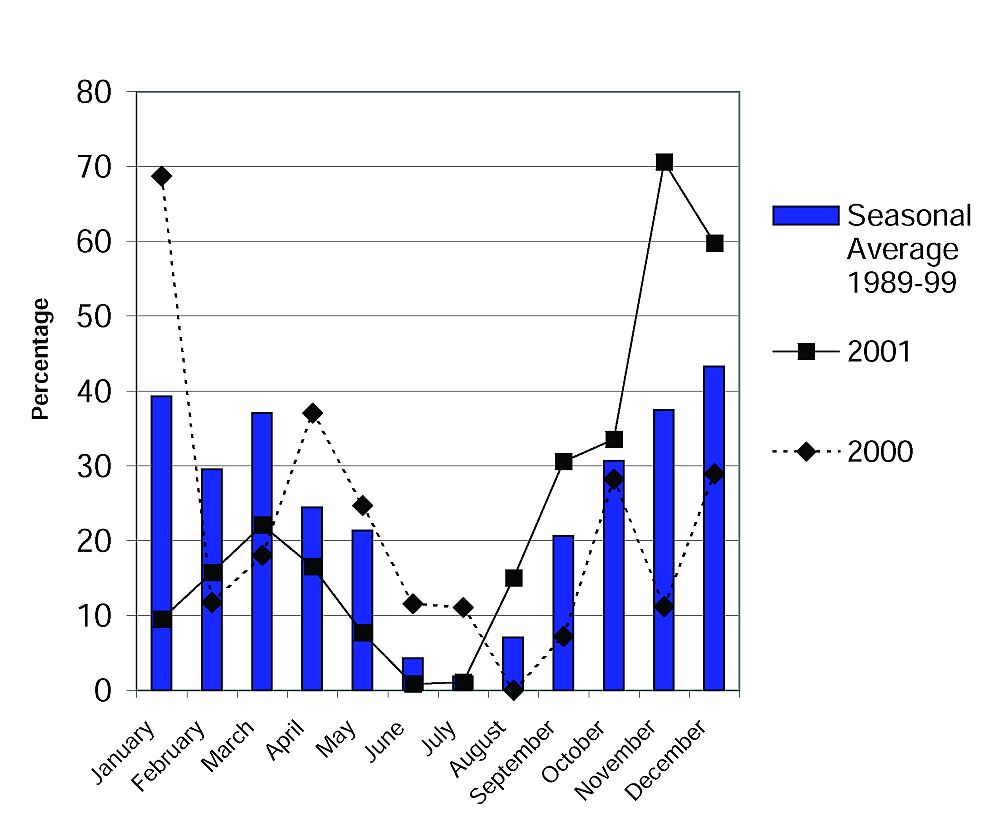
Figure 4. Monthly weather down
time. [ JPEG | TIFF ] |
|
|
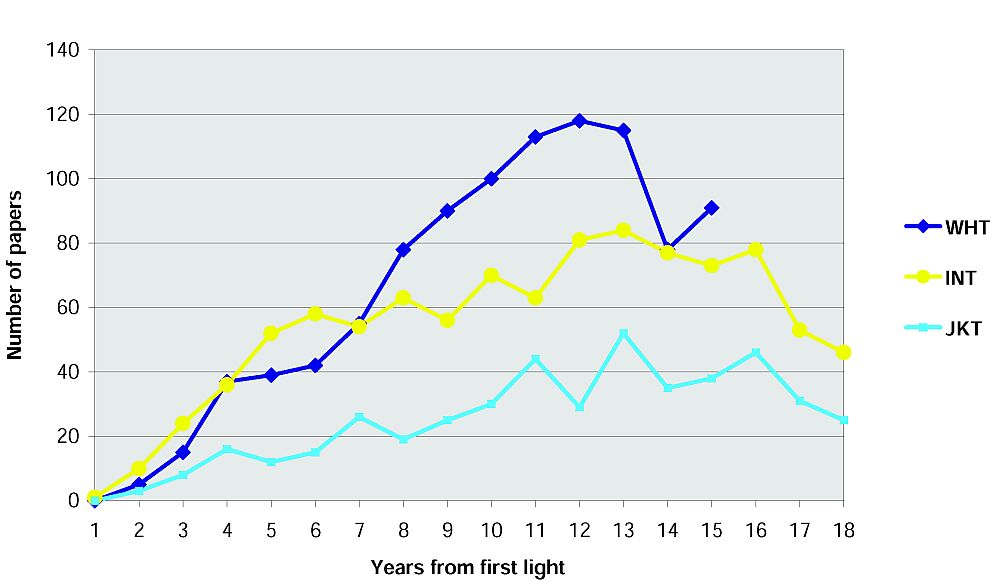
| Figure 5. Number of refereed papers
per telescope since first light. [ JPEG | TIFF ] |
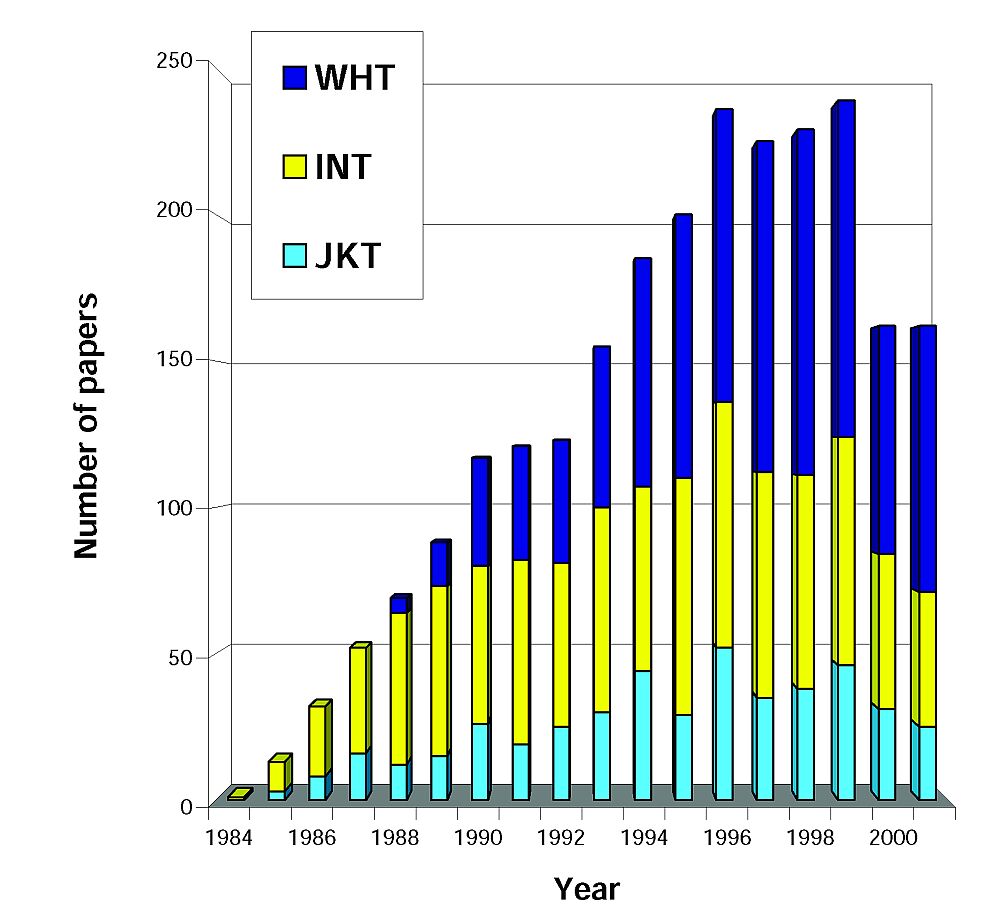
Figure 6. Total number of refereed
papers per year and telescope. [ JPEG | TIFF ] |
| WHT | INT | JKT | Total | |
| 1984 | — | 1 | — | 1 |
| 1985 | — | 10 | 3 | 13 |
| 1986 | — | 24 | 8 | 32 |
| 1987 | — | 36 | 16 | 52 |
| 1988 | 5 | 52 | 12 | 69 |
| 1989 | 15 | 58 | 15 | 88 |
| 1990 | 37 | 54 | 26 | 117 |
| 1991 | 39 | 63 | 19 | 121 |
| 1992 | 42 | 56 | 25 | 123 |
| 1993 | 55 | 70 | 30 | 155 |
| 1994 | 78 | 63 | 44 | 185 |
| 1995 | 90 | 81 | 29 | 200 |
| 1996 | 100 | 84 | 52 | 236 |
| 1997 | 113 | 77 | 35 | 225 |
| 1998 | 118 | 72 | 38 | 228 |
| 1999 | 115 | 78 | 46 | 239 |
| 2000 | 78 | 53 | 31 | 162 |
| 2001 | 91 | 46 | 25 | 162 |
| Total | 976 | 978 | 454 | 2408 |
|
| Figure 7. Use of instrument data in WHT papers.
[ JPEG | TIFF ] |
|
| Figure 8. Use of instrument data in INT papers.
[ JPEG | TIFF ] |
|
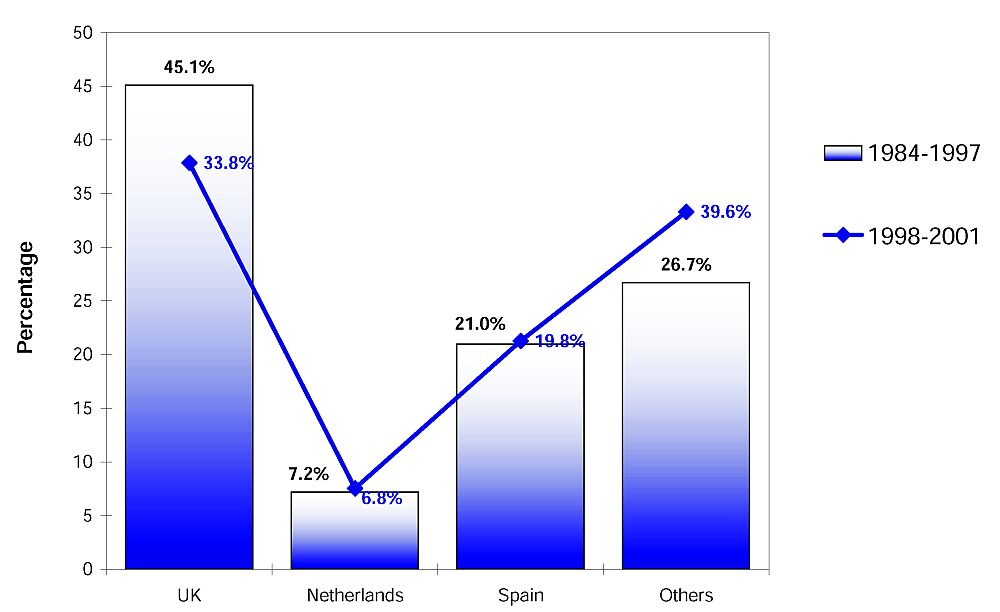
| Figure 9. Paper authorship.
[ JPEG | TIFF ] |
|
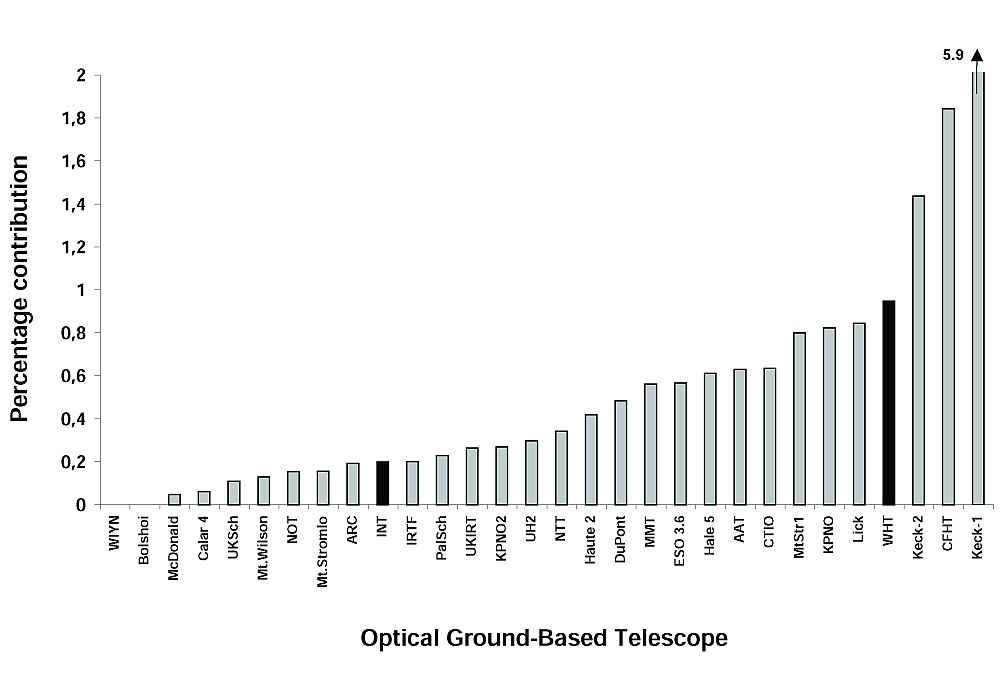
| Figure 10. Result from a citation index study of
the 1000 top-cited astronomy papers (125 top papers per year) from 1995 to
1998. [ JPEG | TIFF ] |
|
| Figure 11. Number of archive requests. [ JPEG | TIFF ] |