 | |||
|

| Home > Public Information > ING Annual Reports > 2000/2001 > Chapter 1 |
|
| |||
|
| Home > Public Information > ING Annual Reports > 2000/2001 > Chapter 1 |
Other available formats: PDF
Chapter 1
Scientific Highlights
|
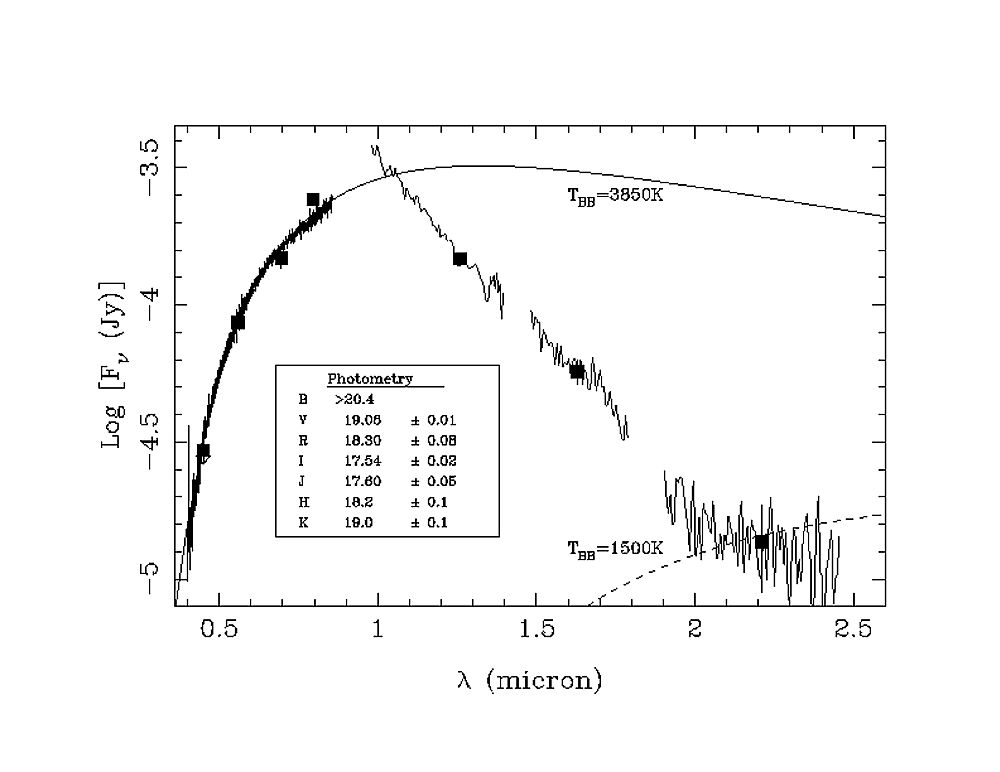
| Figure 1. The spectrum of the halo white dwarf
WD0346+246 showing the dramatic effects of collision induced absorption
by molecular hydrogen in the infrared. Thus the object appears red in the
optical, but blue in the infrared. [ JPEG | TIFF ] |
|
|
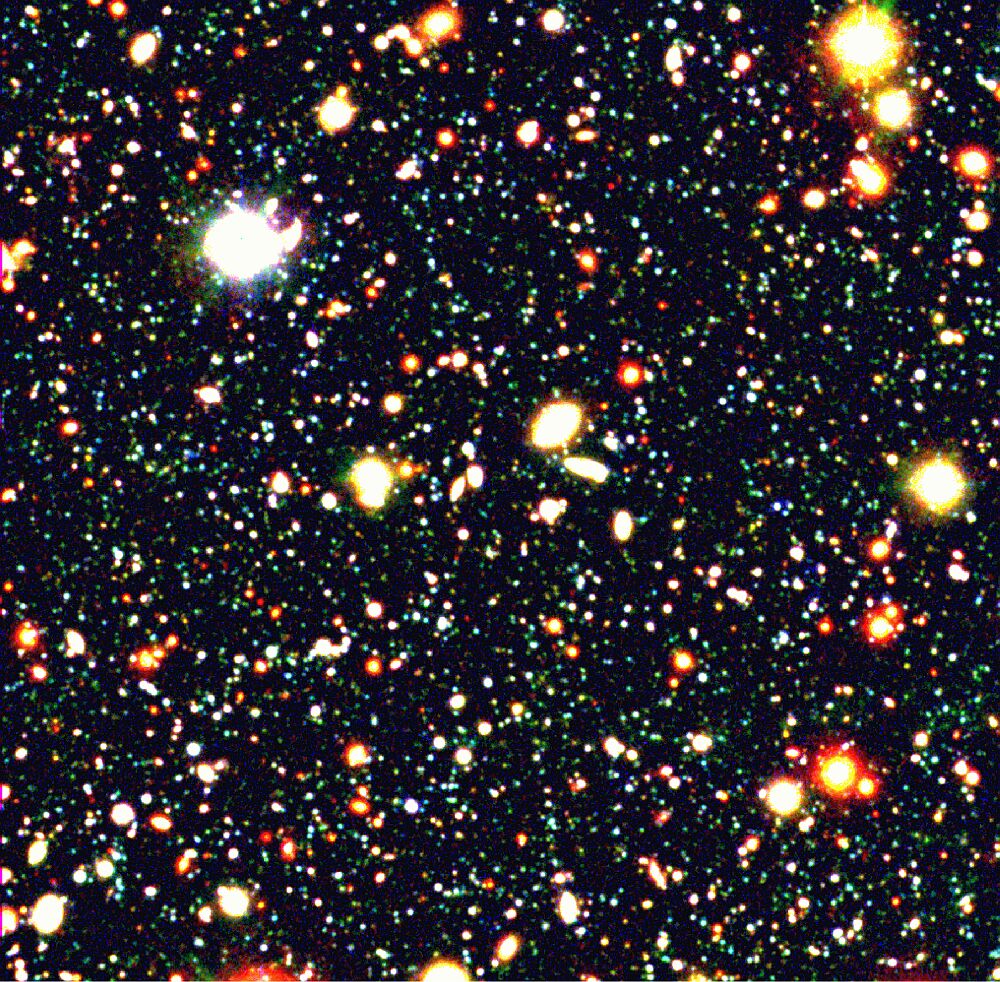
| Figure 2. Left: A
true colour image of the William Herschel Deep Field, formed by mapping
U, B and R exposures onto blue, green and red respectively. The image covers
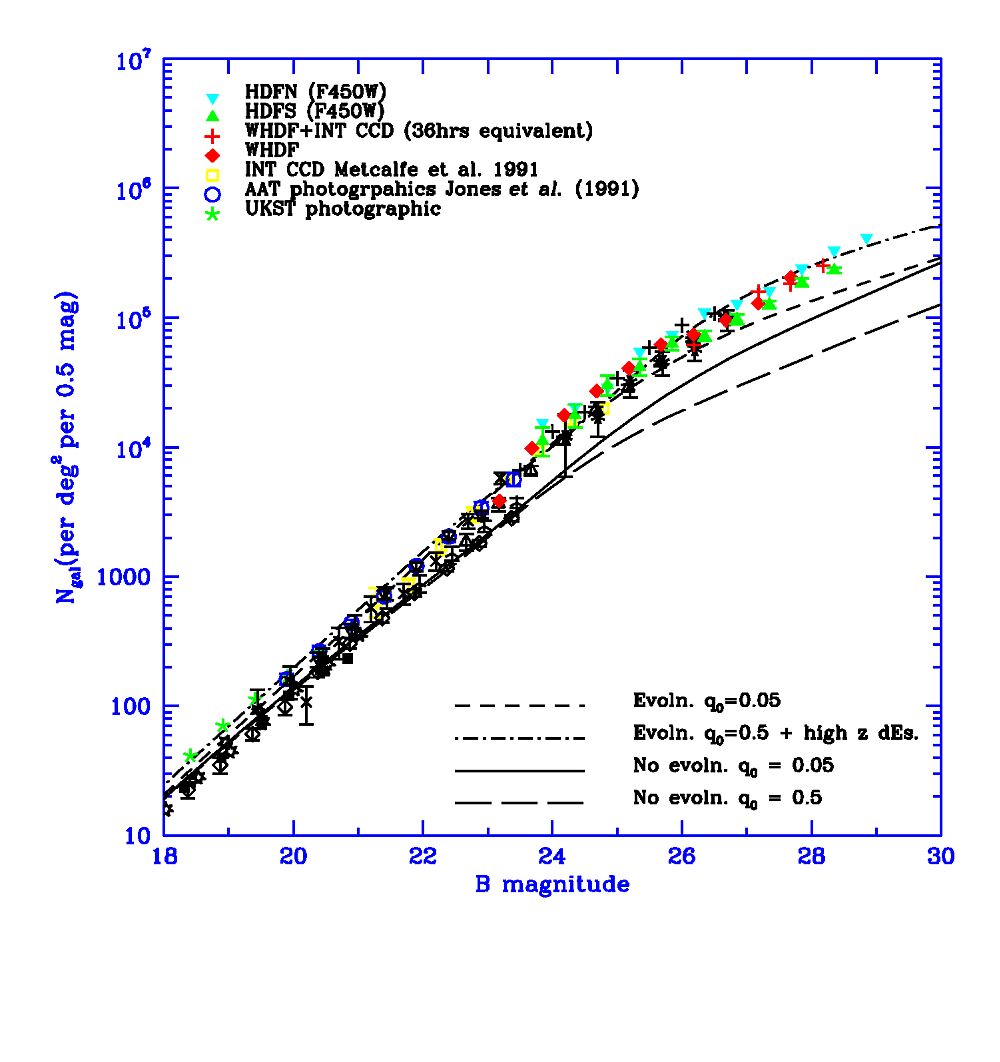
7×7 arcminutes. Right: This shows the B-band galaxy counts for the
WHDF compared with other data, including the Hubble Deep Fields. Also shown
are the predictions for a universe in which galaxies do not evolve with time,
and those for which galaxies follow simple stellar population synthesis tracks.
Two geometries are considered, q0=0.05 (open) and q0=0.5
(flat). It is clear that non-evolving models underpredict the counts from
quite bright magnitudes (B~22). Even an open evolving model struggles to
keep up with the sheer numbers of galaxies seen, although there are probably
enough uncertainties in this model to ‘tweak’ it higher at faint magnitudes.
Those who favour a closed universe have to relax the constraint that galaxy
numbers are conserved (e.g. merging) or at the very least invoke a population
at high redshift which has disappeared from view by the present day (e.g.
fading dwarfs). The model shown is a version of the latter. [ JPEG 1 | TIFF 1 | JPEG 2 | TIFF 2 ] |
|
|
|
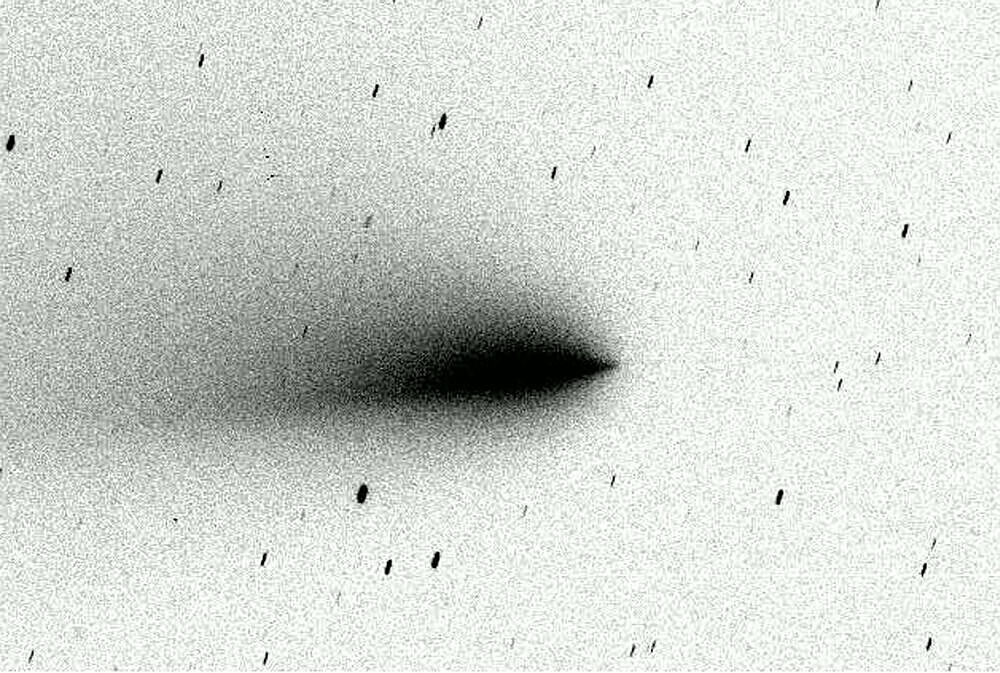
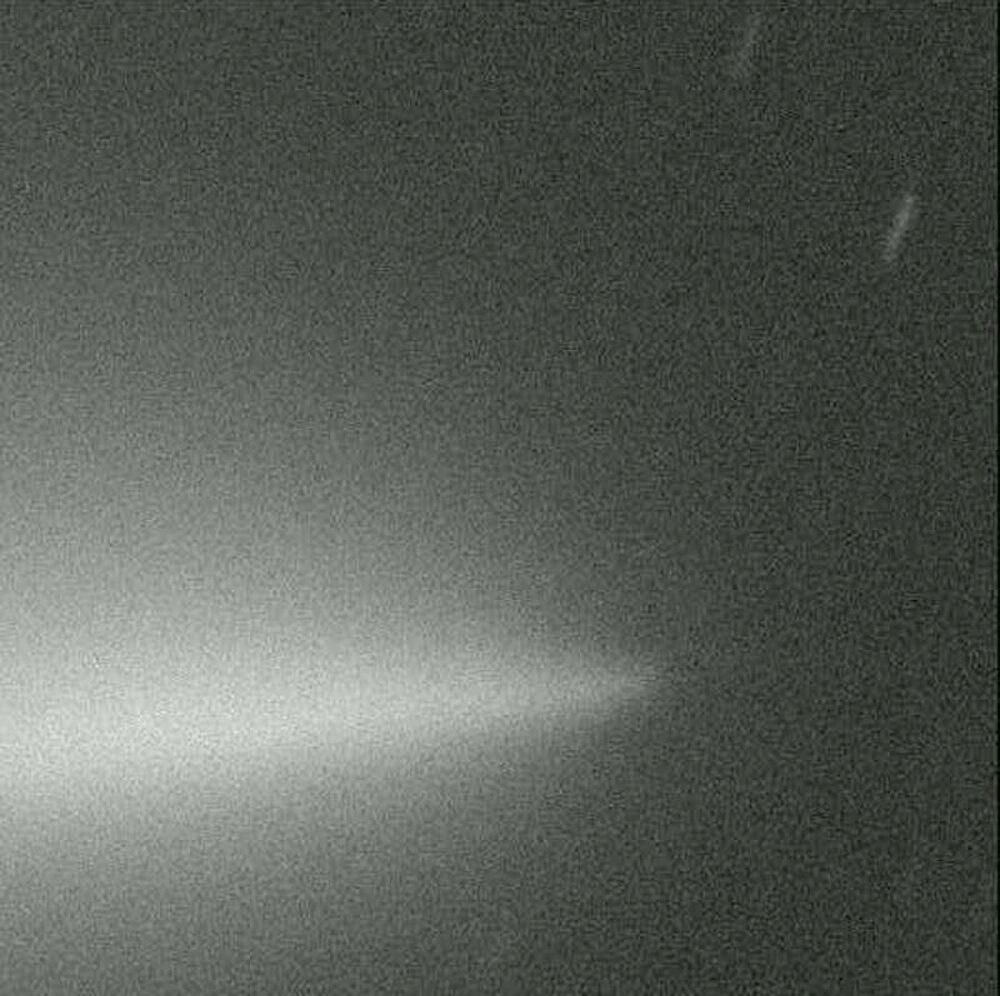
| Figure 3. Left: This
image, obtained on 1 August 2000 with the WFC on the INT, covers a field
of view of 22 arcminutes and is processed to show the faint tail of the
comet, which extends well beyond the edge of the field of view. Right: This
image obtained on the same night is a 100-second exposure with the WFC on
the INT. This section of the full image measures 4.5 arcminutes, equivalent
to 110,000 km at the comet. Again the image was processed to show faint
details in the coma of the comet. No features are seen in the image, which
implied that no significant individual fragments more than a few metres across
still emitted gas. This demonstrates the catastrophic disruption of the
nucleus. [ JPEG 1 | TIFF 1 | JPEG 2 |
TIFF 2 ] |
|
|
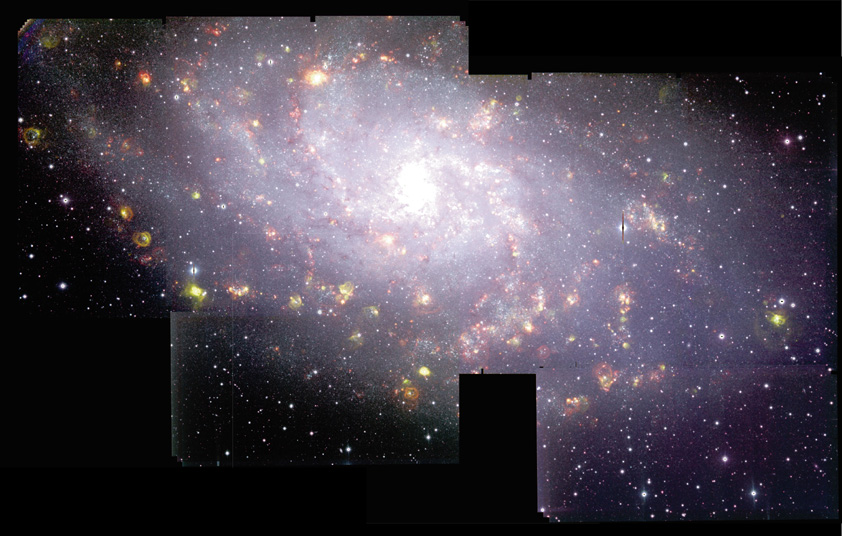
| Figure 4. This image is a composition of frames
taken in three narrow bands: the green colour represents the galaxian emission
in a filter centred on the [OIII] nebular line at 500.7nm, red is the Hα
emission at 656.3nm, while blue is mainly stellar light taken through a continuum
filter centred at 555.0nm (Stromgren Y). In only one observing night, and
with two positionings of the telescope, it was possible to cover nearly
the whole galaxy which has a size of approximately one degree in the sky.
[ JPEG | TIFF ] |
|
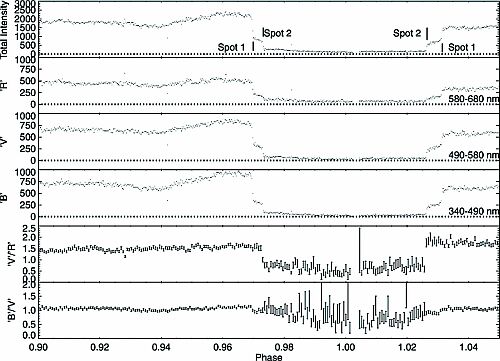
| Figure 5. Sky-subtracted and flat-fielded
total counts-1 (top), counts-1 in three bands: 340-490
nm (labelled 'B' for ease of reference), 490-580 nm ('V') and 580-700 nm
('R'), and two colour ratios constructed from the three energy-resolved
light curves for the first observed eclipse of UZ For. [ JPEG | TIFF ] |
|
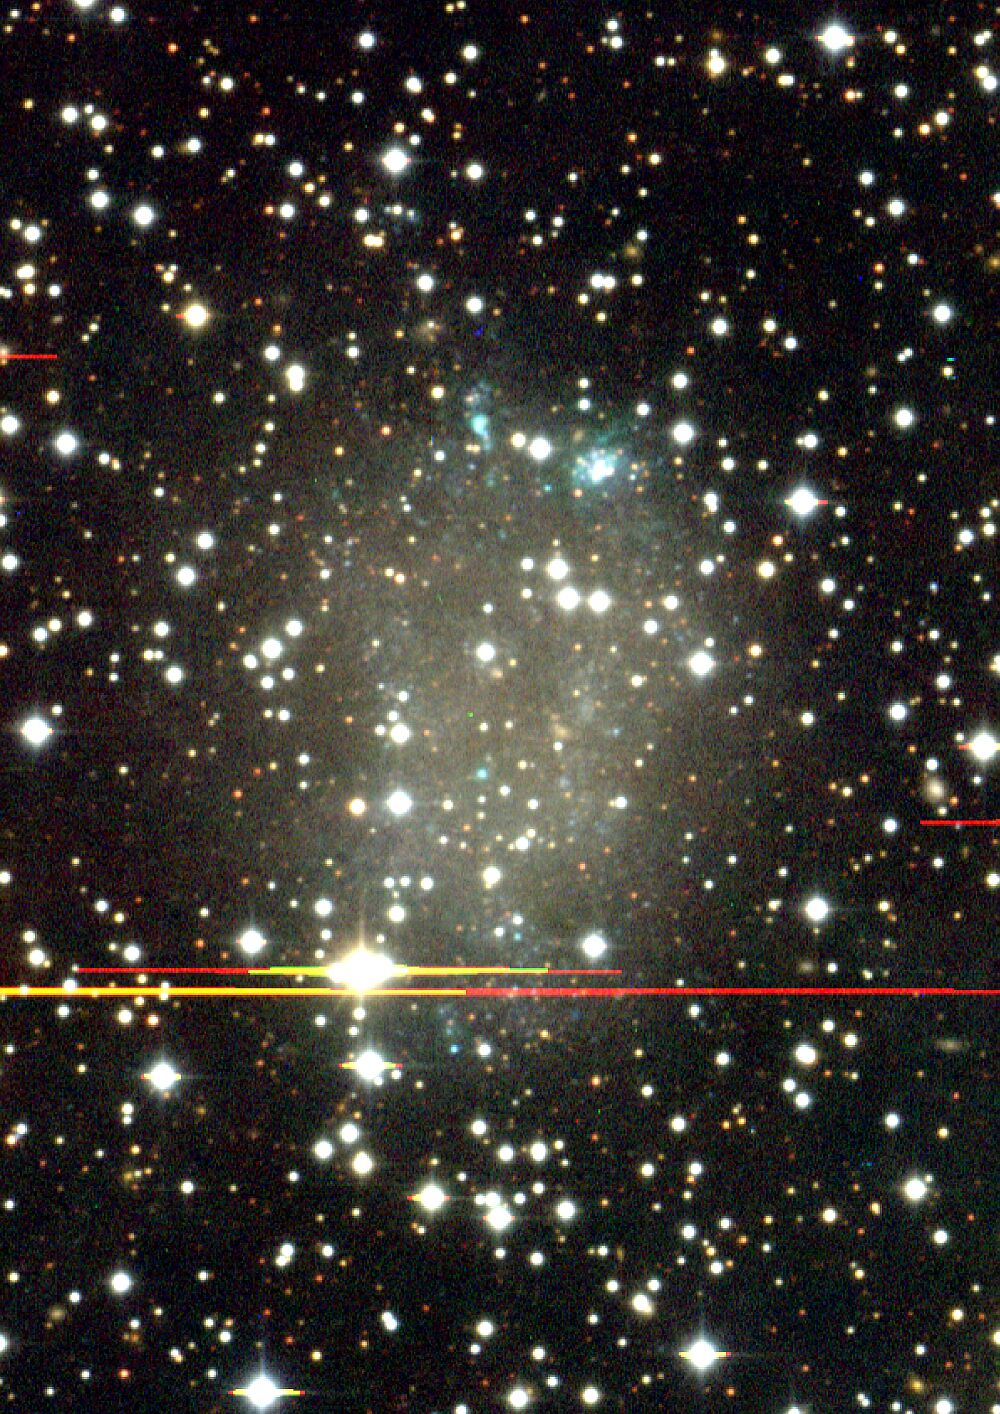
| Figure 6. Colour composite of Cepheus galaxy
created from 1200 second exposures in g', r' and i'-band images taken in
sub-arcsec conditions using the Wide Field Camera on the INT. [
JPEG | TIFF ] |
|
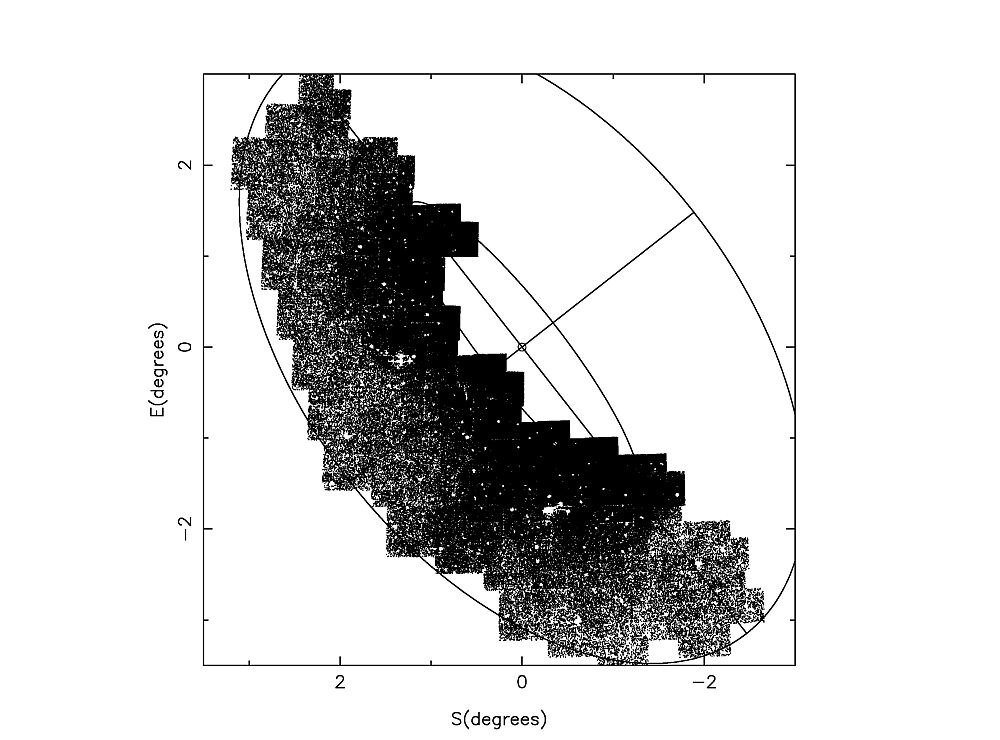
| Figure 7. Surface density of RGB stars over
the southeastern halo of M31. The over-density of stars is seen as a stream
extending out of M31 close to, but distinct from, the minor axis. [
JPEG | TIFF ] |
|
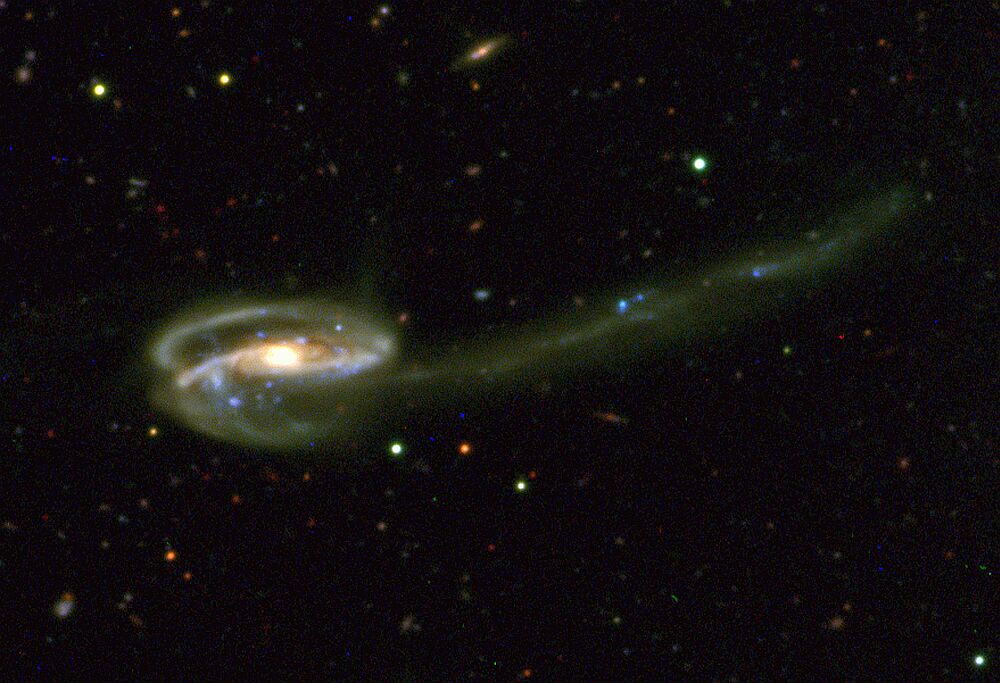
| Figure 8. From observations carried out as
part of the ING Wide-Field Survey astronomers have been able to identify
one place where a dark galaxy may exist. They noticed that the galaxy called
UGC10214, shown above, has a stream of material flowing out of it, as if
it is interacting with another galaxy. In this case, the stream of material
is apparently flowing towards nothing. [ JPEG
| TIFF ] |
|
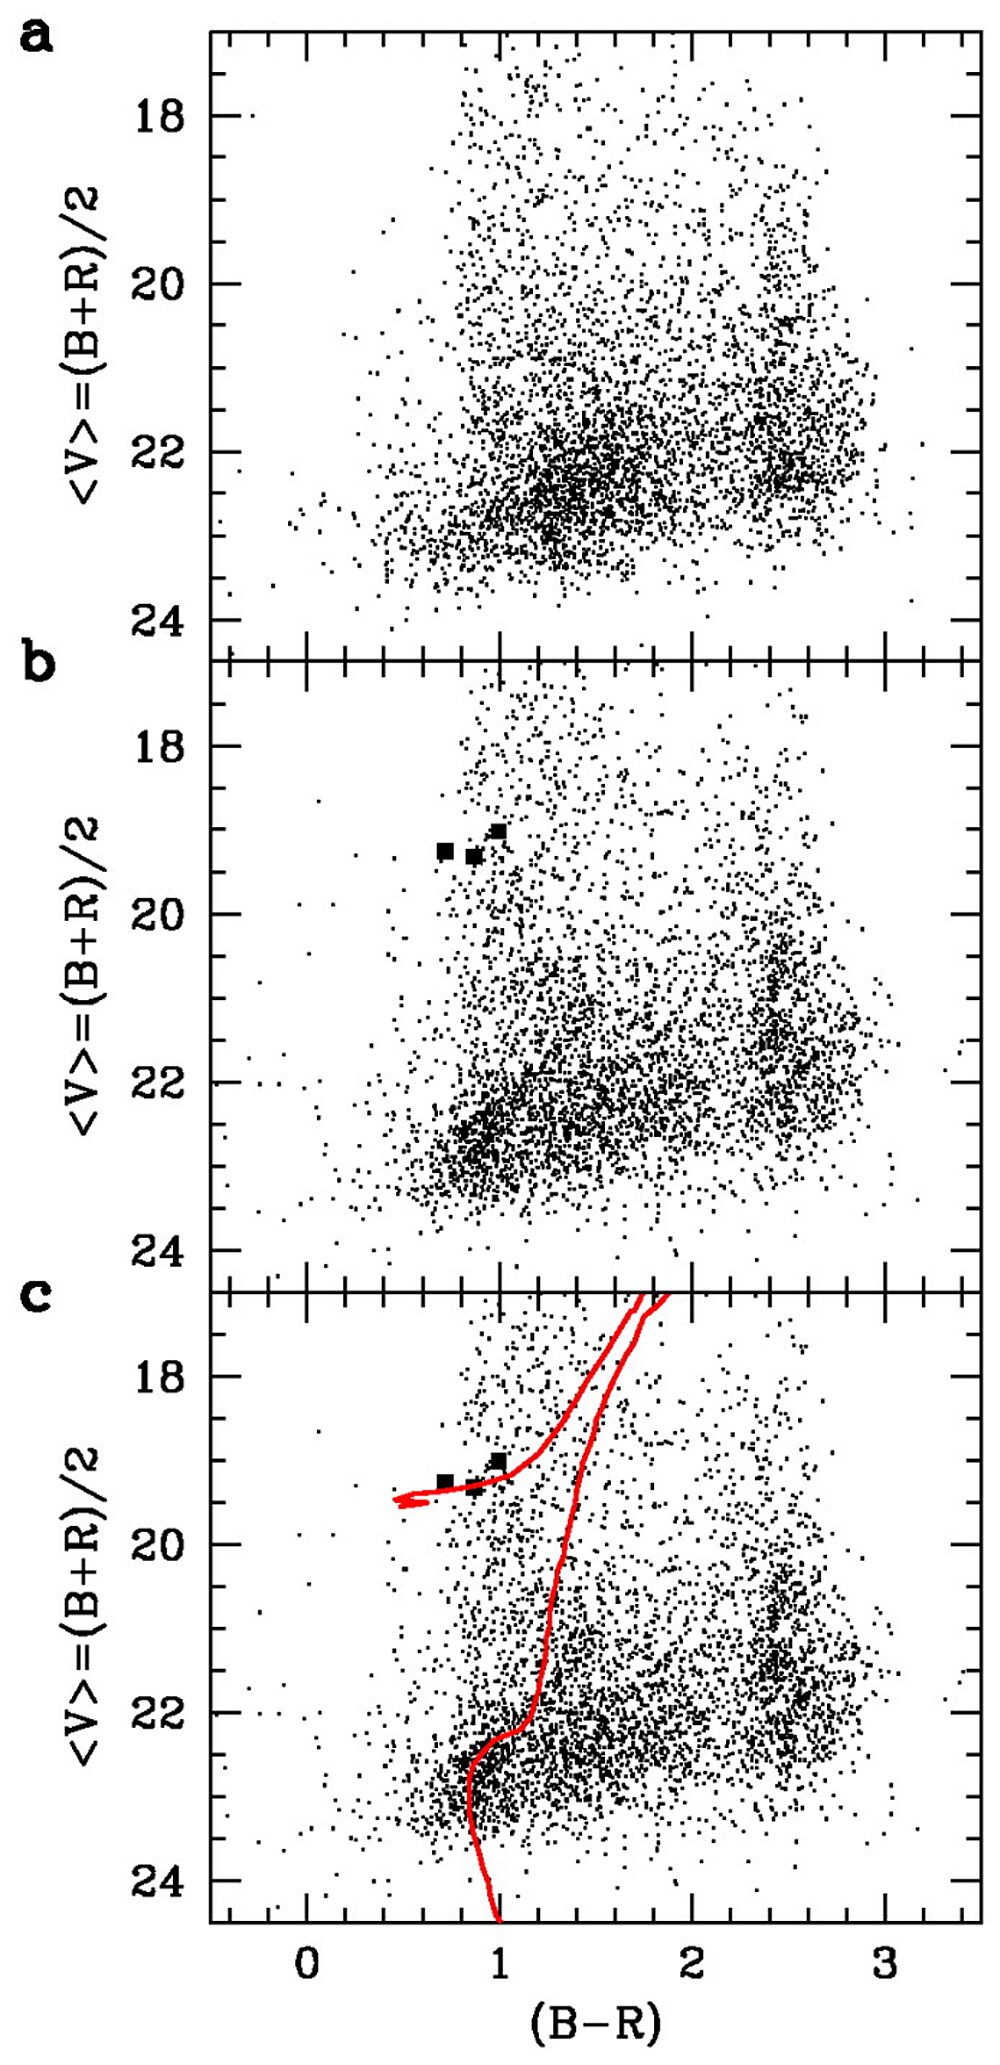
| Figure 9. Color-Magnitude Diagrams (CMD) of
the control (panel a) and target fields (panels b and c). Panel a provides
the distribution of the foreground Milky Way stars. The overdense strip
at (B–R) |
|
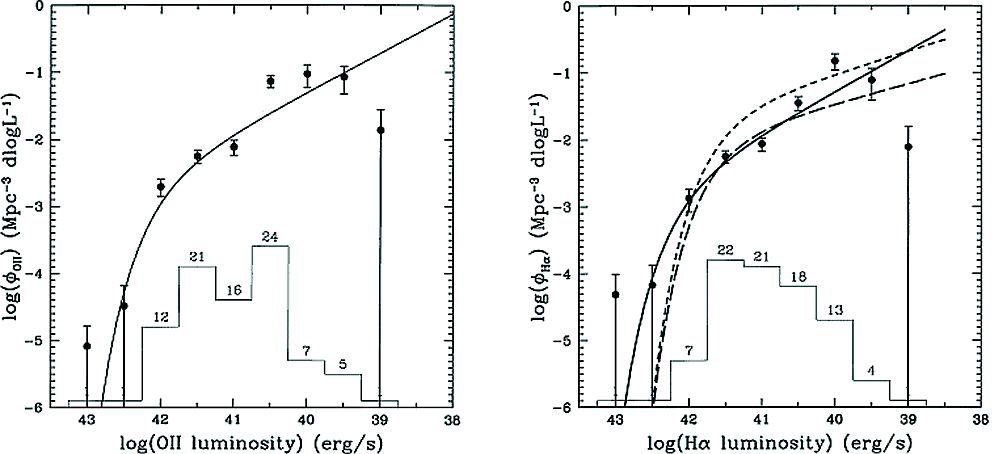
| Figure 10. Left: The dust-corrected
[O II] luminosity function derived from the AF2/WYFFOS sample (dots). The
best fit is shown by the solid line. Right: The dust-corrected Hα luminosity
function. The best fit is shown by the solid line. The short-dashed line
is the Ha luminosity function derived by Tresse & Maddox, 1998 (ApJ,
312, 691) in a similar redshift range, while the long-dashed line shows the
z |