 | |||
|

| Home > Astronomy > ISIS > ISIS image slicer |

|


ISIS image slicer
Performance summary
Introduction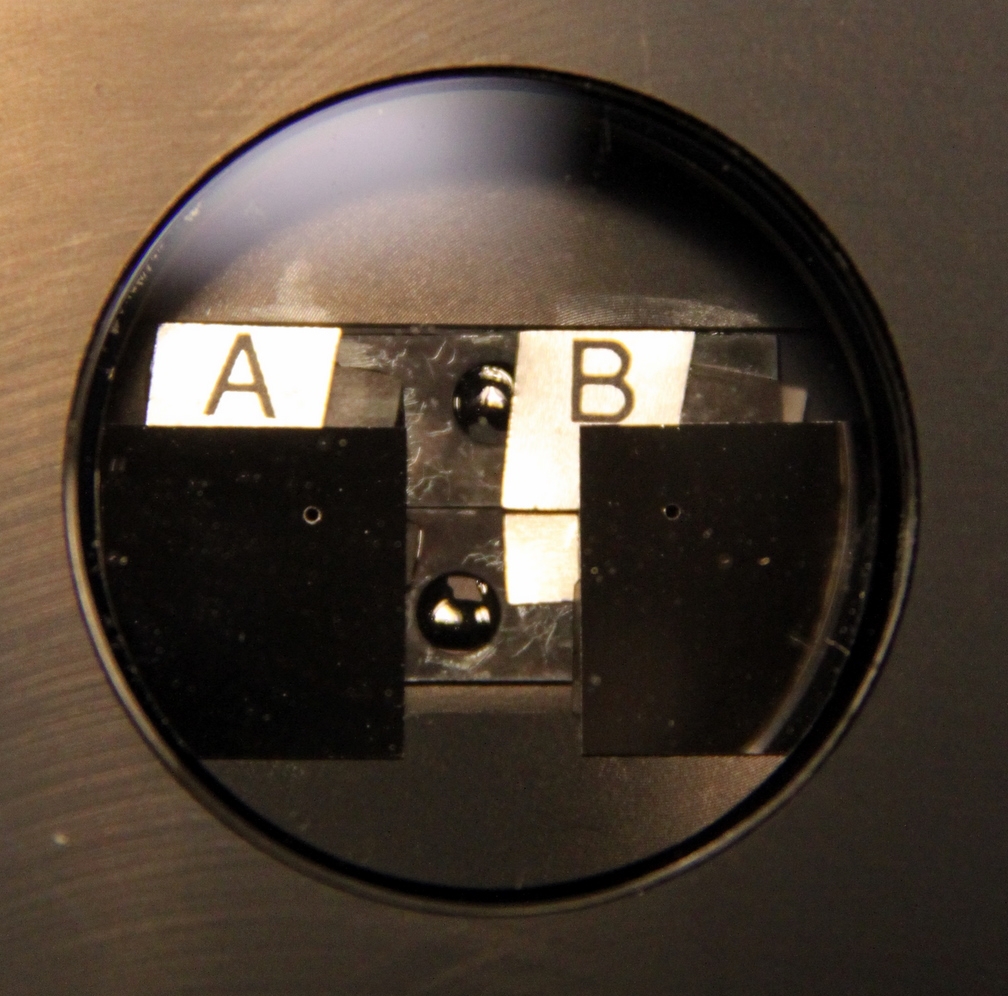 The ISIS image slicer viewed from above, where one can see two circular apertures labelled A and B, and the mini-slit of width 0.45 arcsec between them. The Bowen image slicer for ISIS was built by Tom Gregory for one of the ISIS multi-slit positions, and is used in place of the long slit when deployed. A photo of the image slicer is shown above, where one can see two circular apertures labelled A and B, and the mini-slit of 100 µm (~ 0.45 arcsec) width between them. The apertures A and B each have a diameter of 500 µm (~ 2.26 arcsec), and each has one image slicer below. Two metal plates around apertures A and B are covered with reflective material, so that when acquiring a target the acquisition camera can see the reflected light. The details of the optical
arrangement are shown in the diagram below, taken from and discussed in Pierce (PASP
77, 216, 1965). Once the star is acquired in aperture A or B, the light encompassed
by the 2.26 arcsec circular aperture travels down towards the small mirror (M in the
picture below) and is reflected to the slicer (S in the picture below),
from where it is reflected once more to the slit below, producing six and five slices
on the detector for slicers A and B respectively. The slit below slicers A and B also has
a width of 0.45 arcsec and is just a continuation of the mini-slit, so physically it is one
slit below and between apertures A and B.
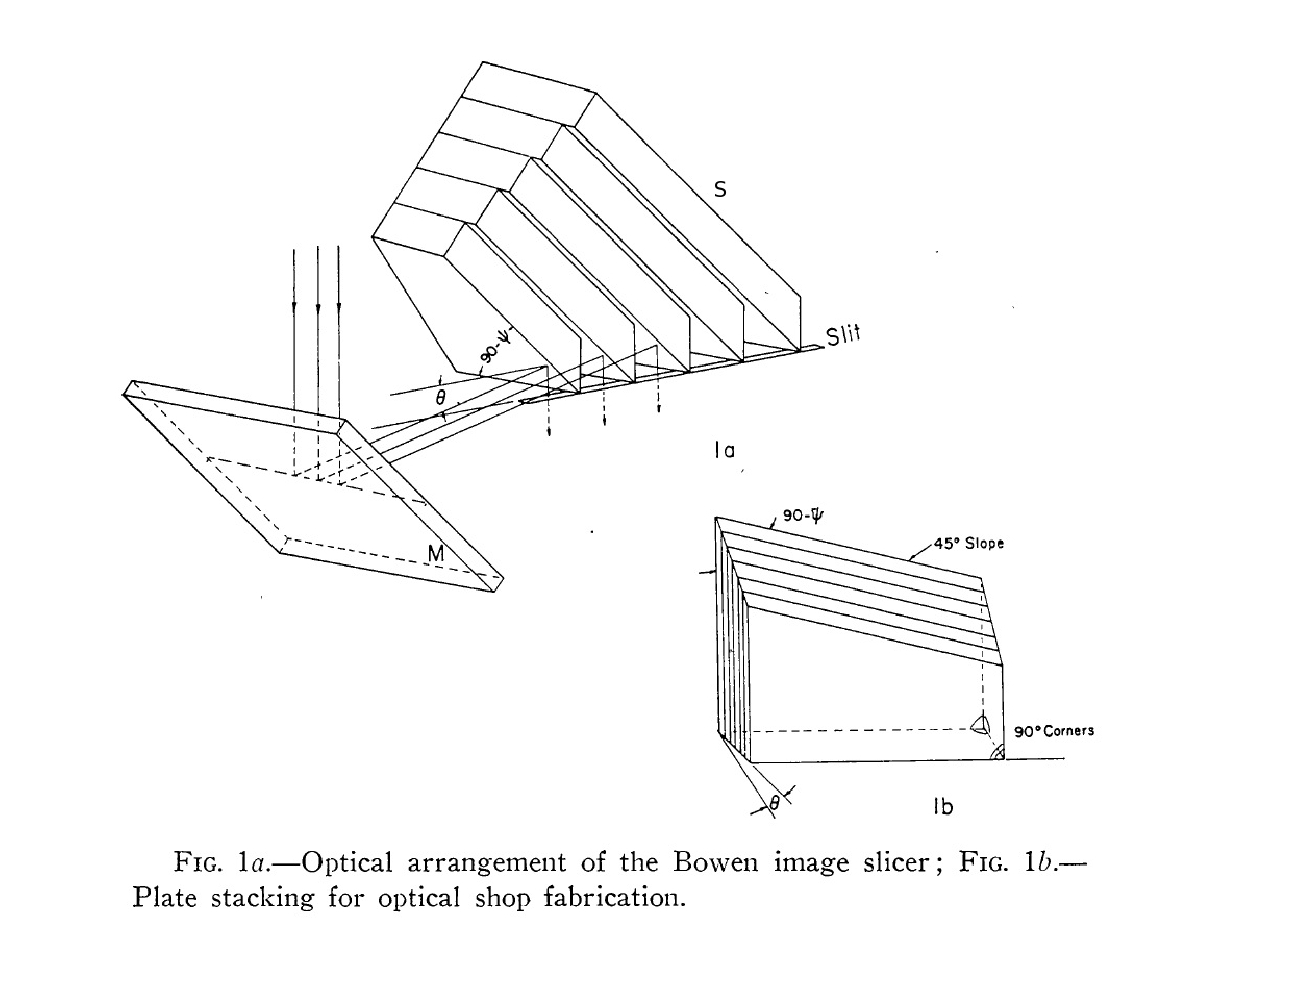 The details of the optical arrangement of the image slicer. Once the star is acquired, the light encompassed by the circular aperture travels down towards the small mirror M and is reflected to the slicer S, from where it is reflected once more to the slit below. The image slicer A has a broad-band, aluminium coated surface to cover the spectral range from 310 nm to the near infrared. The image slicer B has a wide-band dielectric multi-layer coating to enhance the throughput within the region of 390 to 850 nm. 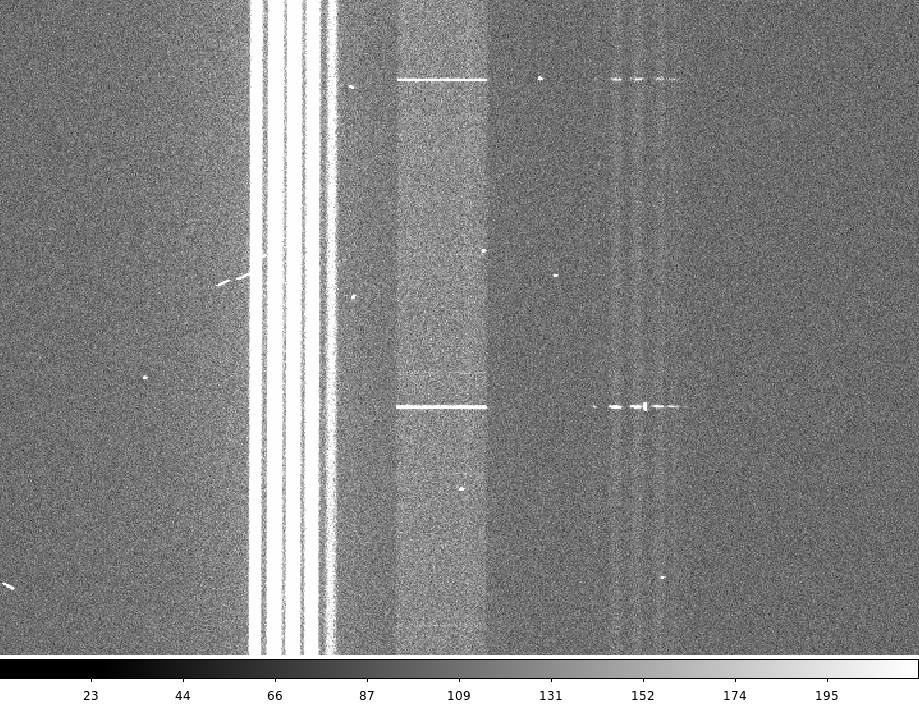 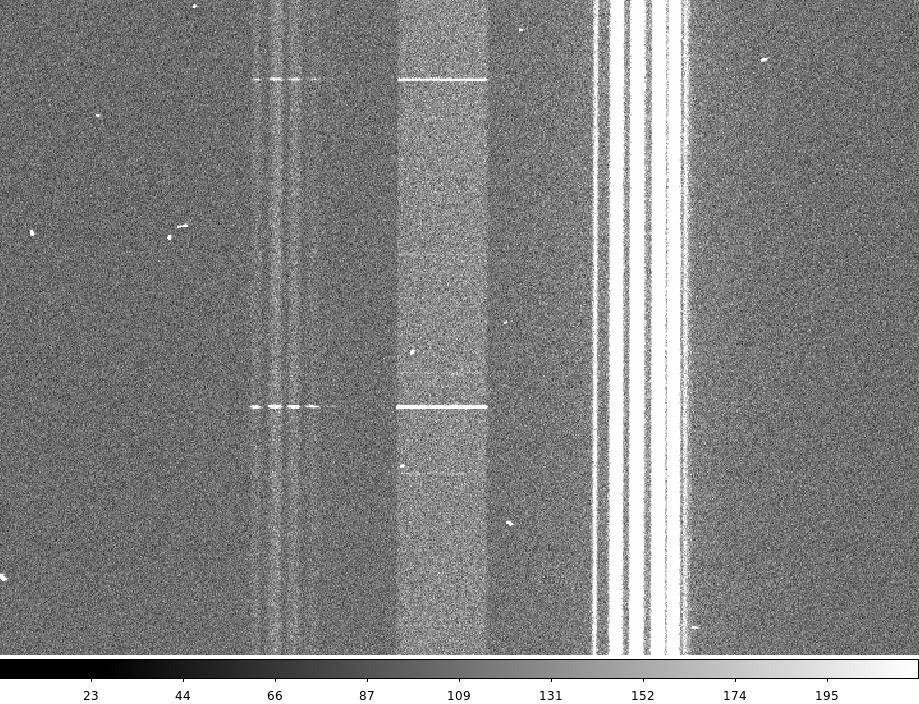 Spectra from image slicer B (top) and A (bottom) taken on the night of December 25 2012 with the R1200R grating and the Red+ detector in the red arm of ISIS. The sky lines can be clearly seen. Also, it can be seen that slicer B has 5 slices, whereas slicer A has 6 slices. Spectral resolution
An effect which is known to degrade spectral resolution for wavelengths <6000Å, and therefore will most strongly affect the resolution performance of the imager slicer in the blue arm, is charge diffusion in the detector. As the wavelength of incident light decreases, absorption of photons occurs closer to the surface of the CCD where the pixel potential wells are less-well defined. Therefore photoelectrons generated there have a greater tendency to diffuse into the wells of neighbouring pixels, degrading resolution in both the spectral and spatial directions. This effect is enhanced as wavelength decreases, and has a proportionally larger effect on the spectral resolution delivered with the smallest slits. It has been measured on the EEV12 detector to broaden lines for 2-pixel and 4-pixel long-slit projected widths by 20% (to 2.4 pixels) and by 10% (to 4.4 pixels) respectively, at a wavelength of 4000Å. Therefore, the expected spectral resolution at 4000Å wth the R600B grating and image slicer deployed would be reduced from 4444 to 3700 by charge diffusion. Measurements of the FWHM of unresolved lines in CuAr and CuNe calibration lamp
spectra taken with carefully focused R158R and R158B gratings are
consistent with the expected spectral resolutions.
Throughput predictionsFinally, we estimate the total
light losses to be 46% and 72% for slicers B and A, respectively, assuming
the entrance window protecting the apertures is clean. Therefore, the total
throughput is estimated to be 54% and 28% for the slicers B and A, respectively. Throughput measurements1) long slit with an 8 arcsec slit width to measure the throughput of the slicer versus total throughput of ISIS. Here we assume that the 8 arcsec slit width encompasses all of the light from the point source, taking into account that seeing was always <2 arcsec throughout all three nights. 2) long slit with 0.4 arcsec slit width to measure the throughput of the slicer versus throughput of the long slit image with a similar spectral resolution. 3) long slit with a slit width matching the seeing, to measure at which seeing it is beneficial to use the image slicer rather than the long slit. As an example we show the results from the night of 14 October 2013, when we used the R158B grating with a central wavelength of 4500Å in the blue arm, and the R158R grating with a central wavelength of 7500Å and a GG495 blocking filter in the red arm, and the 5300 dichroic. The extracted spectra for slicer B, slicer A, long slit of 8 arcsec, long slit of 0.4 arcsec and long slit matched to the seeing can be seen at the following links for the blue and red arms. The corresponding ratios of the extracted spectra can be seen at the following links for the blue and red arms. Image slicer performance and
recommendations
One thing to bear in mind when planning to use the image slicer is that each spectrum is collected over a larger number of pixels on the CCD than when using a long slit, and this can limit signal-to-noise for faint targets due to the increased CCD readout noise. Each slicer has a fixed format for displaying individual slices on the CCD, and the width of each slice is not seeing dependent, unlike the case of long slit spectra where the width of the spectrum in the spatial direction is influenced by seeing. Thus, for example, in order to slice all 5 slices for image slicer B, one has to add ~ 50 pixels in each row. In comparison, a typical long slit exposure in 1 arcsec seeing spreads over ~5 pixels. For faint targets this can compromise the delivered signal-to-noise of the image slicer observations. Observing with the image slicerThe long slit is tilted at an angle of 7.5 deg to allow viewing of the slit by the acquisition camera. The two plates of the image slicer are tilted by the same amount to permit viewing of the two apertures A and B. In the acquisition image, the observing support assistant should mark the reference apertures A and B, and then acquire. Light in a calibration unit can be used in order to see labels A and B on the slicer, or you can take an exposure to distinguish between the slicer B (which has 5 slices) and slicer A (which has 6 slices). The focus of the spectrograph using the image slicer is similar to that when using the normal long slit, thus it is possible to interchange between the image slicer and the long slit without a need to refocus the spectrograph. During the commissioning nights, there was no need to refocus the slit viewing TV camera used for the acquisition between viewing the image slicer and long slit of ISIS. The telescope focus for the image slicer and the long slit of ISIS is also very similar and the same value can be used for both. Dekker clear position is used for both image slicer and long slit observations. To calibrate properly slicer observations, it is recommended to take internal tungsten lamp flat-fields several times during the night, or at each target position, due to the instrumental flexure. At least once during the night sky a background exposure free of stellar contamination should be taken with the image slicer. It can be used to determine ratio of sky background in each slice versus sky background in the mini-slit region (see next section for more details). Wavelength calibration images should be taken independently for image slicer data, as there is a shift in spectral direction compared to the long slit data. The image slicer is designed to be non-polarising, i.e. <3% according to Tom Gregory in 2010. However, the slicer polarisation has not been measured so far at the telescope. Notes for data reductionTo give an idea about the difference in sky background between each slice and the mini-slit region, we did a comparison for the night of October 14 2013 for the slicer B in the red arm. We subtracted the sky background in each slice and in the mini-slit region, and the final ratios can be seen here. We label as slice 1 the left-most slice in the slicer B as shown on the picture above, and slice 5 the right-most slice. We did not remove cosmic rays and the final ratios have been smoothed over 10 points. | ||||||||||||||||||||||||||||||||||||||||||||
| Top | Back |
|
