Spatial scale on IDS
Spatial profile degradation at the CCD edges
The 235mm camera with the EEV10 CCD provides a spatial scale of 0.40 arcsec/pixel.
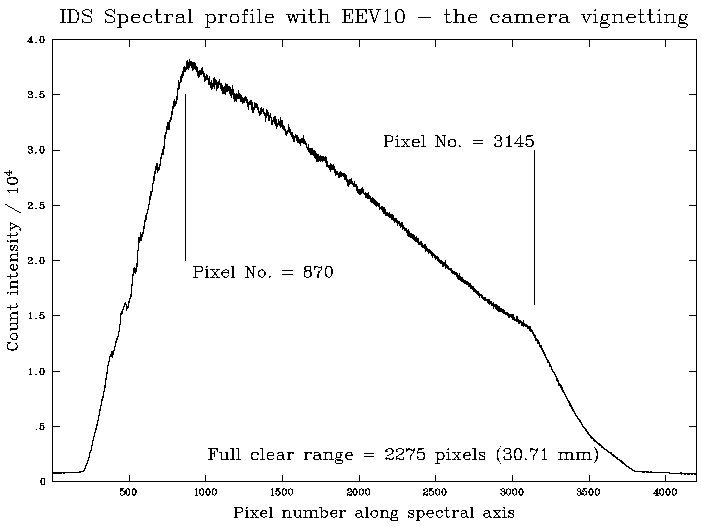
The maximum unvignetted slit-length usable with IDS is 3.3 arcmin, corresponding
to some 500 detector pixels for EEV10.
Note that the spatial profile degrades toward the upper
and bottom parts of the CCD, giving the impression that in these regions
the star image is out-of-focus (most evident in the vignetted regions where
a stellar profiles becomes double-peaked). This is a feature due to the IDS
optics, in particular the CCD corrector lens, that was not designed for large
format detectors like the EEV10 CCD.
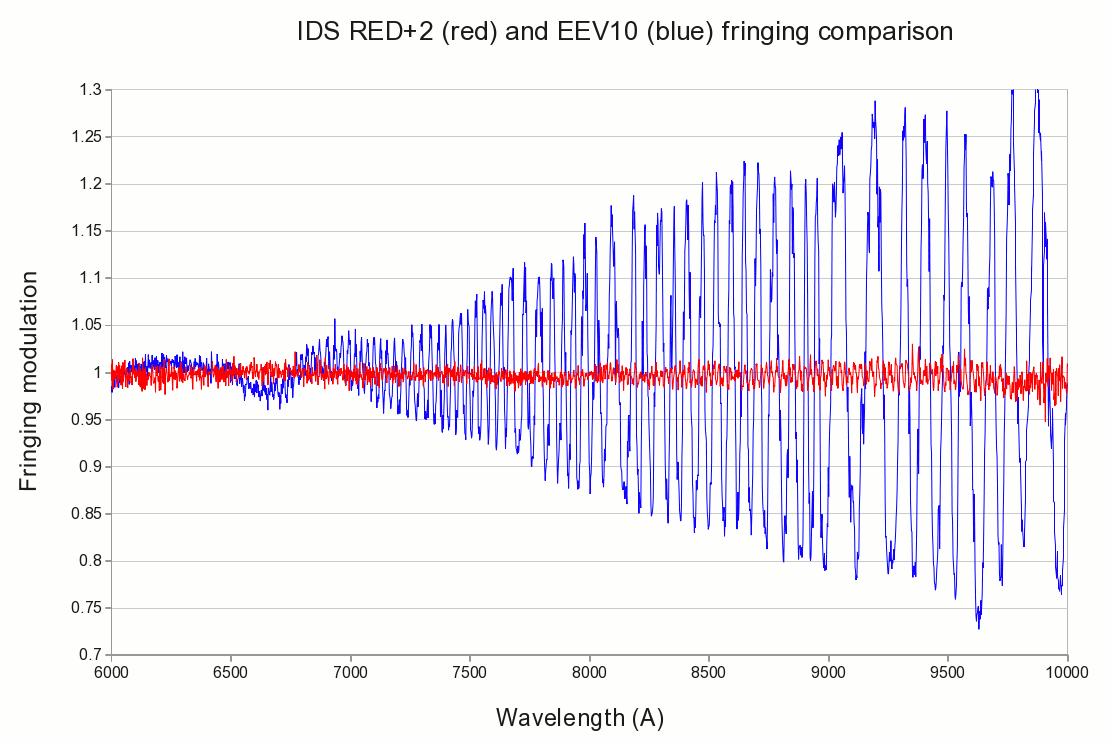
Fringing and Cosmetic defects
The thinned chip severely suffers from fringing in the red part of
the spectrum, which limits its usefulness in this region despite its good
QE up to 8000 Å. Here there is an
illustrative flat field
spectra (See
here the parameters of the detector for more details). The following numbers
serve as a reference guide to the severity of the problem :
Wavelength     Peak-to-Peak Amplitude
6500Å                 5%
7000Å                 15%
7500Å                 30%
8000Å                 50%
8500Å                 60%
9000Å                 60-70%
There are a few cosmetic defects on the surface of the chip, but nothing
particularly severe.
Charge spreading variations
Effects on spectral resolutions
The diffusion of charges between pixels during integrations causes a degradation
of the spatial and spectral resolution. For a long-slit spectrograph like
IDS, with the INT mean seeing around 1".0-1".5, spatial degradation is not
a significant with the pixel size of the EEV10, but should be considered in the spectral direction. For a back illuminated CCD this
charge diffusion (often referred to as the Modulation Transfer Function;
MTF) becomes progressively worse for shorter wavelength incident light. For
example, using a slit-width projecting 2 pixels on the detector results
in a FWHM measured of 2.4 pixels (measured at ~4000 Å) when the spectrograph
is at best focus. Similarly, a slit-width projecting 4 detector pixels
will produce a FWHM of ~4.4 pixels (again at ~4000 Å). This effect becomes
less severe towards redder wavelengths and is negligible at around 6000 Å.
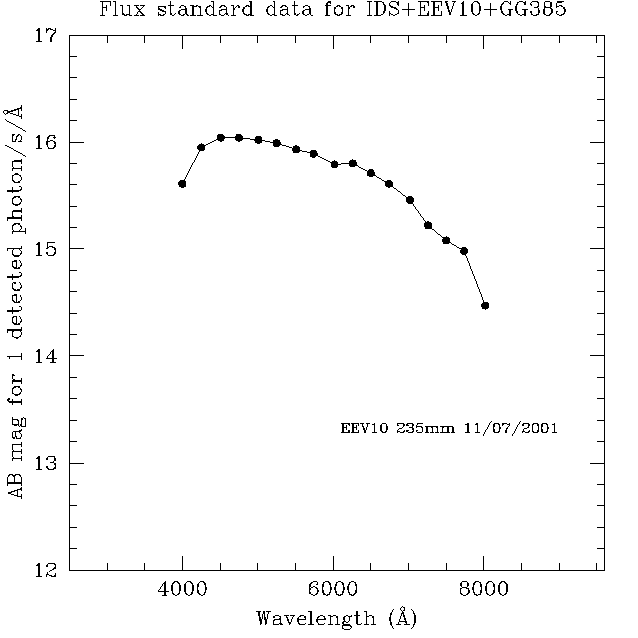
Flux standard data and
empirical throughput


