 | |||
|

| Home > Public Information > ING Newsletter > No. 6, October 2002 > Science |
|
|
INGRID | SCIENCE |
|
|
|
Previous: The COSMOS NIR Survey with INGRID | Up: Table of Contents | Next: The CIRSI-INT IR Survey
|
| |||
|
| Home > Public Information > ING Newsletter > No. 6, October 2002 > Science |
|
|
INGRID | SCIENCE |
|
|
|
Other available formats: PDF
Quasar Redshifts from S-CAM Observations: Direct Colour Determination of ~12 Gyr-Old Photons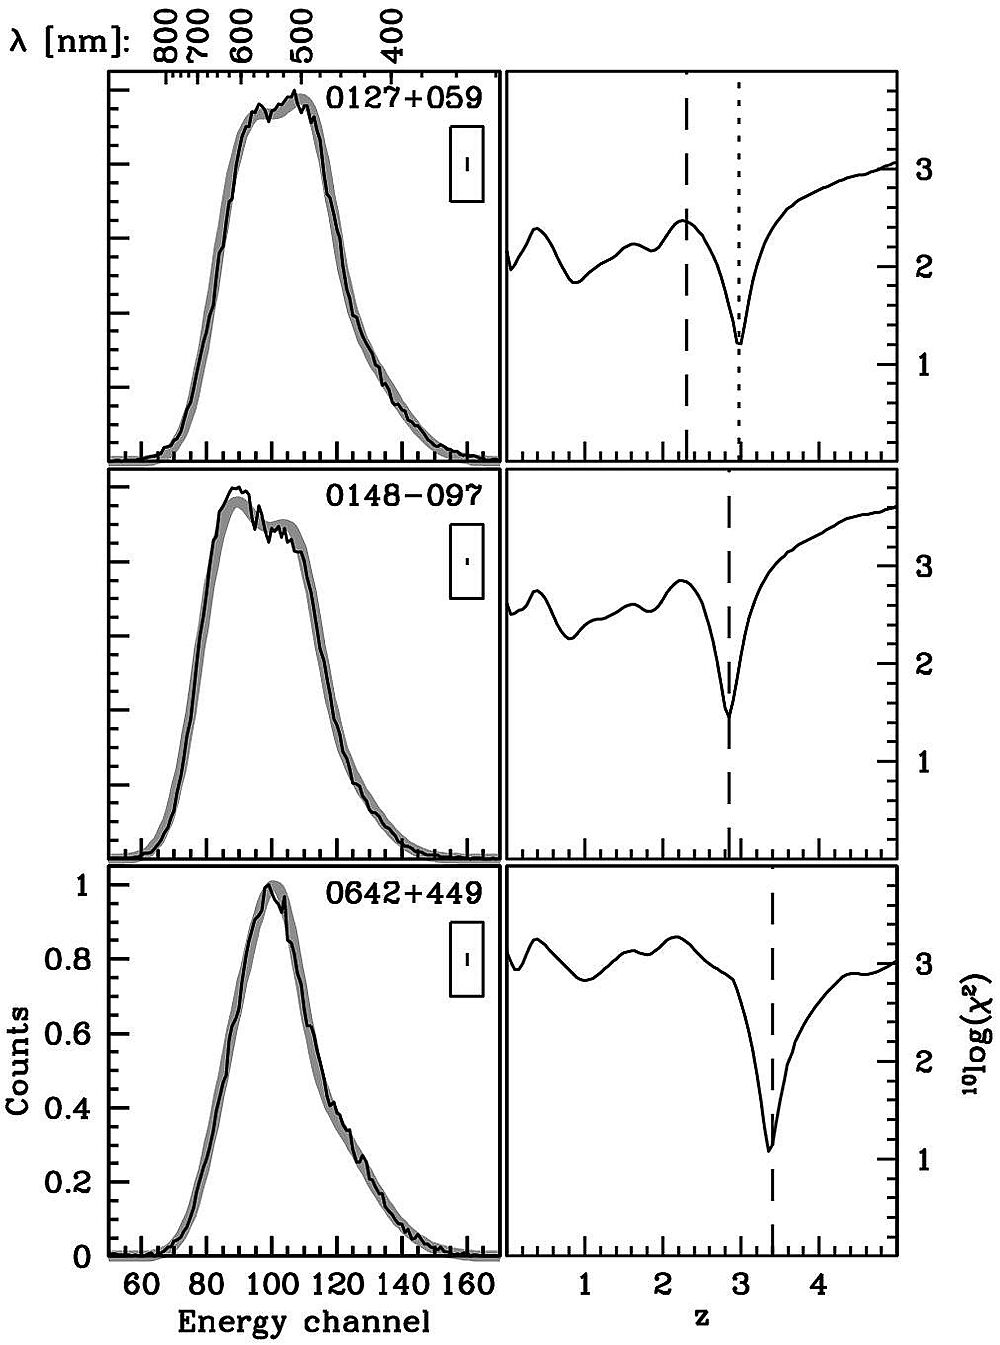
|
| Figure 1. Results for QSO 0127+059, 0148–097,
and 0642+449. Left: observed (black) and modelled (grey) energy channel
distributions (arbitrary units). Our model is based on a single template
HST quasar spectrum. Insets indicate the Poisson noise. Numbers above the
top left panel show the mapping between energy channel and wavelength. Right:
the corresponding dependence of χ2 on z. Vertical dashed lines
indicate the literature redshifts; the dotted line for QSO 0127+059 indicates
z=3.04 (see text). [ JPEG | TIFF ] |
|
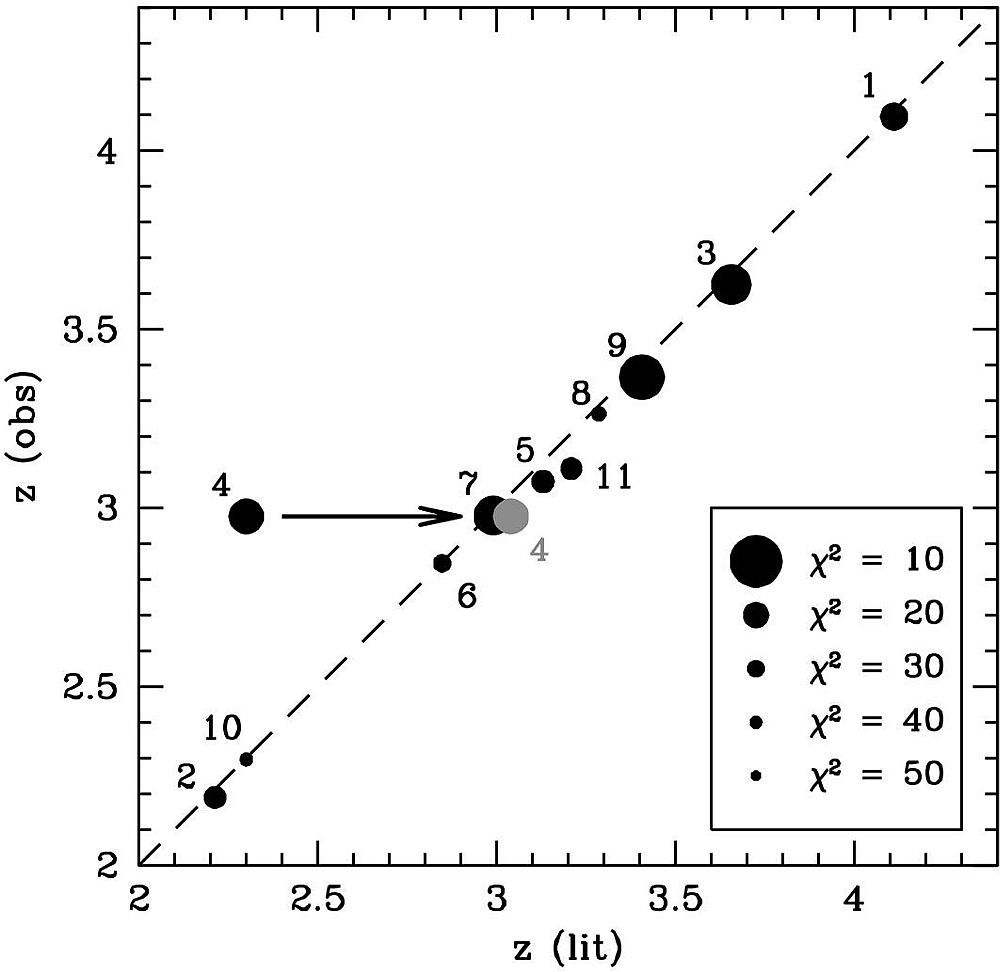
| Figure 2. Observed versus literature redshifts.
Numbers refer to the objects (de
Bruijne et al., 2002). Symbol sizes correspond to χ2; smaller
symbols indicate a poorer fit. QSO 0127+059 has an incorrect literature redshift
of 2.30; follow-up spectroscopy has yielded z=3.04, moving the point to
the position shown in grey. The dashed line shows the 1:1 correlation. [
JPEG | TIFF ] |
|
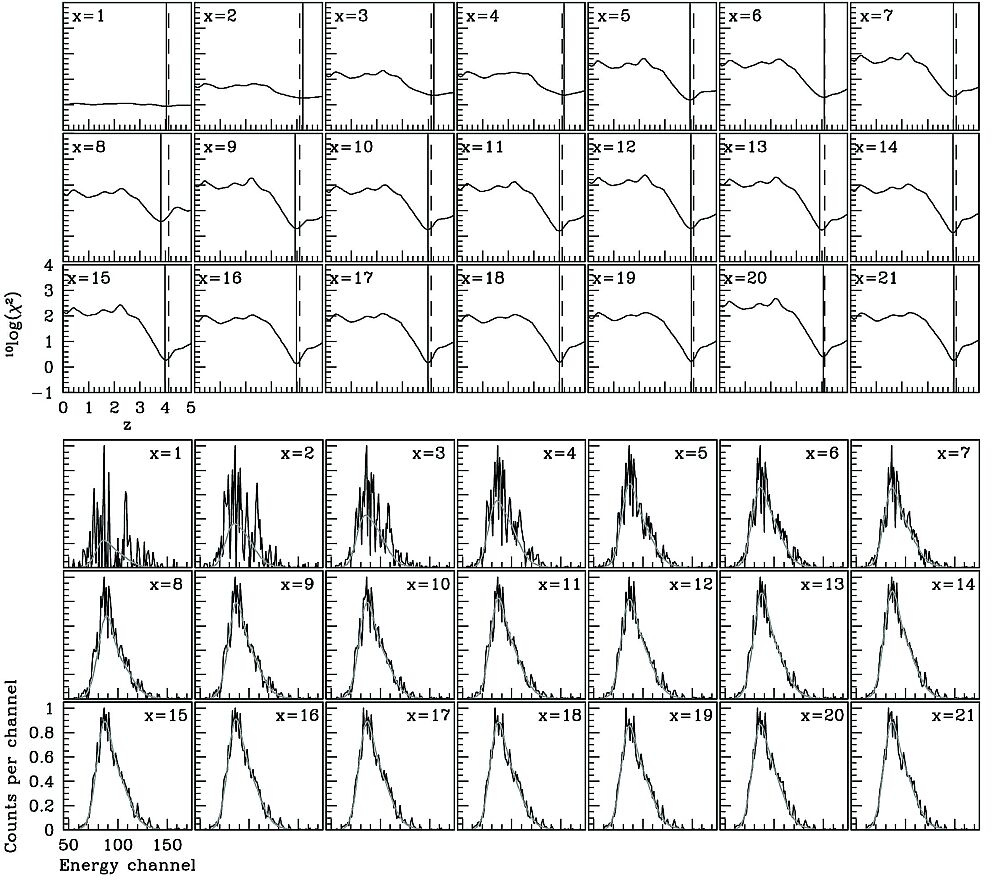
| Figure 3. Top: χ2(z) using the first
x=1,...,21 seconds of data of QSO 0000–263 (z = 4.1). The dashed and solid
lines indicate the literature and best-fit redshifts, respectively. Bottom:
as top panels, but showing the observed QSO spectra (black) and best-fit
models (grey). Panels have differing vertical scales. [ JPEG | TIFF ] |
| Top | Back |
|
