Towards the end
of the last decade, the international astronomical community realised that
exploitation of the new generation of 8–10-m class telescopes would be hampered
unless surveys of the sky with suitable depth were carried out. Spurred by
this realisation, several observatories and research groups planned and established
survey programs. Examples are the NOAO Deep Wide-Field Survey (
http://www.noao.edu/noao/noaodeep/),
the ING Wide Field Imaging Survey (
http://www.ing.iac.es/WFS/),
the DEEP project (
http://deep.ucolick.org/),
the CADIS survey (
http://www.mpia-hd.de/GALAXIES/CADIS/science_index.html)
and many others. Deep surveys aimed at the study of distant galaxies require
NIR imaging in order to cope with the cosmological redshift of the galaxy
spectral energy distributions (SEDs). In 2000 our group started a deep survey
in the Ks-band using INGRID on the WHT and Omega Prime on the CAHA 3.5-m telescope.
Our goal is to cover 0.5 square degrees of high-galactic latitude sky. Our
target depth is Ks=22 in AB magnitudes. Good La Palma seeing and better noise
behaviour allows us to reach this depth in 2 hr exposures with INGRID, the
CAHA/Omega data being about 1 mag. shallower for equal exposure times. On
the other hand, the wider field of Omega allows a faster coverage of sky
area. Our survey, deemed the COSMOS Survey, thus has two depth regimes, K
AB=21
on a wide area and K
AB=22 on the deeper areas mapped with INGRID.
This depth allows us to map luminous blue compact galaxies (LBCGs) with M
B=–21.4
out to z=2.4 (H
0=70) (
Cristóbal
et al., 2000).
Foremost in the science motivation for the COSMOS survey is to produce a
database of distant galaxies for study with EMIR, the NIR multi-object spectrograph
now in construction for the upcoming 10-m GTC on the ORM. EMIR is described
in Balcells (
1998
and
2000).
Up-to-date information on the instrument is posted at
http://www.ucm.es/info/emir/. Operating
at cryogenic temperatures, EMIR will be one of the first spectrographs capable
of performing multi-object spectroscopy in the 2.2-mm K-band. EMIR will allow
us to efficiently obtain rest-frame visible spectra of large samples of galaxies
at redshifts above 2, thus allowing the analysis of all the emission lines
that have traditionally provided us with diagnostics on the excitation, extinction,
star formation rates, metallicities, etc. of nearby galaxies.
Because of the (1+z)
4 cosmological surface brightness dimming,
high-z sources in the COSMOS survey will predominantly be luminous, compact,
i.e. high surface brightness galaxies. Best known among these are star-forming
galaxies for the ease with which they can be identified via U-band dropout
and related techniques (
Steidel
et al., 1996). Such galaxies at z~2 will remain keys to understanding
the rate of cosmic star formation when EMIR comes into operation. Of special
interest is the possible connection of LBGs and other z=3 compact galaxies
(
Lowenthal
et al., 1997) to luminous blue compact galaxies (LBCGs) found at 0.5<z<1
(
Guzmán
et al., 1997). The COSMOS survey should also break ground in cataloguing
galaxies without the strong star formation rates of Lyman-break galaxies.
At 2<z<3, current surveys, selected in the visible, sample the UV continuum
and are biased toward actively star-forming galaxies. COSMOS is mapping rest-frame
R, which is sensitive not only to luminous star-forming galaxies but also
to luminous, massive galaxies harbouring old populations.
For galaxy selection, photometric redshifts and photometric characterisation
of the sources we plan to use complementary data at visible wavelengths, which
we are gathering via our own parallel surveys and via collaborative agreements
with other groups.
Survey fields were selected for their high-galactic latitude, low cirrus
emission, lack of bright stars, and perhaps most importantly for the availability
of complementary data from HST and at other wavelengths. Our fields now include:
the Groth field, including a strip of 28 deep, two-band, HST/WFPC2 pointings
and its flanking fields; the Coppi field, containing a deep exposure with
the Chandra X-ray satellite; one of the SIRTF First-Look Survey fields, and
the Koo-Kron SA68 field. COSMOS will also observe equatorial fields such as
the NOAO Deep Survey 2-hr field, to make use of existing public multi-band
databases, and to allow spectroscopic studies with VLT and Gemini-S in addition
to the GTC.
To date, data was obtained on runs in April 2000, October 2000 and June
2001. Our first run was part of the first science run of INGRID, soon after
the camera commissioning. We are pleased to acknowledge a lack of technical
problems, a smooth camera operation, and the high cosmetic quality of the
images —not to mention the 0.7" FWHM seeing we obtained in the first 2-hr
coadded images. We were then operating with the temporary collimator which
gave reduced throughput, and, in the excellent seeing, gave a slightly non-circular
PSF. These problems disappeared in 2001 using the definitive INGRID collimator.
We were pleased by the ease with which the camera operation could be programmed
using UNIX scripts, allowing us to prepare custom-made dithering patterns
tailored to the geometry of our fields, or to readily program and execute
long linearity calibration exposure sets. We note a single technical
problem, which was eventually clarified with the ING staff: an inaccuracy
(an offset of a fraction of a second) in the exposure times recorded in the
headers during the first months of operation.
Data reduction for the Survey was carried out using IRAF. For sky subtraction,
we found the dimsum task (
Stanford,
Eisenhard & Dickinson, 1998) particularly adequate. Our pipeline,
while not fully automated, allows now for streamlined reduction of long observing
runs, reaching flat-field accuracies of 6×10
–5 (peak-to-peak
in the uniformly exposed areas). Our photometric calibration accuracy, in
good atmospheric conditions, is typically 0.03 mag.
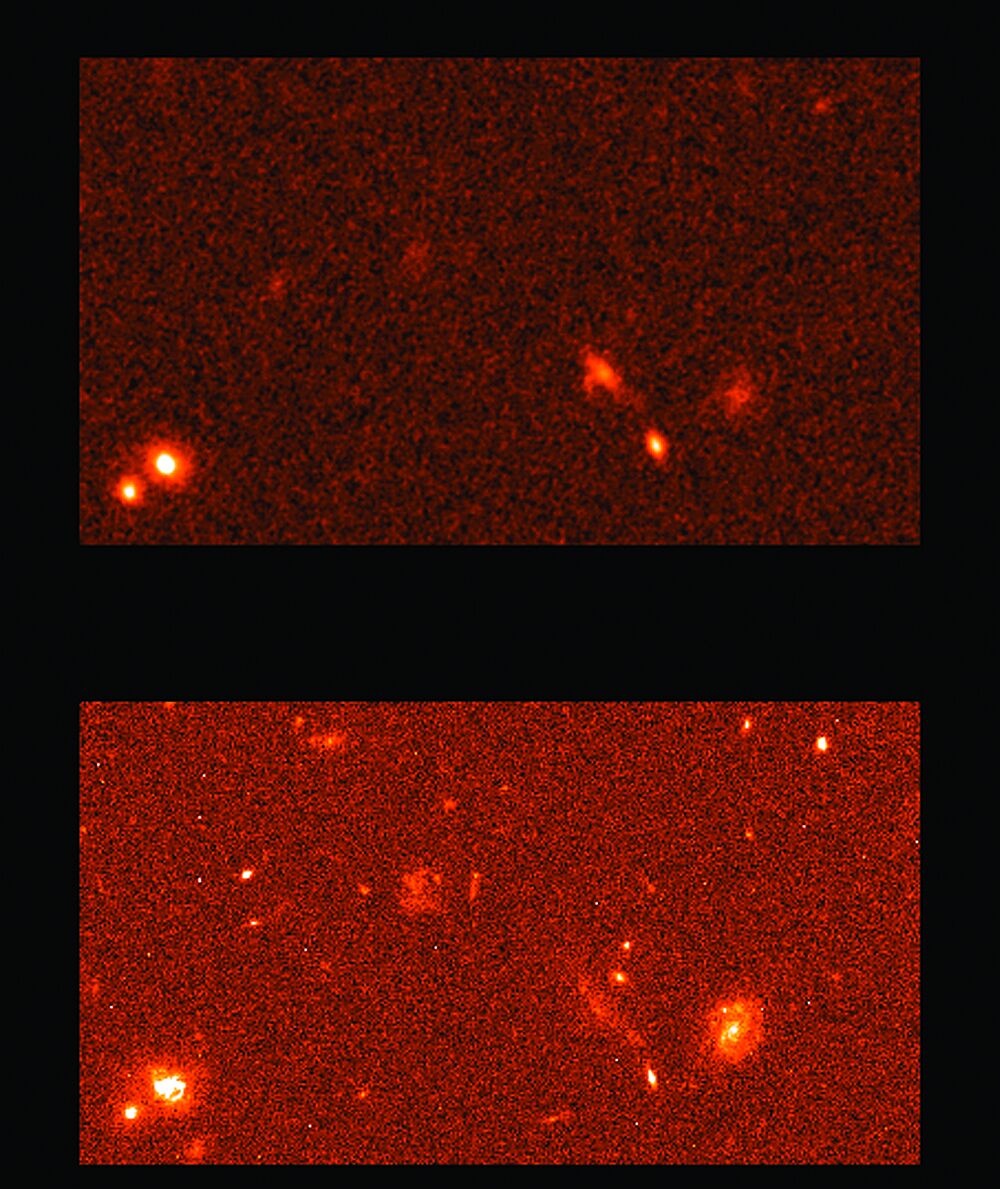
With INGRID, we have mapped the Groth strip, the Coppi field and a fraction
of the SA68 field, for a total of 303 arcmin
2. Figure 1 shows a
sample image from the Groth strip, together with the same field imaged in
F606W with HST. The HST Groth images were obtained from the HST archive. We
have performed source count and photometry using SExtractor (
Bertin
& Arnouts, 1996). Essential for deep galaxy photometry is to obtain
reliable estimates of detection efficiency and spurious fraction (detection
reliability). For the latter, we have developed a test, inspired on that used
by
Bershady
et al. (1998), which we found more robust than tests based on injecting
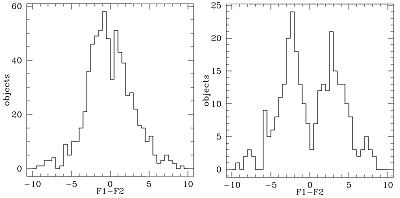
synthetic sources from eg. artdata.mkobject in IRAF. Our test relies on comparing
photometry performed on two disjoint sets of co-added frames, each corresponding
to half the total exposure time. Good detection of a given source in the two
half-time images provides reliability that the source is real. A spurious
source, in contrast, must come from a noise peak and therefore be detected
on one of the two half-time images only. With this assumption, we deem spurious
any detection in which the photometry in any one of the two half-time images
is below a given SN
lim. To determine the value of SNlim that isolates
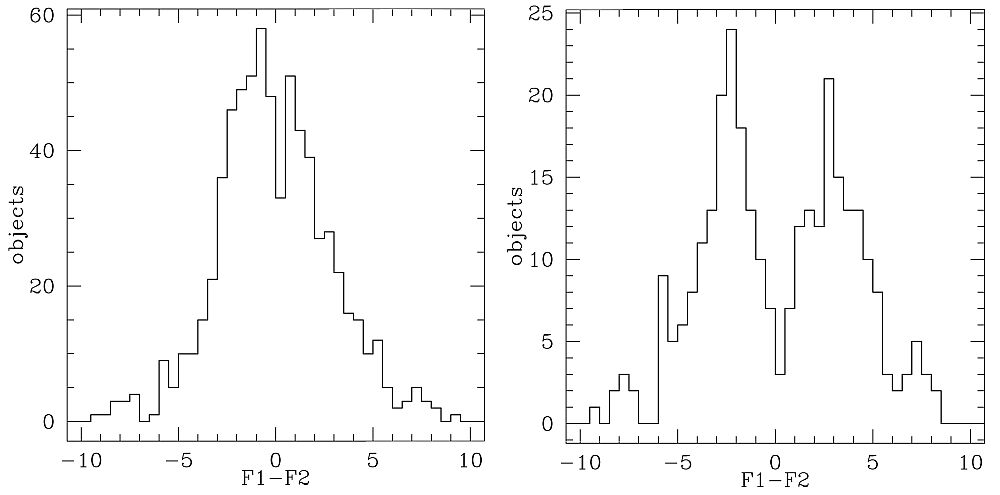
truly spurious sources, we construct the histogram of magnitude differences
between the measurements in the two half images. Values of SN
lim
that isolate spurious sources lead to a double-peaked histogram of magnitude
differences, while values which do not, i.e. which include real sources, yield
a histogram of magnitude differences with a single peak at m
1–m
2=0.
Examples of magnitude difference histograms are shown in Figure 2.
|
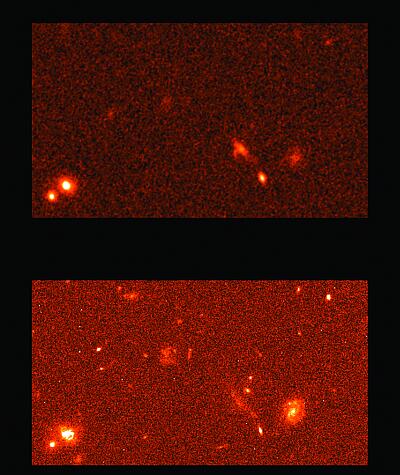
Figure 1. An 11.4"×5" field in the Groth
stirp, imaged in the Ks NIR band by INGRID (top) and in the F606W filter by
HST/WFPC2. The INGRID exposure was 1.5 hr on-target integration. Seeing was
0.65" FWHM in the coadded image (pixel size 0.24 arcsec). On such images,
we reach 50% detection efficiency at K~20.8. The low-inclination spiral in
the lower left is clearly blue, while, next to it, an elongated object, seemingly
another spiral, has pronounced redder colours. [ JPEG
| TIFF ]
|
|
Figure 2. Histograms used in identifying spurious
sources. After SExtractor has produced a source catalogue from the total-exposure
image, we perform photometry at the same source positions on two independent
images, each from a coadd totalling half the total exposure time. We select
sources for which the SN in any one of the two half-time measurements is lower
than a given SNlim, and plot the histogram of magnitude differences
m1 –m2. The first histogram used SNlim=2.8; the single peak indicates
that the SNlim=2.8 cutoff selects many sources for which m1–m2~0,
two independent measurements consistent with each other which indicate that
the sources are real. The second histogram used SNlim=1.6; the
double peak indicates that SNlim=1.6 correctly isolates spurious
sources. [ JPEG | TIFF ]
|
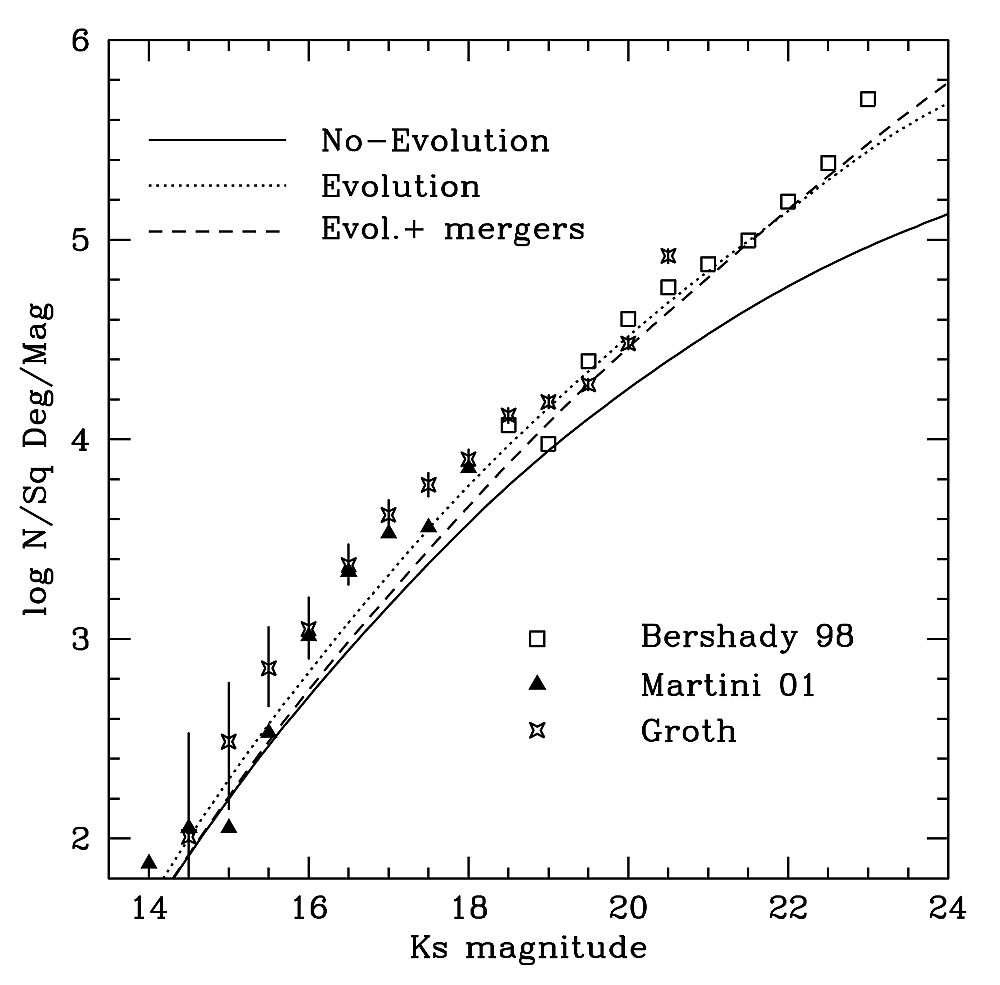
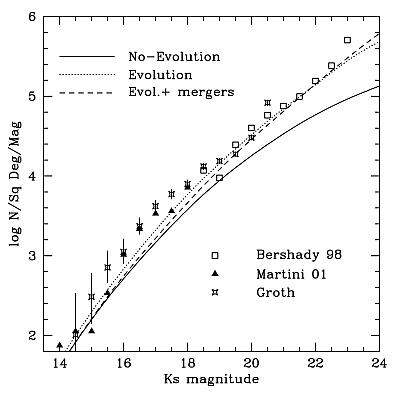
Differential number counts in a 71 arcmin
2 area of Groth are
shown in Figure 3. The area comes from six INGRID pointings, from which the
edge areas with lower exposure time have been excluded. Similar counts were
obtained for the 47 arcmin
2 mapped in the Coppi field. Our Groth
counts bridge over the magnitude range between shallow, wide- area surveys,
eg.
Martini
(2001) and deeper, pencil-beam surveys such as the one by
Bershady,
Lowenthal & Koo (1998). There is good continuity between the three
sets of counts. Our counts in Coppi and Groth are quite close to each other.
The counts stress earlier results that no-evolution models are inconsistent
with the counts. At these depths, and for this cosmology, pure luminosity
evolution (PLE) models provide a good fit to the counts. We reproduce a moderate
excess at intermediate magnitudes over the PLE models, as found by
Martini
(2001).
|
Figure 3. Number counts obtained on the Groth
strip. The figure gives number of galaxies per square degree per magnitude
interval. Counts are corrected for efficiency and for spurious sources. Efficiency
correction is performed only for magnitude bins with a detection efficiency
above 50%. Error bars are 1-σ upper- and lower-confidence intervals (84.13%
confidence level). Superimposed on the counts are three reference number count
predictions, which we derive using ncmod (Gardner,
1998). [ JPEG | TIFF
]
|
Subsequent work on the COSMOS Survey includes covering a wider area until
the target 0.5 degree
2 is reached. Progress on COSMOS may be followed
at the EMIR web site,
http://www.ucm.es/info/emir/.
References:
- Balcells, M., 1998, Ap. Sp. Sc., 263, 361. [ Citation in text | ADS
]
- Balcells, M. et al., 2000, SPIE Proc., 4008, 797. [
Citation in text | ADS
]
- Bershady, M. A., Lowenthal, J. D., Koo, D. 1998, ApJ, 505,
50. [ First citation in text | ADS
]
- Bertin, E., Arnouts, S., 1996, A&A, 117, 393. [
Citation in text | ADS
]
- Cristóbal-Hornillos, D. , Balcells, M., Prieto, M., Guzmán,
R., 2001, Ap. Sp. Sc. Suppl., 277, 577. [ Citation in text | ADS
]
- Guzmán, R., Gallego, J., Koo, D. C., Phillips, A. C., Lowenthal,
J. D., Faber, S. M., Illingworth, G. D., & Vogt, N. P., 1997, ApJ,
489, 559. [ Citation in text | ADS
]
- Gardner, J. P., 1998, PASP, 110, 291. [ Citation in text | ADS
]
- Lowenthal, J. D., ApJ, 481, 673. [ Citation in text | ADS
]
- Martini, P., 2001, AJ, 121, 598. [ First citation in text | ADS
]
- Stanford, S. A., Eisenhardt, P. R. M., Dickinson, M. E., 1998, ApJ,
492, 461. [ Citation in text | ADS
]
- Steidel, C. C., et al., 1996, ApJ, 462, L17. [ Citation in text | ADS
]
Email contact: Marc
Balcells (
balcells@ll.iac.es)