| |||
|
Home > Public Information > ING Newsletter > No. 6, October 2002 > Science |
|
INGRID | SCIENCE |
|
|
|
Other available formats: PDF
The CIRSI-INT IR Survey
|
|
Figure 1. CIRSI at the prime focus of the 2.5m
INT. [ JPEG | TIFF ] |
Figure 2. The image to the left is a 29.6'×29.6'
mosaic of four pointings of the CIRSI camera. To the right the weight map
associated with the mosaic is shown. [ JPEG | TIFF ] |
Field |
RA Dec (J2000) |
Depth |
Extent |
---|---|---|---|
|
|||
INT WAS ISO ELAIS N1 |
16:10 +54:30 |
J<20.0, H<19.0 |
7deg2 |
INT WAS ISO ELAIS N2 |
16:37 +41:16 |
J<20.0, H<19.0
|
7deg2 |
INT WAS NGC |
14:52–14:58 +00:00 |
J<20.0 |
3deg2 |
INT WAS SGC |
22:00–22:16 +00:00 |
J<20.0 |
2deg2 |
Table 1. Survey regions and observational data available. The North and South Galactic Cap regions (NGC/SGC) are coincident with the recently released SDSS zero declination strip observations. |
Pixel scale (arcsec/pixel) | 0.46 |
FOV per chip | 7.8' × 7.8' |
FOV for 2×2 mosaic | 29.6' × 29.6' |
Frames/deg2 | 16 |
J, 5min 5σ in 1.2'' seeing | 20.0 |
H, 5min 5σ in 1.2'' seeing | 19.0 |
Table 2. CIRSI Characteristics
on 2.5-m Isaac Newton Telescope. |
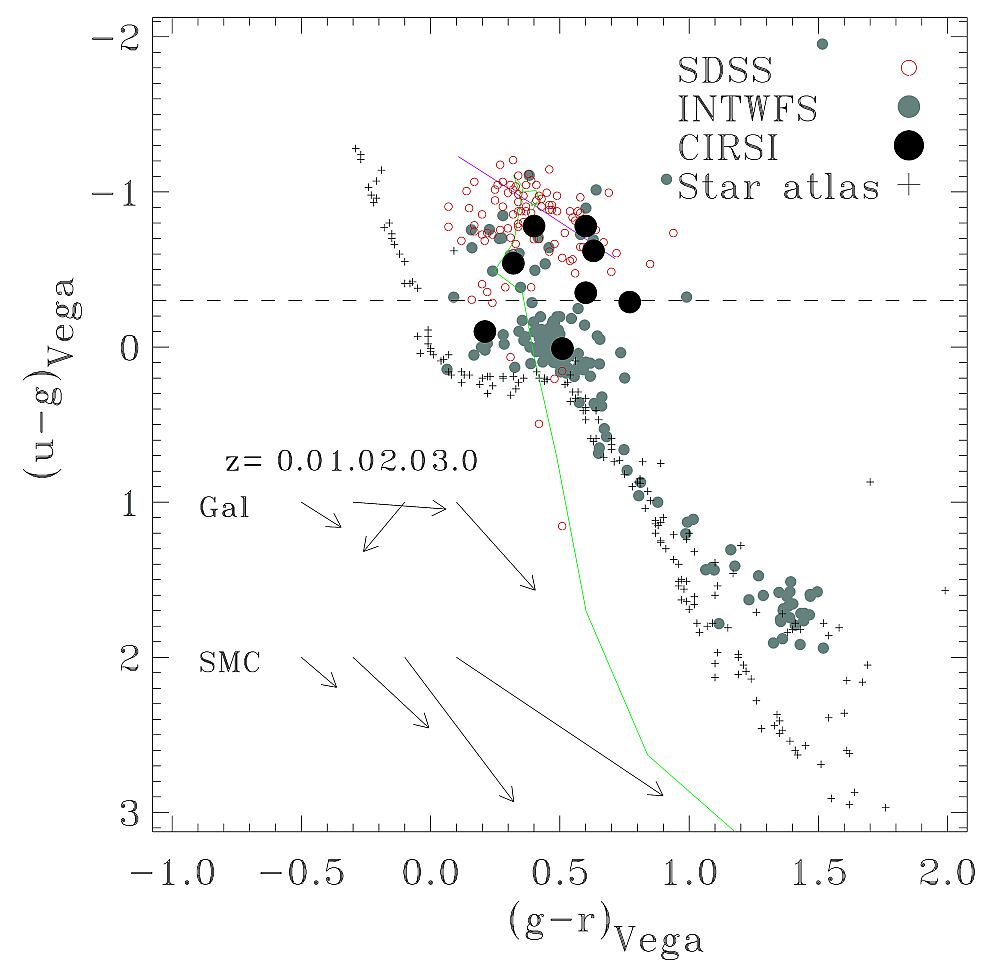
Figure 3. A comparison is shown of a sample of
previously known quasars identified in the SDSS. The new quasars identified
by gzH selection for which ugr data is available from the INT WAS are marked
with filled circles. The horizontal line at u–g= –0.3 represents a UVX selection
boundary analogous to that used in the 2dF quasar survey (2QZ Boyle
et al., 2000). The stellar locus, computed from a spectral atlas, is
shown along with stellar objects from a field of the INT WAS. The locus of
quasar colour as a function of redshift is indicated by the solid line. The
onset of absorption in the g band, due to the Lyman-a forest, is evident
for quasars with z>3. Reddening vectors for dust models based on the Galaxy
and the Small Magellanic Cloud are shown over a range of redshifts. The 2175Å
feature in the galactic law passes through the g band over the range 1<z<2.
[ JPEG | TIFF ] |
Figure 4. The candidate selection diagram for a
0.17deg2 region of the survey is shown with the full quasar sample
overlaid. The selection boundary, chosen based on model quasar colours, is
indicated by the broken line offset from the linear fit to the stellar locus.
[ JPEG | TIFF ] |
Top | Back |
|