 | |||
|

| Home > Public Information > ING Newsletter > No. 10, December 2005 > CIRPASS on the William Herschel Telescope: Measuring the Global Star Formation Rate Over Most of History |
|
|
SCIENCE |
|
|
|
Previous: Progress on the GLAS Rayleigh Laser Beacon System for the William Herschel Telescope | Up: Table of Contents | Next: Pyramid Wavefront Sensor at the William Herschel Telescope: Towards Extremely Large Telescopes
Article mirrored at: La Palma server | Cambridge server
Other available formats: PDF
CIRPASS on the William Herschel Telescope: Measuring the Global Star Formation Rate Over Most of History
Andrew Bunker1,2, *, Rob Sharp1,3, Michelle Doherty1 and Ian Parry1
1: Institute of Astronomy, Cambridge; 2: School of Physics, University of
Exeter; 3: Anglo-Australian Observatory, Australia.
An issue which has tantalised high-redshift observers for the past decade is the star formation history of the Universe. Essentially, we want to determine the epoch when majority of stars formed. Since the legendary (perhaps notorious) “Madau-Lilly” diagram first appeared in the mid-1990s (Madau et al., 1996, Lilly et al., 1996; Pei & Fall, 1995) astronomers have puzzled over measuring the total star formation rate density over the history of the Universe. It has long been established that at modest redshifts (z≈0.5–1) the Universe was forming stars much more rapidly than today, perhaps even ten times as fast. However, the behaviour at redshifts beyond one has caused much consternation in the community, with various groups claiming declining/constant/rising star formation density. Even at redshifts 1–2 (our own backyard by current standards when we are routinely discovering galaxies at redshift 6) there is still an order of magnitude uncertainty in the global star formation rate (see Hopkins et al., 2001, 2004 for a recent compilation of measurements). The probable reasons for this embarrassingly large scatter in measurements are a combination of different diagnostics of star formation rate (with uncertain relative calibration) and the insidious effect of dust obscuration, which tends to hit the rest-frame UV particularly hard —a measure used at higher redshifts, where it is measured from optical photometry.
Clearly, the star formation history determinations so far have been a bit of a mess. To make a fair comparison, we need to use the same reliable instantaneous tracer of star formation at high redshift as locally. The Hα emission line, used in surveys of star formation at low redshift, is eminently suitable as it is relatively immune to metallicity effects and is much less susceptible to extinction by dust than the rest-UV continuum and Lyman α (which is a particularly bad indicator as it is resonantly absorbed). However, tracing Hα to early epochs forces a move to the near-IR at z>1. Building statistically significant Hα samples at these redshifts has been impossible until now because of the inefficiency of single-object long-slit spectroscopy.
Multi-object spectroscopy (MOS) has long been established in the optical, but is still in its infancy at infrared wavelengths. We are still a generation away from IR-MOS instruments on the 8-m class telescopes, but this technology has already been successfully demonstrated on the WHT with the visiting instrument, CIRPASS. This is the “Cambridge Infra-Red Panoramic Survey Spectrograph” (Parry et al., 2004), built by the Institute of Astronomy, Cambridge with the support of PPARC and the Sackler Foundation. CIRPASS works in the J- and H-bands, at wavelengths 1–1.8mm.
CIRPASS is a fibre-fed spectrograph with a Hawaii 2k Rockwell array. The whole instrument sits in a refrigerated cold room at –42ºC (a commercial cold meat locker, which greatly reduced costs) which is free-standing on the dome floor (Fig. 1). This makes the spectrograph inherently stable. The flexibility of such a fibre fed instrument has allowed CIRPASS to be used with telescope as diverse as an 8-inch reflector in the grounds of the IoA in Cambridge, and the 8-m Gemini South telescope in Chile where we pioneered integral field “3D” spectroscopy in the infrared (Metcalf et al., 2004; Smith et al., 2004; de Grijs et al., 2004).

The WHT has an unvignetted field of 15 arcminutes at the Cassegrain focus, and we used CIRPASS with 150 fibres which could be deployed over that field on individual galaxies. In fact, we allocated half the fibres to sky to improve background subtraction. Our science goal was to measure the Hα emission from galaxies at z=0.7–1.0, redshifted to the J-band at ≈1.2mm.
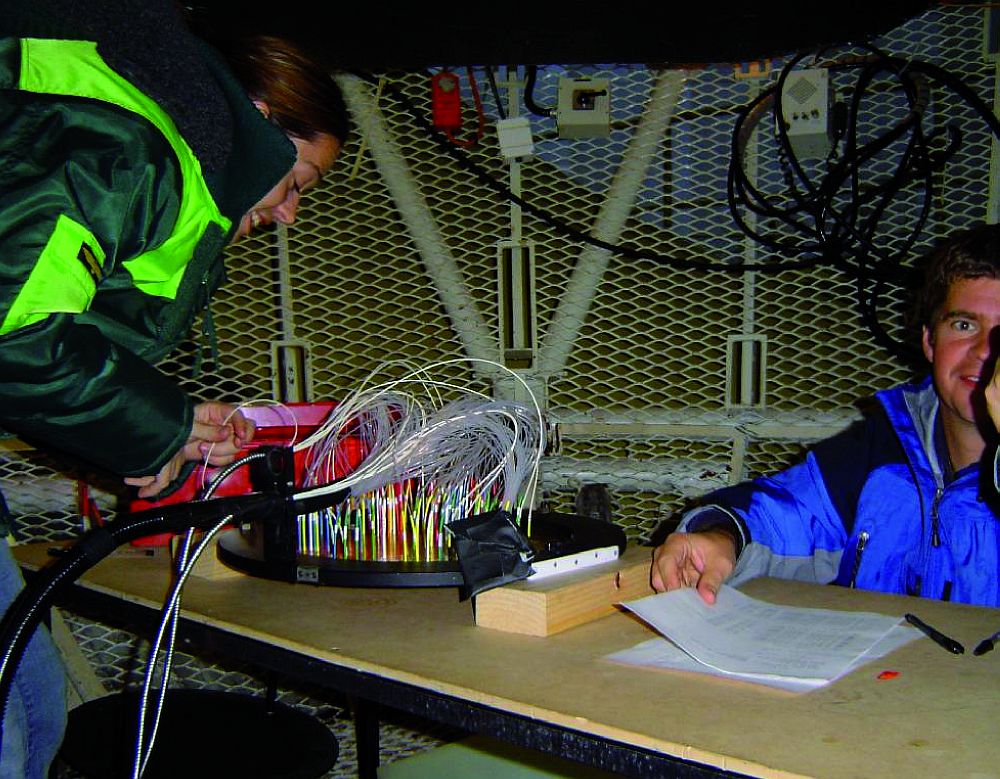
We used a plug plate system (the old AAT FOCAP); while outdated by the standards of modern robot fibering systems such as the WHT’s own Auto-Fib, 2dF at the AAT or the Echidna system soon to be deployed with FMOS at Subaru, our army of graduate student and postdoc “plate pluggers” (Fig. 2) had lower running costs (and marginally better break-down rates) than most robots. In practice, we only attempted two fields per night, so the 45min refibering represented a <10% overhead.
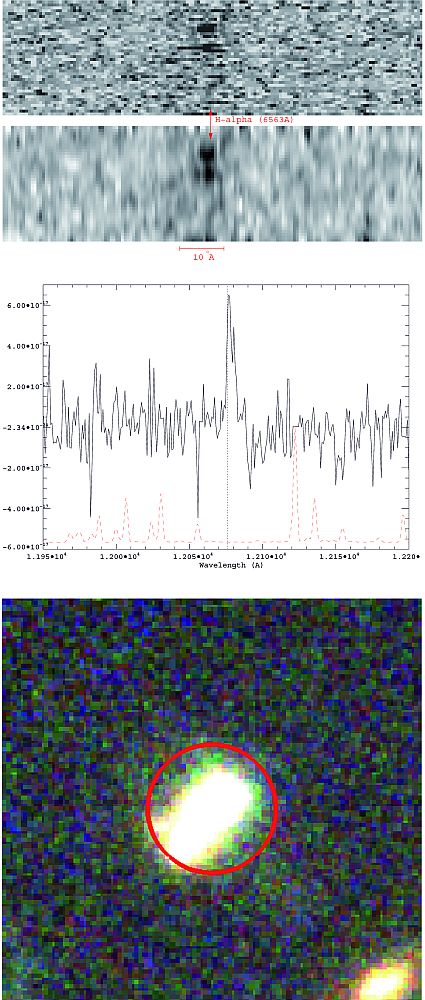
We spent Christmas 2003 on La Palma. Our Christmas list included a sample of galaxies from the Hubble Deep Field North redshift survey of Cohen et al. (2000). We successfully detected Hα in several of these (Doherty et al., 2004, Fig. 3). We believe this to be the first published demonstration of IR MOS on high redshift galaxies.
| Figure 3. 2D spectrum for the full HDF sample of 62 objects, each shifted back to the rest-frame. Rows containing spectra of objects with zHα<0.768 have been masked out. Hα is clearly visible as a line in the 2D frame (top). The bottom frame has been gaussian smoothed by σ=2 fibres (in y) and 0.1Å (in x) to bring out this feature. An example spectrum and the three colour (BRI) HST composite is shown overlayed with the CIRPASS fibre. [ JPEG | TIFF ] |
With CIRPASS, we were able to detect Hα to 10–16ergs
cm–2 s–1 at 5σ in three hours, corresponding
to a star formation rate (SFR) of 5M yr–1
at z~1, comparable to that of the Milky Way today. Over the 2003 run,
and another run in October 2004, we have targeted ~200 galaxies in three field
—an order of magnitude more than previously attempted with IR spectroscopy
(Glazebrook
et al., 1999; Tresse
et al., 2002). We have been able to determine the total star formation rate
density at z~1 (Michelle Doherty’s PhD at the IoA, Fig.
4). We find that rest-UV studies underestimate this by about a factor of
3 (Doherty et al., in preparation).
yr–1
at z~1, comparable to that of the Milky Way today. Over the 2003 run,
and another run in October 2004, we have targeted ~200 galaxies in three field
—an order of magnitude more than previously attempted with IR spectroscopy
(Glazebrook
et al., 1999; Tresse
et al., 2002). We have been able to determine the total star formation rate
density at z~1 (Michelle Doherty’s PhD at the IoA, Fig.
4). We find that rest-UV studies underestimate this by about a factor of
3 (Doherty et al., in preparation).
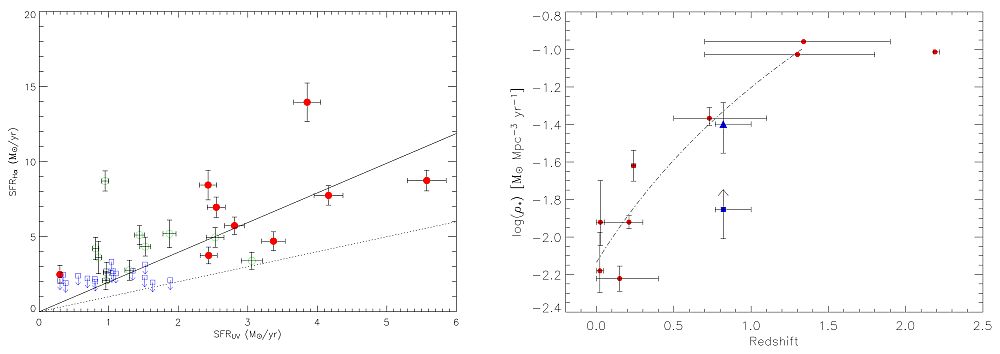
| Figure 4. Left: Comparison of SFRs obtained from UV continuum flux at 2400Å versus Hα flux for the individual galaxies. The SFRs derived from UV luminosity are consistently underestimated. The filled circles are the robust detections, the open circles are greater than 3σ and the squares are 3σ upper limits. The solid line has a gradient of 1.98 and represents the line of best fit to the data (using a least squares fit, through zero). The dotted line is the line of zero extinction i.e. where SFR(Hα)= SFR(UV). Right: Evolution of the star formation rate density using SFRDs determined from Hα measurements only, with no reddening corrections. Red circles are points taken from the literature, converted to a L-CDM cosmology. Overlaid is our lower limit (blue square) to the SFRD, and our estimate including luminosity bias and aperture corrections (blue triangle). [ JPEG | TIFF ] |
What is the future for such work? We have set the scene for the FMOS instrument on Subaru (Lewis et al., 2003), which is partly based on the CIRPASS design and will explore large samples of star-forming galaxies at these redshifts down to faint luminosities. Both FMOS and CIRPASS are limited to wavelengths shorter than 1.8mm, but new instruments such as LIRIS on WHT (Manchado et al., 1998) have a multi-object capability in the K-band. This will enable us to chase Hα out to z=2.5. Monitoring other emission lines such as Hβ, [OIII] and [OII] also give us a handle on the dust extinction and metallicity in distant galaxies.
We have taken the first few steps towards a coherent, self-consistent picture of the evolution of the star formation rate density, measuring Hα from galaxies that existed when the Universe was half its current age. New instrumentation offers the exciting prospect of mapping similar galaxies even further back in time, and lifting the veil on obscured star formation in the early Universe. ¤
References:
Cohen, J. G., et al., 2000, ApJ, 538, 29. [ ADS | First citation in text ]Doherty, M., Bunker, A., Sharp, R., Dalton, G., Parry, I., Lewis, I., MacDonald, E., Wolf, C., Hippelein, H., 2004, MNRAS, 354, L7. [ ADS | First citation in text ]
Glazebrook, K., Blake, C., Economou, F., Lilly, S., Colless, M., 1999, MNRAS, 306, 843. [ ADS | First citation in text ]
de Grijs, R., Smith, L. J., Bunker, A., Sharp, R. G., Gallagher, J. S., Anders, P., Lancon, A., O’Connell, R. W., Parry, I. R., 2004, MNRAS, 352, 263. [ ADS | First citation in text ]
Hopkins, A. M., 2004, ApJ, 615, 209. [ ADS | First citation in text ]
Hopkins, A. M., Connolly, A. J., Haarsma, D. B. & Cram, L. E., et al., 2001, AJ, 122, 288. [ ADS | First citation in text ]
Lewis, I. J., et al., 2003, SPIE Proc, 4841, 1108. [ ADS | First citation in text ]
Lilly, S. J, Le Fevre, O., Hammer, F., Crampton, D., 1996, ApJ, 460, L1. [ ADS | First citation in text ]
Madau, P., Ferguson, H. C., Dickinson, M. E., Giavalisco, M., Steidel, C. C., Fruchter, A., 1996, MNRAS, 283, 1388. [ ADS | First citation in text ]
Manchado, A., Fuentes, F. J., Prada, F., et al., 1998, SPIE Proc, 3354, 448. [ ADS | First citation in text ]
Metcalf, R. B., Moustakas, L. A., Bunker, A. J., Parry, I. R., 2004, ApJ, 607, 43. [ ADS | First citation in text ]
Parry, I., et al, 2004, SPIE Proc, 5492, 1135. [ ADS | First citation in text ]
Pei, Y. C. & Fall, S. M., 1995, ApJ, 454, 69. [ ADS | First citation in text ]
Smith, J. K., Bunker, A. J., Vogt, N. P., Abraham, R. G., Aragón-Salamanca, A., Bower, R. G., Parry, I. R., Sharp, R. G., Swinbank, A. M., 2004, MNRAS, 354, L19. [ ADS | First citation in text ]
Tresse, L., Maddox, S. J., Le Févre, O., Cuby, J.-G., 2002, MNRAS, 337, 369. [ ADS | First citation in text ]
*: Email contact: Andy Bunker (
 )
)
| Top | Back |
|
