Shack-Hartmann recipe - old data-analysis details
This page lists the data-analysis steps required prior to March 2018,
when Javier wrapped up the messy details into 3 easy-to-run scripts
SH_findspots, SH_redhart and SH_newhart.
The curent Shack-Hartmann observation/analysis recipe is on
this page.
The new Section 5 of that page replaces the details below.
Work in /data/qc/shack (or elsewhere, copying relevant files
from this directory).
-
If any of the following files are
not present, copy them across:
- defaults.dat
-
wht/whtab_parms.dat
-
wht/whtc_parms.dat
(there are 2 versions, one for Cass, one for prime focus
- copy across either whtc_parms.dat_cass or whtc_parms.dat_pf
and rename as whtc_parms.dat)
- The executables
bin/redhart2
and bin/newhart
(chmod 755 redhart, chmod 755 newhart may be needed).
The data files are a copy of those that were stored in
~optics/oldsunos/hartmann (copied to /scr/fs1a/crb/optics by Don,
2/07).
Example raw star and lamp frames are in /data/qc/shack/test/teststar.fit,
testlamp.fit.
-
Check that the pixel size (next to last datum in whtc_parms.dat)
is correct. If not, edit it.
- Copy across the data files rnnnnnn.fit, then within iraf convert them to
2-D files, to allow FIGARO to read them:
imcopy r******[1] r***
- Type figaro, then pisa (use fighelp and
pisahelp for help).
- Convert the data to .sdf format with:
rdfits r***.fits r***
where the second r*** is the root of the
required output filename (r***.sdf),
and accept defaults for the other parameters.
NB the FIGARO filename should not begin with a digit.
- On each frame, check the maximum counts with:
istat rnnn
If > 32767 (pisa cannot handle this) then:
icdiv rnnn 2 rnnn
If the maximum was 65535, it's necessary to subtract 1 as well:
icsub rnnn 1 rnnn
(pisa can't handle 32767.5)
- On each frame, find the coordinates of the spots with pisafind.
-
Display the frame (recommended but not essential):
pisagrey device=xwindows
Try device=x2windows if this fails
Respond to the prompts for filename (don't give this on the
command line), size (e.g. 1,1124) and min, max (e.g. 0,3000).
- Find the spots:
pisafind results=rnnn.dat
Use minpix typically 4 - 10 (usually 10),
method 0, background default, threshold
probably about 2000.
It should find ~ 410 spots on the star image, ~ 540 on the lamp
image.
-
If pisafind fails with 'Internal storage space exhausted',
it's probably finding too many objects, e.g. when the seeing is bad.
Try raising the threshold (e.g. doubling it).
-
Plot the positions on the image:
pisaplot overlay annota=f results=rnnn.dat
This shows whether the selection criteria for pisafind need changing.
On some computers (e.g. whtdrpc1) pisaplot works OK. On some,
it plots double size, so the overlay marks don't match up
with the light spots. Anyway, this step isn't critical
- it's just a sanity check.
Sometimes pisafind crashes after a long pause, with a bus error, try
raising the
threshold.
- For each set of lamp + star frames
rnnn.dat and rlll.dat, where nnn and lll are 3-digit numbers,
obtain the relative shifts of the Hartmann spots:
- Run (on unix):
redhart2
which compares the x,y positions recorded in the two .dat files
(redhart2 is a unix version, 2014, of the original redhart, which runs
only under sunos)
- Specify the output files as rednnn and hartnnn.
- Usually, redhart2 matches every star spot to a lamp spot (i.e.
generates >~ 400 matches), If there are many missing, this could be
a sign of strong aberrations e.g. coma.
- Say 'yes' to the plot option, otherwise it will not generate the
text file of vectors either.
- Use SCALE=1.
- Give /vps as plot device. Select vector plot.
- There is an option to
mask out spots whose centroids are affected by vignetting
near the inner or outer edge of the pupil (best to mask these)
or within four user-defined rectangles affected by the M2
support vanes (usually it's not necessary to mask these).
If you make a mistake during masking, there's an option at the end
to re-do them.
- The output files are rednnn, hartnnn and pgplot.ps.
Rename pgplot.ps as rednnn.ps.
Print rednnn and rednnn.ps.
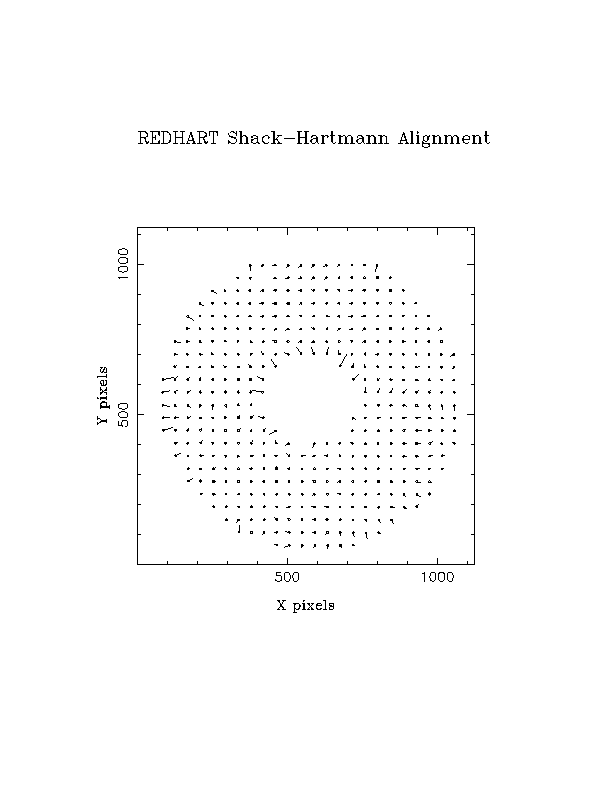
Example vector plot, illustrating the need to mask out vectors near
inner or outer circumference of the pupil:

- Program newhart derives the aberrations from the measured
shifts in file hartnnn. Before June 2016, it was necessary to run
this on a sunos computer, but Javier Mendez has updated the code
to run under linux:
- Change to working directory /data/qc/shack.
- code_linux/newhart
- Specify input filename as hartnnn, and output filename as newnnn.
- Give /vps as plot device.
- NB newhart falls over if two successive reductions are done by
redhart, because
it puts in two sets of title lines, you need to edit out
one of them.
- Rename pgplot.ps as newnnn.ps, print newnnn.ps and newnnn.
- In 2014, successive runs of newhart (not the first run)
on oldtaurus gave a problem 'not finding grfont', which seemed to be
fixed by first running redhart.
-
If for some reason, it's necessary to run the old sunos version, do so
via ssh to ra1.ing.iac.es (ING's last remaining sunos computer).
NB files can't be sent to printers from this computer.
Chris Benn
16 May 2020
|

