We are currently carrying
out a Ks band survey for core-collapse supernovae (CCSNe) in the nuclear
(central kpc) regions of nearby starburst galaxies with the INGRID near-IR
camera at the WHT. In this article we concentrate on describing mainly the
observations and the real time processing of the SN search data, which makes
use of the ING’s integrated data flow system.
Very little is currently known about the behaviour of SNe in a starburst
environment. The enhanced metallicity in starburst regions is expected to
result in large mass-loss rates (
Vink
et al., 2001) for the SN progenitor stars. In addition, many of these
events are expected to occur within molecular clouds (
Chevalier
& Fransson, 2001), adding further to the density of material surrounding
the SN. Therefore, nuclear SNe can be expected to explode within a dense
circumstellar medium. In general, a dense (but non-nuclear) circumstellar
environment has been observed to produce bright CCSNe with slow near-IR light
decline rates (e.g. SN 1998S,
Fassia
et al., 2000). However, the behaviour of SNe in nuclear starburst regions
may be much more extreme (
Terlevich
et al., 1992). The high-z CCSN surveys with the VLT, HST and NGST (e.g.,
Dahlen
& Fransson, 1999;
Sullivan
et al., 2000) will use SNe to probe the cosmic star formation rate.
For this, it is important to determine (i) a better estimate of the complete
local CCSN rate (cf.
Sullivan
et al., 2000), (ii) a proper understanding of the behaviour of SNe within
the dusty, high-density starburst environment and (iii) the extinction towards
these events.
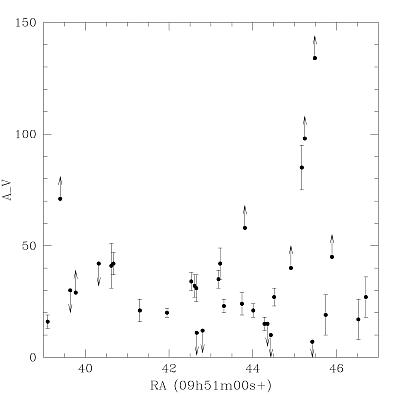
Most of the CCSNe in young starbursts like M 82 (Figure 1;
Mattila & Meikle,
2001,
2002)
are expected to be heavily obscured by dust, and therefore remain undiscovered
by current SN search programmes working at optical wavelengths. However,
in the near-IR Ks-band the extinction is greatly reduced and the sensitivity
of ground-based observations is still good. That is why we are using INGRID
to carry out an imaging survey of the ~40 most luminous nearby (d<45Mpc)
starburst galaxies visible in the northern hemisphere. These galaxies have
been selected to have far-IR luminosities greater than or comparable to those
of the two prototypical starbursts, M 82 and NGC 253, but excluding galaxies
whose far-IR luminosity is powered by a population of old stars or an AGN.
The expected CCSN rates in these galaxies (
Mattila
& Meikle, 2001) range from around 0.05 yr
–1 in NGC 253
(LFIR~1010.3 L
solar and 0.2 yr
–1 in NGC 4038/39 (LFIR~1010.8
L
solar) to around 1–2 CCSNe per year in Arp 299 (LFIR~1011.8L
solar).
|
| Figure 1. Extinctions (AV) towards 33 SNRs in M
82 (from Mattila & Meikle, 2001,
2002).
[ JPEG | TIFF ]
|
Since the average distance to our targets is ~30 Mpc, most of them fit well
within one quadrant of the INGRID detector (2 arcmin×2 arcmin). This
enables us to observe most of the target galaxies using the quadrant jitter
method in which the galaxy nucleus is placed in the middle of each quadrant
of the array in turn. As the three other quadrants contain “empty” sky, the
actual target frames can be used to create a sky frame for each of the galaxies
and a sky flat field frame for the whole night. Thus, there is generally
no need for offset sky images. This improves the observing efficiency allowing
2–3 galaxies to be observed per hour (with 10–20 minutes on-source
exposure time each). The catch of a clear night is therefore 20–30 galaxy
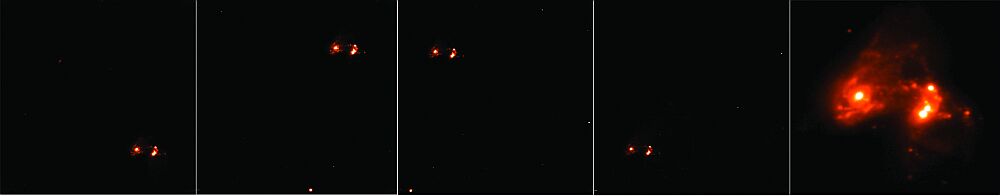
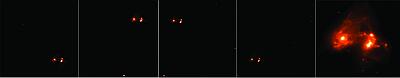
images in which nuclear CCSNe might be hiding. In Figure 2 we show four individual
frames and the final combined frame of Arp 299, a luminous infrared galaxy
at a distance of 45 Mpc, as an example of a quadrant jitter observation.
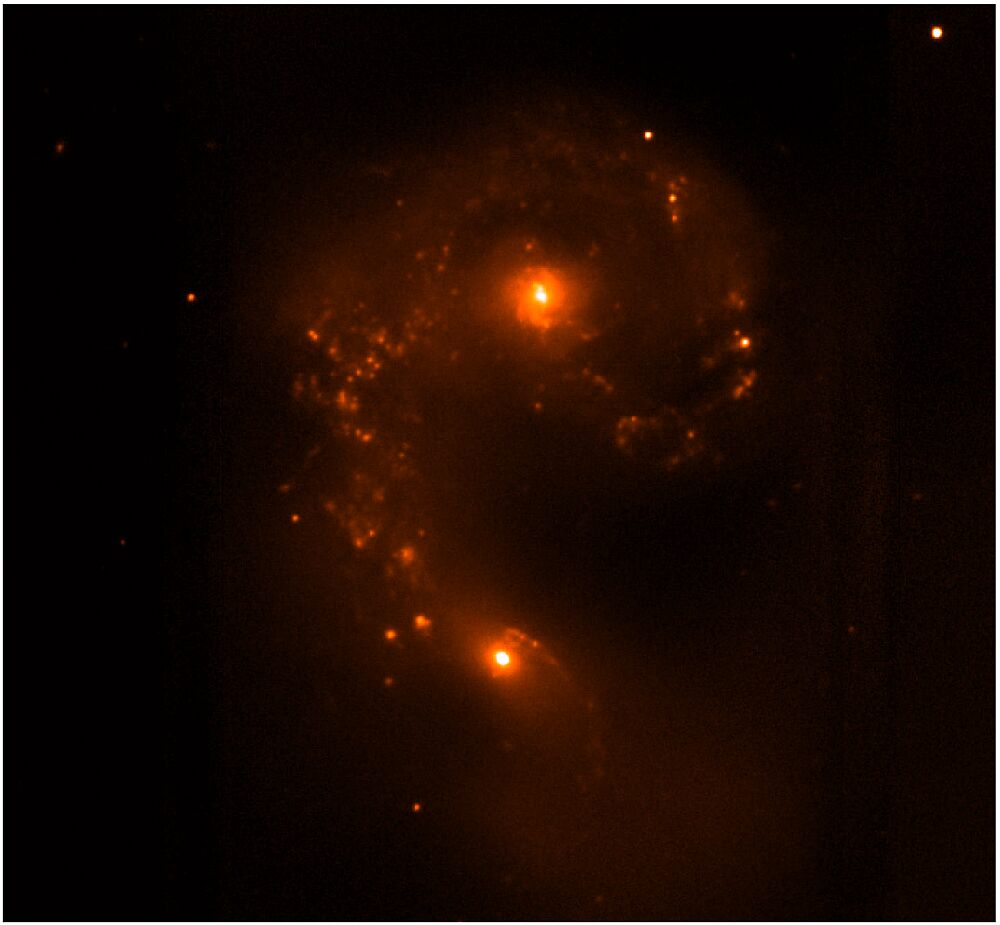
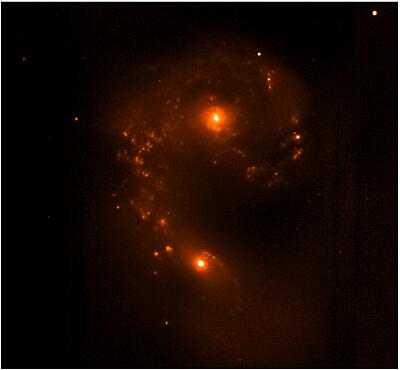
In Figure 3 the Ks image of another sample galaxy is shown, NGC 4038/39 (the
Antennae, distance 20Mpc). In general, to increase the number of frames and
thus the total on-source exposure time per galaxy we perform a 4-point dither
on each of the quadrants in turn. Therefore, a full quadrant jittering cycle
produces typically 16 frames per galaxy, all with different offsets. When
creating a sky frame the quadrants in which the galaxy is known to be are
masked out. Thus the number of pixels which are median-combined to form a
sky frame is 12. The observing procedure is simplified by the use of scripts
which control the telescope/data acquisition sequence. The target quadrant
identification is encoded into the object string in the image header, for
subsequent use by the data pipeline.
|
Figure 2. Ks band images of Apr 299 (North is up
and East to the left) obtained with INGRID at the WHT on January 2nd, 2002.
Four quadrant jitter frames with 10×6 sec. exposure time are shown
on the left, and the combined frame formed from 32 individual frames (32
minutes total exposure time) on the right. The intensity in the combined
frame has a square root scaling. [ JPEG | TIFF ]
|
|
Figure 3. Ks band image of the Antennae, NGC 4038/39
(North is up and East to the left) obtained with INGRID at the WHT on January
2nd, 2002 (640 second exposure time). [ JPEG | TIFF ]
|
The full sampling of the seeing disk (FWHM ~0.7'') by INGRID (0.24''/pixel)
allows us to compare the reduced galaxy images to reference frames obtained
earlier, using image subtraction. For this we use the Optimal Image Subtraction
method (
Alard
& Lupton, 1998;
Alard,
2000) which derives a convolution kernel to match the better seeing image
to the image with the poorer seeing. It also matches the background differences.
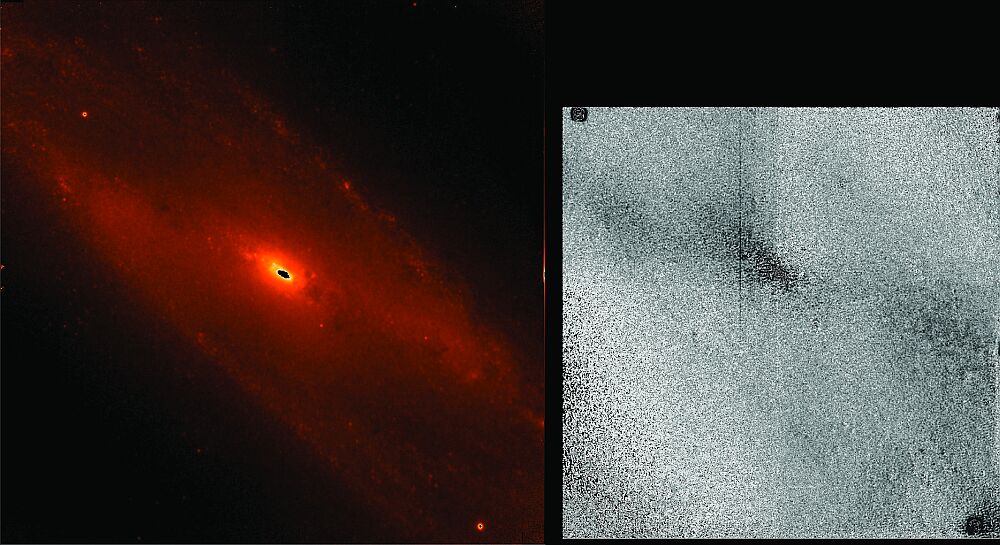
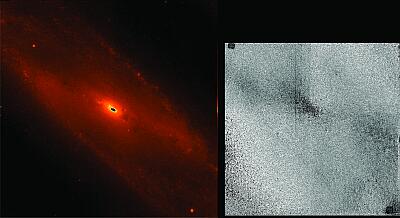
In Figure 4 we show an example of image subtraction using a pair of images
of NGC 253 (distance ~3Mpc) observed under different seeing and photometric
conditions in August 2001 (FWHM = 0.9'') and January 2002 (FWHM = 1.1'').
Here, 21 different 5.7''×5.7'' regions automatically selected by the
image subtraction program were used for deriving the convolution kernel.
The spatial variations of the INGRID PSF were modelled with a 2nd order polynomial
and the differential background variations with a 1st order polynomial. The
subtraction residuals are very small except for the two bright stars visible
in the north-east and south-west from the nucleus. When the image subtraction
is carried out with a constant kernel solution using just one region centred
on the galaxy nucleus for deriving the kernel, a slight PSF variation between
the frames over the INGRID field of view (4arcmin×4arcmin) is visible.
Such relative PSF variations can be caused by e.g. differential rotation
between the two frames (
Alard,
2000) as a result of imperfect image registration. More image subtraction
examples and starburst galaxy images can be found at
http://astro.ic.ac.uk/nSN.html.
|
Figure 4. Ks band image of NGC 253 (North is up
and East to the left) obtained with INGRID at the WHT on August 31st, 2001
(300 second exposure time) is shown with a square root intensity scaling
on the left. The result of image matching and subtraction is shown on the
right. [ JPEG | TIFF ]
|
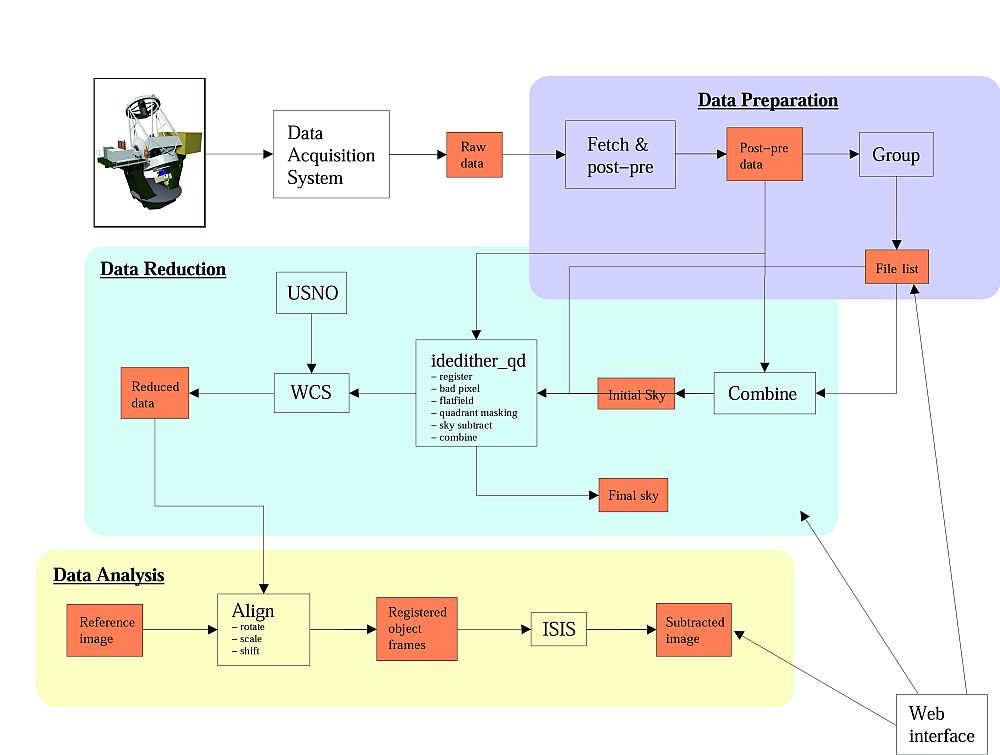
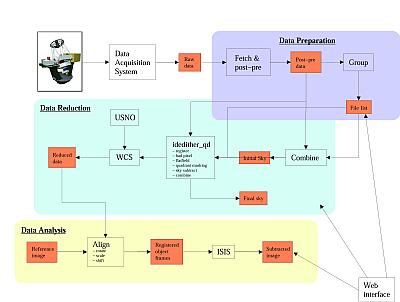
The quick, effective reduction and analysis of the SN search data is essential
for this programme to succeed. Therefore, the INGRID data taken in this project
are pipeline-processed in near-real time at the telescope (see Figure 5).
The IRAF-based pipeline runs on one of the Beowulf clusters at the telescope
(
Greimel
et al., 2001). At the beginning of the observing run, calibration data
is taken to generate a bad pixel mask and a dome flat field for the image
processing. When a new image is taken by the Data Acquisition System it is
automatically copied to the cluster and the post-pre image subtraction is
done. An image grouping task then waits until all the exposures for a given
galaxy have been taken before feeding the list of exposures to the next step.
Once all the images for one object are on the cluster they are combined to
give an initial sky frame. The images and the initial sky frame are then
fed into a modified de-dithering routine (idedither_qd) from the INGRID quicklook
package (ingrid_ql) in which the images are registered on a user defined
star (this will be automated in future); a final sky image is created based
on quadrant masking; then every image is sky subtracted, bad pixel masked
and flat fielded; and the processed images are finally combined. The last
processing step is to apply a World Coordinate System (WCS) solution based
on the USNO catalogue to the combined image. At this point a data analysis
task takes over. The new image of the object is compared with an archived
image from previous runs. The rotation, shift and scaling are calculated
for the image, based on user-selected stars. In the future this will be automatically
done based on the WCS solution. The final step in the data analysis is the
image subtraction using the Optimal Image subtraction software (ISIS) as
described above. The subtracted images are then inspected by eye. In addition,
the fully reduced search images are compared to the existing reference images
by blinking. Apart from automating the various pipeline steps, we are also
working on the implementation of a web-based interface for the pipeline which
will allow easy steering of the pipeline as well as immediate access to the
data by off-site collaborators.
|
Figure 5. The real-time data analysis pipeline.
[ JPEG | TIFF ]
|
Having acquired a complete set of INGRID reference images we estimate a probable
discovery rate of between 0.4 and 0.8 SNe in each clear night’s observations
(see Mattila & Meikle,
2001,
2002).
The newly developed data processing pipeline for the on-going nuclear CCSN
search on the WHT enables an easy real-time analysis of the search data.
This is essential for the rapid follow-up observations of discovered SNe,
in order to determine the nature of these events. Near-IR (JHK) photometry
and spectra will probe both the conditions in the immediate circumstellar/interstellar
environment of the SN and the line-of-sight extinction towards the SN.
A large amount of near-IR imaging data still needs to be collected if we
are to detect a sufficient number of obscured SNe to derive a statistically
significant SN rate in nearby starburst galaxies. Therefore, we invite any
observers who will be acquiring or have recently acquired K-band data of
luminous nearby starburst galaxies to take part in the Nuclear SN search.
Full details of this, and contact information, are given on the ‘Nuclear
SN Search’ pages at
http://astro.ic.ac.uk/nSN.html
We thank Johan Knapen and Petri Väisänen for advice and discussions
on the observing technique.
References:
- Alard C., Lupton R. H., 1998, ApJ, 503, 325. [ Citation in text | ADS
]
- Alard C., 2000, A&AS, 144, 363. [ First citation in text | ADS
]
- Chevalier R. A. & Fransson C., 2001, ApJ, 558, 27.
[ Citation in text | ADS
]
- Dahlen T. & Fransson C., 1999, A&A, 350, 349.
[ Citation in text | ADS
]
- Fassia A. et al., 2000, MNRAS, 318, 1093. [ Citation in text | ADS
]
- Greimel R., Lewis J. R., Walton N. A., 2001, ING Newsl, 4,
9. [ Citation in text | ADS
]
- Mattila S., Meikle W. P. S., 2001, MNRAS, 324, 325. [
Citation in text | ADS
]
- Mattila S., Meikle W. P. S., 2002, in The central kpc of starbursts
and AGN: the La Palma connection, eds. J. H. Knapen, J. E. Beckman, I. Shlosman
and T. J. Mahoney, ASP Conf. Ser., 249, 569. [ Citation in text | ADS
]
- Terlevich R., Tenorio-Tagle G., Franco J., Melnick J., 1992, MNRAS,
255, 713. [ Citation in text | ADS
]
- Sullivan M., Ellis R., Nugent P., Smail I., Madau P., 2000, MNRAS,
319, 549. [ First citation in text |
ADS
]
- Vink J., de Koter A., Lamers H. J. G. L. M., 2001, A&A,
369, 574. [ Citation in text | ADS
]
Email contact: Seppo Mattila (
s.mattila@ic.ac.uk)