 | |||
|

| Home > Public Information > ING Annual Reports > 2004-2005 > Scientific Highlights |
Previous: Introduction | Up: Table of Contents | Next: Operation, Maintenance and Developments
Other available formats: PDF
Scientific Highlights
The Discovery of a Galaxy-Wide Superwind from a Young Massive Galaxy at Redshift z ≈ 3
The formation of galaxies requires gas to cool in haloes of dark matter that
collapse under gravity from the expansion of the Universe. However, cooling
alone overproduces bright galaxies at the present day, so models incorporate
thermal conduction, photoionisation and galaxy merging, together with additional
feedback in the form of galactic-scale outflows. The latter are powered by
supernovae and massive stellar winds, or by relativistic winds and jets resulting
from gas accretion onto supermassive black holes. These high-velocity galactic
outflows mark the termination of star formation in the most massive galaxies
and deposit heavy elements in the intergalactic medium.
Although starburst superwinds have been studied in local dwarf galaxies, such
as M82, observational evidence for their counterparts in young massive galaxies
at high redshift has been less direct: it is unclear whether such outflows
are localised to regions of intense star formation just a few kiloparsecs
in extent, or whether they instead have a significant impact on the entire
galaxy and its surroundings.
To observe such outflows via absorption studies a background light source
is needed with a spatial extent somewhat larger than a Lyman-break galaxy
stellar body or a quasar sightline. Such a source is provided by the recently
discovered Lyman-α-emitting blobs (LABs), associated with Lyman-break
galaxies in the SSA22 protocluster at redshift z=3.09 (seen 11.5 gigayears
ago when the Universe was 20 per cent of its current age), a structure which
is likely to evolve into a rich cluster of galaxies. Sizes of these LABs are
around 100 kiloparsecs and Lyman-α luminosities of about 1044
erg s-1.
The Lyman-α haloes of two of these LABs were observed using integral-field
spectroscopy, which, unlike conventional slit spectroscopy, gathers spatially
resolved spectra over a two-dimensional area. Such information is essential
for a complete picture of the complex morphology of these objects. Astronomers
used the SAURON Integral Field Spectrograph on the William Herschel Telescope
providing moderate resolution spectra over a 41 arcsec×31 arcsec area,
sampled with 0.95-arcsec lenslets.
Observations of object LAB-2 shows that its spatially extended Lyman-a line
emission appears to be absorbed by neutral hydrogen in a foreground screen
covering the entire galaxy, with a lateral extent of at least 100 kiloparsecs
(over 300,000 light years across or about three times larger than the disk
of our own Milky Way galaxy) and remarkable velocity coherence. Based on the
uniformity of the absorption across the galaxy, it appears that this screen
was ejected from the galaxy during a starburst several hundred million of
years earlier and has subsequently swept up gas from the surrounding intergalactic
medium and cooled. This provides the most direct evidence yet of a galaxy
being almost torn apart by the galaxy-wide impact of high-redshift superwinds.
An absorbing shell is predicted to form when a starburst-heated hot gas bubble
becomes over-pressurized relative to the interstellar medium and hence breaks
out of the galactic disk, accelerates, and fragments as a result of Rayleigh-Taylor
instabilities. Hot gas then escapes into the halo and forms a second shell
of swept-up intergalactic medium. Evolutionary models for the Lyman-a emission
from such superwinds suggest that the LAB-2 absorber is in a late phase, where
the shell has cooled and slowed sufficiently to absorb the underlying emission.
Astronomers have long been puzzled about why key elements for the formation
of planets and ultimately life (such as carbon, oxygen and iron) are so widely
distributed throughout the Universe; only 2 billion years after the Big Bang,
the remotest regions of intergalactic space have been enriched with them.
The superwind observed in this galaxy shows how such blast waves can travel
through space carrying the elements formed deep within galaxies.
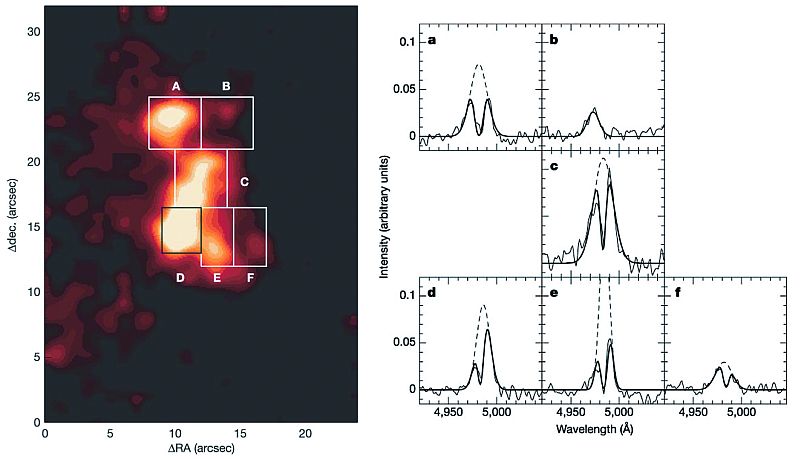 |
Figure 1. Left: This shows the extent of the gaseous halo of LAB-2
(10 arcsec on the sky equates to a physical distance of 76 kpc in this
galaxy approximately). The image was derived from observations with the
SAURON Integral Field Spectrograph, by collapsing the data cube along
the wavelength direction. The labels indicate regions for which one-dimensional
Ly-α emission line profiles have been extracted and shown on the right.
Right: Thick solid lines are fits to a model where the intrinsic Ly-α
emission (dashed lines) is partially absorbed by foreground HI [ JPEG
| TIFF ]. |
The Isaac Newton Telescope Photometric Hα Survey of the Northern Galactic Plane
Hα emission is ubiquitous in our Galaxy. It traces ionised gas of assorted
nebulae such as HII regions, planetary nebulae, Wolf-Rayet nebulae, and supernova
remnants. It is a strong signature of active stars, interacting binaries,
very massive stars (especially supergiants, Luminous Blue Variables and Wolf-Rayet
stars), Be stars, post-AGB stars, pre-main-sequence stars and so on. These
objects represent important evolutionary phases which are generally short
lived, and are hence few in number and difficult to find. Their discovery
is therefore well worth the effort of a concerted programme and in August
2003 a major new survey project was started using the Wide Field Camera (WFC)
on the Isaac Newton Telescope (INT) to do just that. It is called the INT
Photometric Ha Survey of the Northern Galactic Plane, or IPHAS for short.
Its goal is to conduct an Hα survey of the entire northern Galactic
Plane in the latitude range –5°<b<+5°, a sky
area of 1800 deg2, covering the magnitude range 13<r'<20.
When complete it will represent an enormous improvement over previous work.
The final catalogue of IPHAS point sources will contain photometry on about
80 million objects. Used on its own, or in combination with near-infrared
photometric catalogues, IPHAS will be a major resource for the study of stellar
populations making up the disc of the Milky Way. The eventual yield of new
northern emission-line objects from IPHAS is likely to be an order of magnitude
increase on the number already known.
Below several examples of the images being obtained are shown.
 |
 |
 |
 |
|
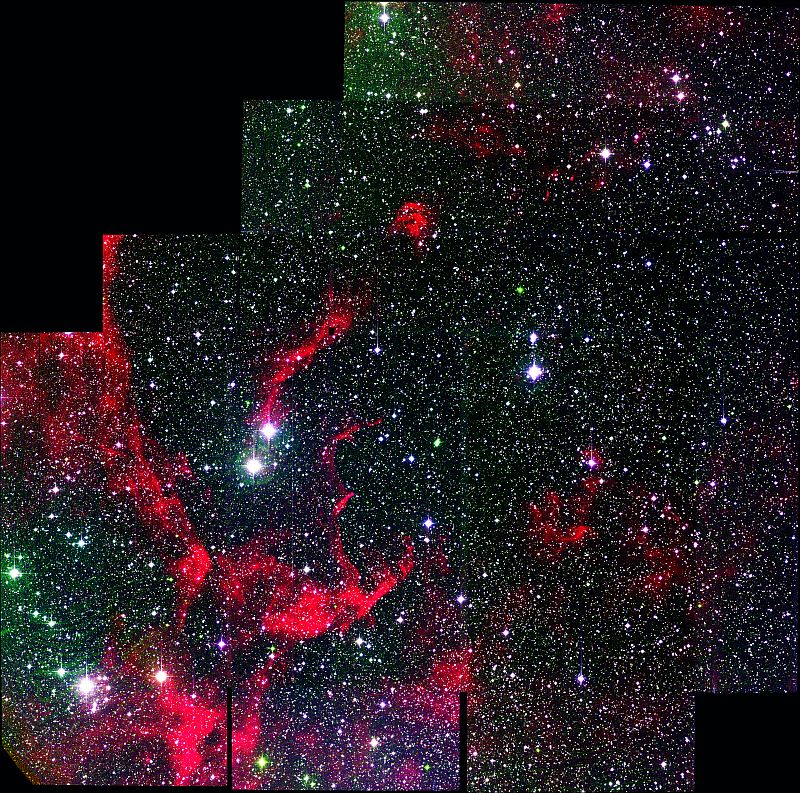
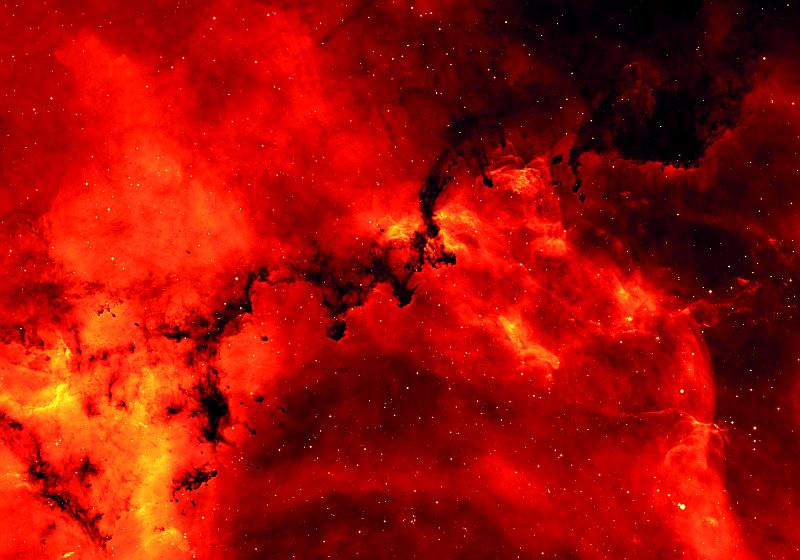
Figure 4. Filamentary Hα emission in Cygnus.
The colour scheme is red for Hα, blue for the Sloan r'
band, and green for Sloan i' band. As this is a significantly
reddened region, as well as nebulous, there are many stars coming
through strongly in the i' band, appearing here as a background
of green stars [ JPEG | TIFF
].
|
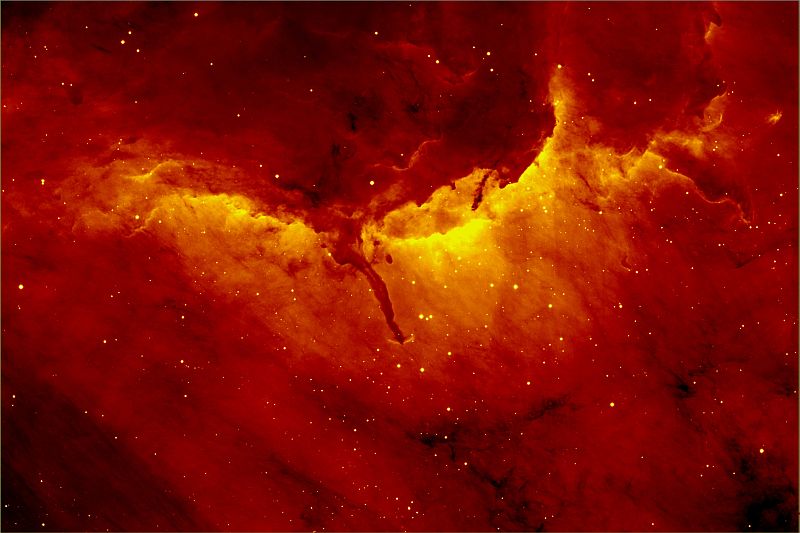
Figure 5. Sh2-242 is a small HII Region on the
edge of a molecular cloud that lies just southeast of the supernova
remnant Simeis 147 in the constellation of Taurus. There is evidence
that this molecular cloud may contain a young stellar cluster of newly-born
stars. Field of view is approximately 10×10 arcmin. North is
down and East to the right [ JPEG |
TIFF ].
|
 |
 |
|
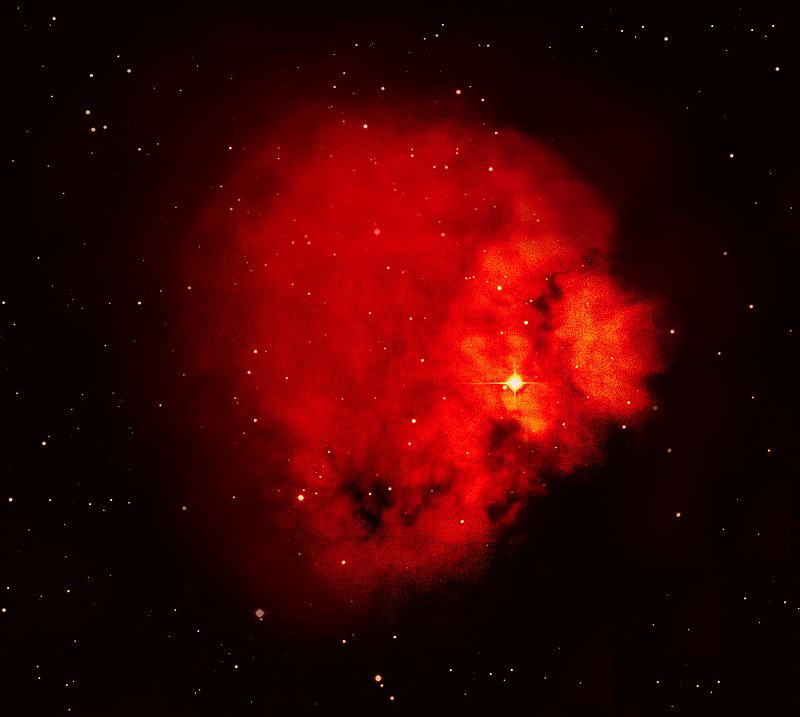
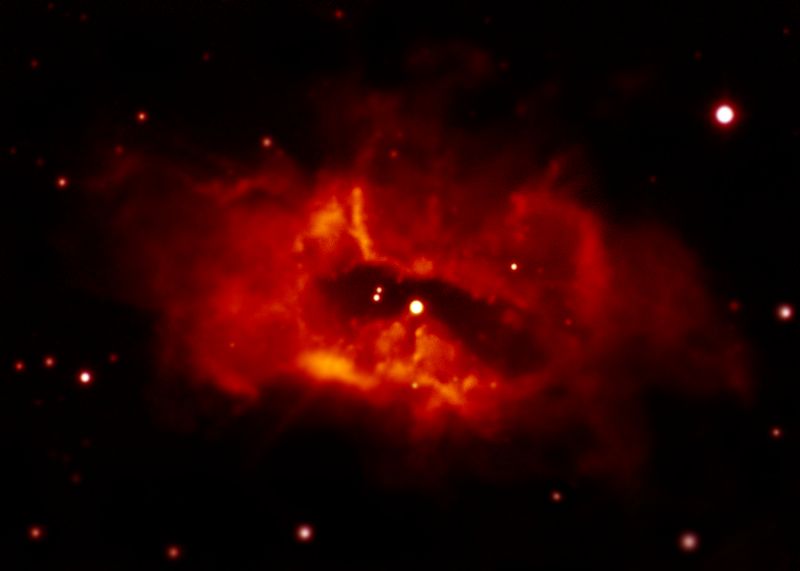
Figure 6. The Pelican Nebula is a massive nebula
in the constellation of Cygnus. It lies close to the North American
Nebula, the two being separated by a giant dust cloud. This image
shows the main ionization front of the Pelican Nebula which makes
up the head and neck of the Pelican. Recent observations have identified
many new Herbig-Haro objects in this area, including two that can
be seen in this image, the first on the far right hand side and the
second at the end of the dust column in the second. Field of view
is approximately 25×15 arcmin, North is to the left, East is
down [ JPEG | TIFF
].
|
|
 |
 |
|
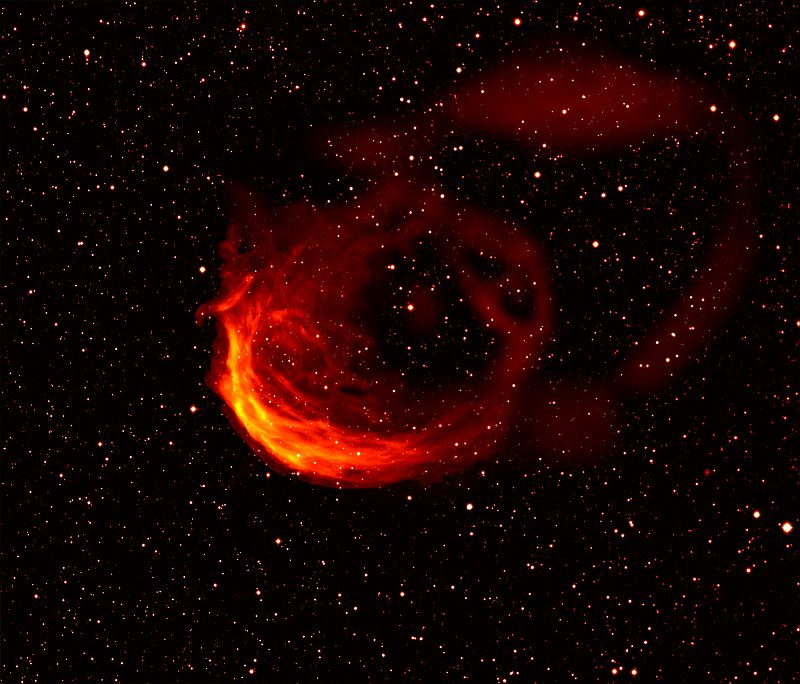
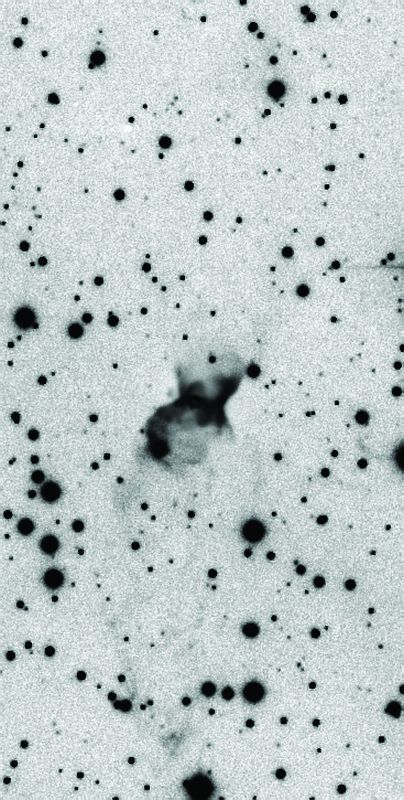
Figure 8. Sh 2-188 is a wind blown planetary nebula
in Cassiopeia. It is a perfect example of a strong interaction between
a planetary nebula and the interstellar medium. It shows a single
arc-like structure with a faint, thin arc behind it. Also visible
is a longer, wide arc extending away from the nebula itself. Recent
studies have shown this shape to be due to the motion of the planetary
nebula through the interstellar medium at a velocity of 125 km s-1.
Field of view is 22×22 arcmin, North is up, East to the left
[ JPEG | TIFF ].
|
|
 |
 |
The Companion Star to Type Ia Tycho Brahe's 1572 Supernova
The brightness of type Ia supernovae, and their homogeneity as a class, makes
them powerful tools in cosmology, yet little is known about the progenitor
systems of these explosions. They are thought to arise when a white dwarf
accretes matter from a companion star, is compressed and undergoes a thermonuclear
explosion. Unless the companion star is another white dwarf (in which case
it should be destroyed by the mass-transfer process itself), it should survive
and show distinguishing properties.
Tycho’s supernova is one of only two type Ia supernovae observed in
our Galaxy, and so provides an opportunity to address observationally the
identification of the surviving companion.
A team of astronomers carried out an imaging and spectroscopic survey using
ISIS, UES and the Auxiliary Camera on the WHT of the central region of Tycho's
supernova remnant, around the position of the explosion. The analysis of the
data excluded red giants as the mass donor of the exploding white dwarf. However,
they found a type G0–G2 star, similar to our Sun in surface temperature
and luminosity (but lower surface gravity), moving at more than three times
the mean velocity of the stars at that distance, which they claim to be the
surviving companion of the supernova.
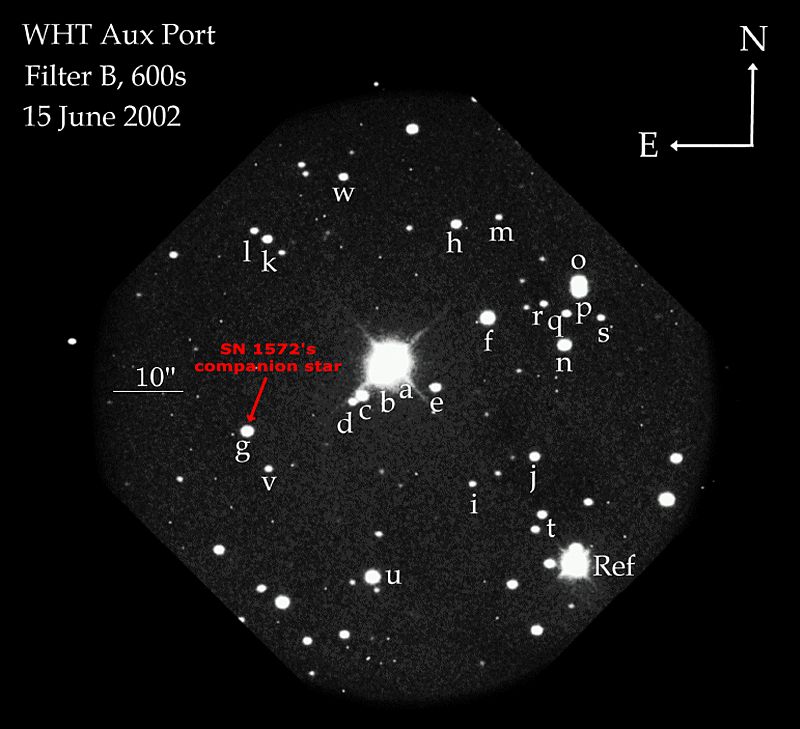 |
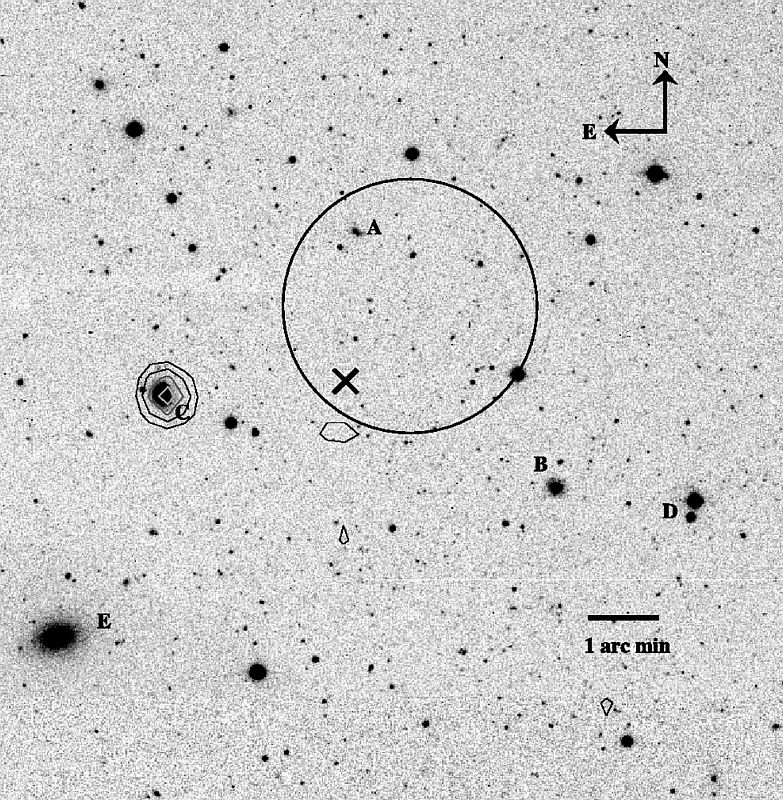
Tycho G is a star of type G0-G2 IV located at the distance of Tycho SNR and it moves in space at 136 km s-1, which is a factor of over 3 larger than the mean velocity of the surrounding stars (Tycho G´s metallicity in Fe and Ni are similar to solar values and therefore it can´t be a halo star). Its low surface gravity can also be interpreted as a consequence of mass stripped by the impact of the supernova explosion.
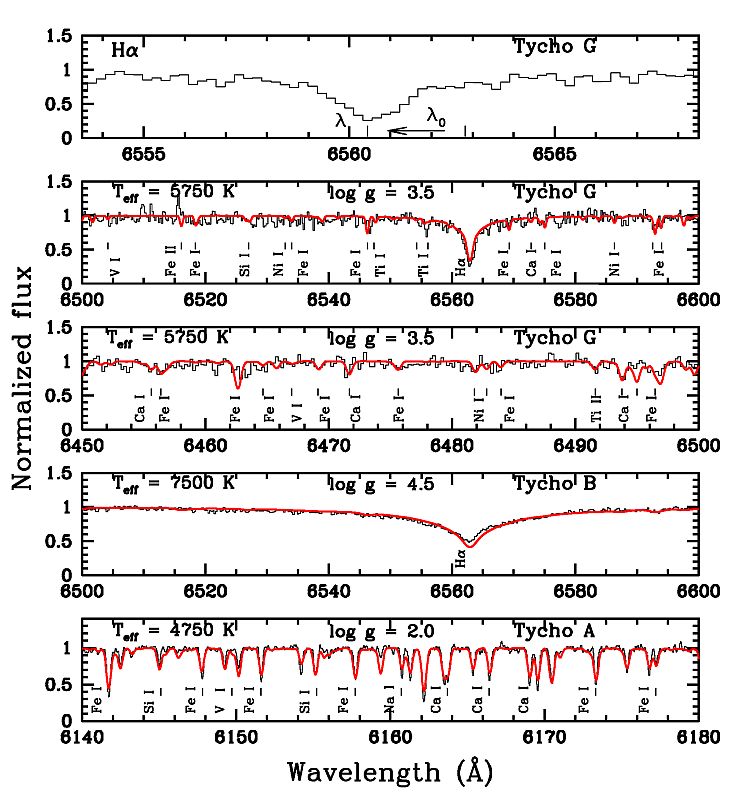 |
Figure 13. The spectra shown here
are of the candidate star for the companion to SN 1572 (Tycho G),
a red giant (Tycho A) and main-sequence star (Tycho B). Spectra were
obtained at the WHT with UES and ISIS. The upper panel shows the observed
spectrum near Hα. This line is blueshifted, implying a peculiar radial
velocity exceeding about 3 times the velocity dispersion for its stellar
type [ JPEG | TIFF
]. |
The Largest Known Planetary Nebula on the Sky
The vast majority of Planetary Nebulae in our own Galaxy have been identified via wide-field narrow-band Ha surveys or through wide-field low-resolution slitless spectroscopic surveys, with both techniques attempting to isolate objects showing very high equivalent width emission lines that are characteristic of PNe.Examining the results of an automated search of the Sloan Digital Sky Survey (SDSS) spectroscopic database for emission lines from putative high-redshift sources, one particular galaxy showed an unambiguous emission line detection with a somewhat weaker feature to the blue. The emission line pair was immediately identifiable as emission from [OIII] 4959, 5007. Not an entirely unexpected occurrence but the unusual feature of the detection was that the wavelength of the detection placed the emission at essentially zero radial velocity. Querying the output of the emission line search for similar detections produced more spectra showing a similar signature. All of the objects possessing [OIII] emission occurred in an approximately circular region with a diameter of ~1.5°, with not a single detection anywhere else on the sky. Investigation of SDSS spectra of stars, quasars and even sky fibres revealed further detections, all concentrated in the same region of sky.
A series of checks fairly rapidly eliminated the majority of instrumental artifacts or transient phenomena as the cause of the emission. Combining spectra beyond the boundaries of the region where [OIII] emission was detected produced clear detections of [OIII] emission extending over a region more than 2° in diameter. A smaller number of individual spectra also showed the presence of emission from Ha and [NII] 6548, 6583. The spatial distribution of the individual emission line detections revealed clear trends and composite spectra, made up from objects contiguous on the sky, confirmed the trends and even allowed the detection of [SII] 6718, 6732.
Narrowband imaging of the central part of the region was carried out using the WFC on the INT. The results were unambiguous, with excellent agreement between the surface brightness distribution evident in the INT images and the emission line detections from the SDSS spectra. A striking feature of the images was the presence of a well-defined arc-like feature, perhaps suggestive of some form of shock. A search of the region using SIMBAD revealed the presence, close to the region with the strongest [OIII] emission, of a very nearby, extremely hot DO white dwarf (PG 1034+001). The location of the white dwarf clinched the identification of the emission region as a PN.
The diameter of more than 2° makes the object the largest known PN on the sky. The spectroscopic distance estimate of 155+58 pc means the PN is certainly the second closest known and a parallax distance could confirm the nebula as the nearest PN to the Solar System. The unambiguous detection of a PN associated with a non-DA white dwarf is also a first. The PN is certainly old, an estimate of the expansion age and a kinematic age estimate, derived from extrapolating the observed proper motion of PG 1034+001 back to the origin of the radius of curvature of the arc feature, both suggest an age of ~100,000 years. The strongly enhanced [NII] emission evident along the south western boundary of the PN is also indicative of the interaction of an old PN with the surrounding interstellar medium.
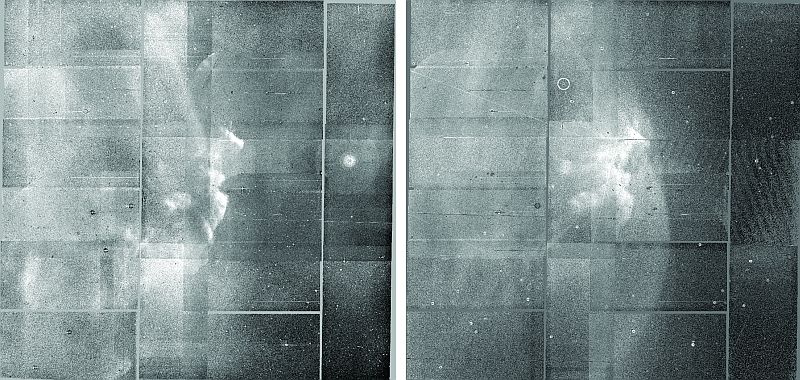 |
Figure 14. The left hand panel
shows a mosaic of 6 INT WFC continuum–subtracted pointings in
Hα+[NII] while the right panel shows the equivalent for [OIII]. The
images are approximately 0.8° on a side with North to the top
and East to the left. The location of the white dwarf PG1034+001 is
indicated by a circle in the [OIII] image. Emission with complex structure
is evident in the central regions of the images in both passbands.
A well–defined arc, or boundary, is visible at center–right
in the [OIII] image [ JPEG | TIFF
]. |
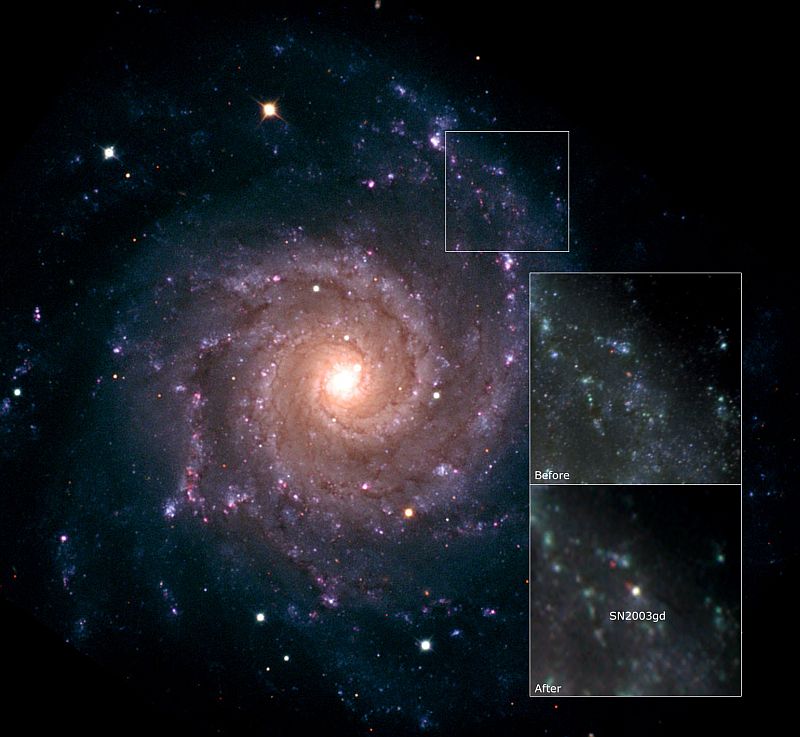
First Detection of a Progenitor Star from a Normal Type II-P Supernova
Supernova 2003gd was discovered on 12.82 June in the nearby spiral galaxy M74. From observations carried out using the ISIS spectrograph on the WHT, it was shown to be a type II–plateau (II-P) SN that was discovered about 87 days after explosion. A team of astronomers also observed its gradually fading light for several months using the INT.The progenitors of type II-P SNe have long been thought to be red supergiant stars with initial masses greater than 8 to 10 solar masses that have retained their hydrogen envelopes before core collapse. This model accounts for the 2- to 3-month-long plateau phases seen in the lightcurves of SNe II-P, the existence of hydrogen P-Cygni profiles (which are indicative of an optically thick expanding atmosphere) in the early time spectra, and the estimated physical parameters of the expanding photosphere such as velocity, temperature, and density. Stellar evolutionary calculations are consistent with this picture, in which stars with initial masses in the range of 8 to 25 solar masses reach the end of their nuclear burning lives when they are red supergiants.
Only two progenitors of unambiguous SNe have been directly identified and yielded estimates of luminosity, temperature, and mass. These are the progenitors of the peculiar type II-P SN 1987A, which was a blue supergiant, and the IIb SN 1993J that arose in a massive interacting binary system. The expected red supergiant origin for the common type II-P SNe has so far eluded direct detection. The fortuitous coincidence of a type II-P SN occurring in a nearby galaxy that has high-quality prediscovery images available has allowed the direct determination of the physical parameters of a SN progenitor for only the third time.
The galaxy M74 was observed with the HST about 200 days before the estimated explosion date of SN 2003gd of 18 March 2003 (with an uncertainty of about 21 days). This galaxy was also observed about 310 days before the explosion by the Gemini Telescope. An approximate position for the SN was estimated from images obtained using the Auxiliary Port Camera of the WHT and precise differential astrometry from HST images. Astronomers identified an object in the pre-explosion HST and Gemini images that is coincident with SN 2003gd.
This is the first detection of a progenitor star from a normal type II-P SN, which is the most common type of SN (by volume) in the Universe. It is a red supergiant, which is consistent with the models of single stellar evolution. Recently, there have been attempts to identify the progenitors of three nearby type II-P SNe by the same method as followed with SN 2003gd. Although these have failed to detect an object, they have been able to set restrictive upper mass limits. Mass limits of the progenitors were estimated to be 15 solar masses for SNe 1999em and 2001du and 12 solar masses for SN 1999gi. These three SNe and 2003gd are all spectroscopically very similar and appear to be a common, homogeneous class of type II. Stellar evolutionary models and theories of the SNe lightcurve and spectral evolution have long predicted that red supergiants should be the progenitors of SNe type II-P.
However, there is a quantitative discrepancy now appearing between the masses that have been derived for these four SNe II-P and the mass required to support the long plateau phase with normal expansion velocities. Consistently high ejecta masses have been derived for a large sample of 13 SNe II-P in the range of 17 to 56 solar masses, quite different from the low masses that the direct method suggests. However, the three SNe with excellent monitoring data and direct mass limits do show agreement, which is strong evidence that the common type II-P SNe originate in stars with masses between 8 and 15 solar masses.
 |
A Panoramic Deep View of the Stellar Halo of Andromeda Galaxy
The structure of the outer regions of galaxies is a key area in which to look
for fossil remnants of the accreted masses from which the galaxies that we
see today are thought to be built. The importance of these regions has increased
in recent years as cosmological theories of structure formation become more
exact in their predictions, and the observational instrumentation required
to conduct these detailed analyses becomes more sophisticated.
Currently composed of 165 individual pointings of the INT Wide Field Camera
(WFC), the M31 halo survey consists of photometry for over 7 million sources,
on a photometric system accurate to 2% over ~40 square degrees on the sky,
in some places probing the halo of Andromeda out to 6° (~80 kpc). Observations
of 800–1000 seconds in the Johnson V (V') and Gunn
i (i') passbands are deep enough to detect individual RGB
stars down to V'= 0 and Main Sequence stars down to V'=–1.
This unique dataset has provided, for the first time, a panoramic deep view
of the stellar halo of a giant galaxy thought to be similar to our own Milky
Way.
Despite exhibiting a near pristene disk, M31’s halo is full of substructure
and points to a history of accretion and disruption. The most obvious piece
of substructure is the giant stellar stream (visible in the south-east). This
extends to near the edge of the survey —a projected distance of some
60 kpc. In fact, by examining the systematic shift in the luminosity function
of the stream as a function of galactocentric radius, a length much greater
than 100 kpc is found. The similarity of the colour of this feature with the
loop of material at the north of the survey suggests it seems likely that
the northern feature is an extension of the stream, after it has passed very
close to the centre of the potential of M31.
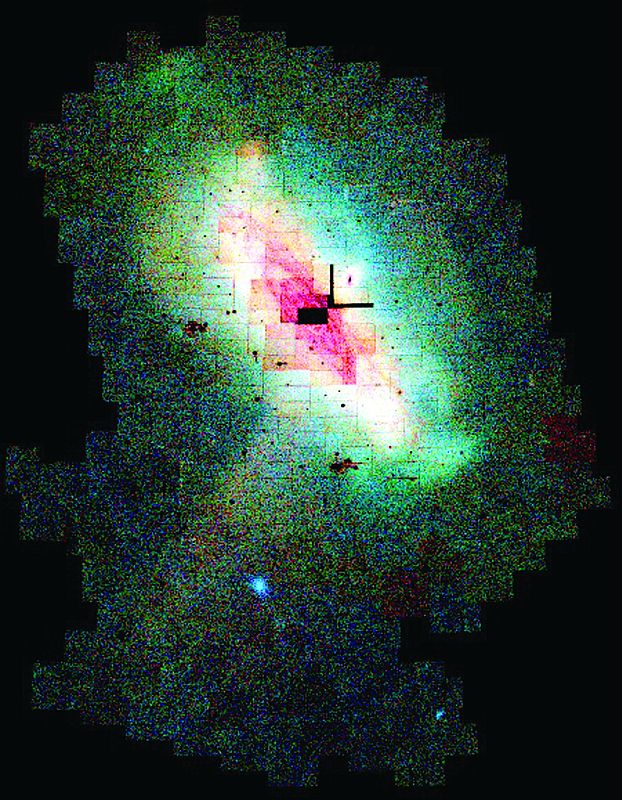 |
Figure 16. A multi-colour mosaic
of the INT WFC survey of M31, involving 165 individual pointings over
40 square degrees of the sky, which shows the inhomogeneity of this
system. Metal-poor/young stars are coded blue whilst metal rich/older
stars are coded red. The (colour-dependant) substructure is obvious,
and surprising given the pristene nature of the Galactic disk. The
dwarf galaxies Andromeda I & III are visible at the bottom left
of this figure; the newly discovered dwarf spheroidal, Andromeda IX,
is just visible at the top left as a small blue dot. NGC 205 is also
visible in this figure, at the right-hand side of the disk This spectacular
image shows in amazing detail the wealth of information that the INT
is helping to reveal about the structure of this previously invisible
region of galaxies [ JPEG | TIFF
]. |
A second large stellar stream candidate has also been identified with the INT WFC photometry. The visible part of this feature is some 15 kpc long. The progenitor of this feature appears to be the satellite galaxy NGC 205. This object has long been known to be tidally perturbed but it is only now that the full extent of its disruption is becoming clear. Considerable amounts of other substructure exists in addition to these streams.
The other spiral in the Local Group, the Triangulum Galaxy (M33), has also been surveyed with the INT WFC. The structure of this galaxy is striking in comparison to M31: the lack of substructure is immediately obvious. It appears that not all spiral galaxy haloes need look like M31. There is then the question of the M31 dwarf satellite galaxies. The homogeneous nature of the data has allowed accurate and internally self-consistent distances and metallicities to be measured for each of these galaxies. For the first time, the three dimensional spatial distribution of these objects, has reliably probed and revealing that far from being isotropically distributed and unbiased indicators of the potential of Andromeda, there are strong indications that these objects are preferentially located on the near side of Andromeda, towards the Galaxy.
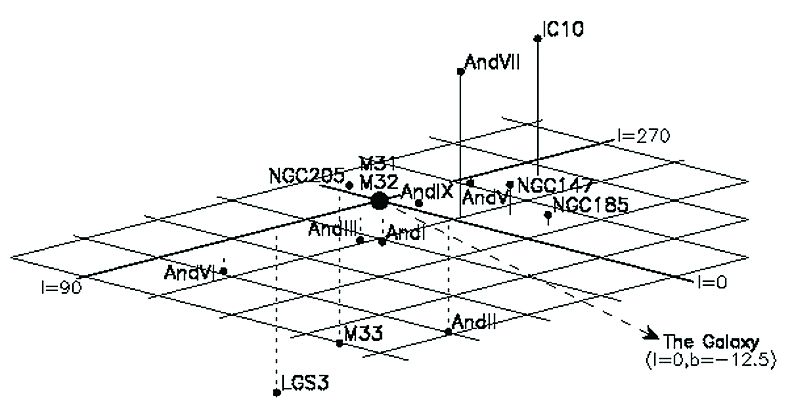 |
Figure 17. The distribution of
the satellite galaxies of M31, as derived from the INT WFC photometry
of these objects. The coordinate system is an M31–centric system.
The plane is the plane of the disk of M31, and each cell corresponds
to 100 kpc×100 kpc. l is a longitude measured around the disk
of M31, such that l=0 is the longitude of the Galaxy. b is a latitude,
measured from the disk of M31. Solid lines indicate objects located
above the plane of the disk, while dashed lines indicate objects below
the plane of the disk. A clear tendency for the satellites to lie
on the near side of M31 can be observed, and suggests an intriguing
correlation between the M31 satellites and our own Galaxy [ JPEG
| TIFF ]. |
A New Population of Star Clusters in the Halo of M31
As part of the INT WFC survey of M31, a search for globular clusters in a large part of the halo has been carried out. Globular clusters systems are valuable tools for the study of the evolution of their host galaxies, acting as chemical and dynamical probes. Specifically, most globular clusters are believed to be old objects, and thus provide clues to the earliest epochs of galaxy formation history.Three extended, luminous globular clusters were discovered during this search for classical clusters. Although having globular-like colours and luminosities, they have unusually large half-light radii, ~30 pc (compared to typical values between 1 and 7 pc) and they are hundreds of times less dense —the distances between the stars are, therefore, much greater. They lie at projected galactocentric distances of ~15 to ~35 kpc. These objects begin to fill the gap in parameter space between (negligible dark matter) classical globular clusters and (dark matter dominated) dwarf spheroidals, and are unlike any clusters found in the Milky Way, or elsewhere to date.
The fields visually investigated included the whole INT Wide Field Survey of M31, an area far into the halo, and an additional region south along the Andromeda Stream, and towards M33, making a total area of more than 40 deg2. The survey consisted of V’- and Gunn i’-band images reaching limiting magnitudes of i’=23.5 and V’=24.5, and taken in average seeing of 1.2 arcsec. These images were processed by the INT-WFS pipeline provided by the Cambridge Astronomical Survey Unit, which includes tools for astrometry, photometry and object description and classification.
The extended M31 clusters have no known analogues in the Milky Way, where such clusters would certainly have been discovered if they existed, unless hidden by the plane of the Galaxy. This suggests that they could hold important clues to the differing formation histories of these galaxies. If these clusters were not born with their present morphology then one may speculate that they are the stripped cores of cannibalized dwarf spheroidal galaxies, or the products of cluster mergers perhaps themselves created in a previous interaction of a gas-rich companion with M31.
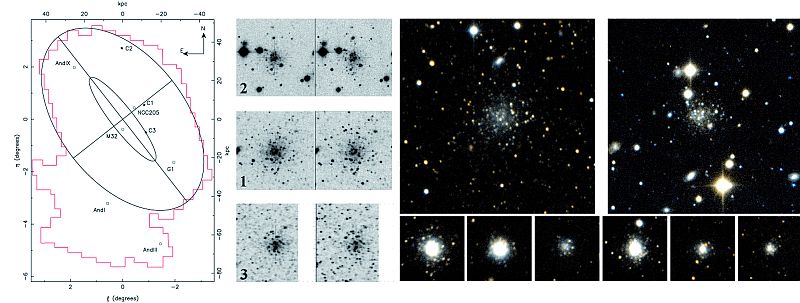 |
Figure 18. The location of the
new extended globular clusters in relation to major landmarks of the
M31 system (open circles), and the survey area (red dotted outline).
The ellipses represent a 2° radius disc aligned and tilted to
the inclination of M31 and an oblate halo of axial ratio 0.6 aligned
along the major axis. The kpc scales correspond to a distance to M31
of 780 kpc. To the right, V- and i-band images of the new luminous
'extended' clusters, from the INT–WFS images. Each image is
1× 1 arcmin2, with north up and east to the left. Cluster 3
is a partial image as it lies on the edge of an INT–WFS field.
Right: Images of two of the newly discovered clusters. Below them
are examples of M31's normal globular clusters, which have similar
luminosities but whose stars are much more concentrated together (and
hence the images of the globular clusters are saturated in the centres
of the clusters) [ JPEG | TIFF
]. |
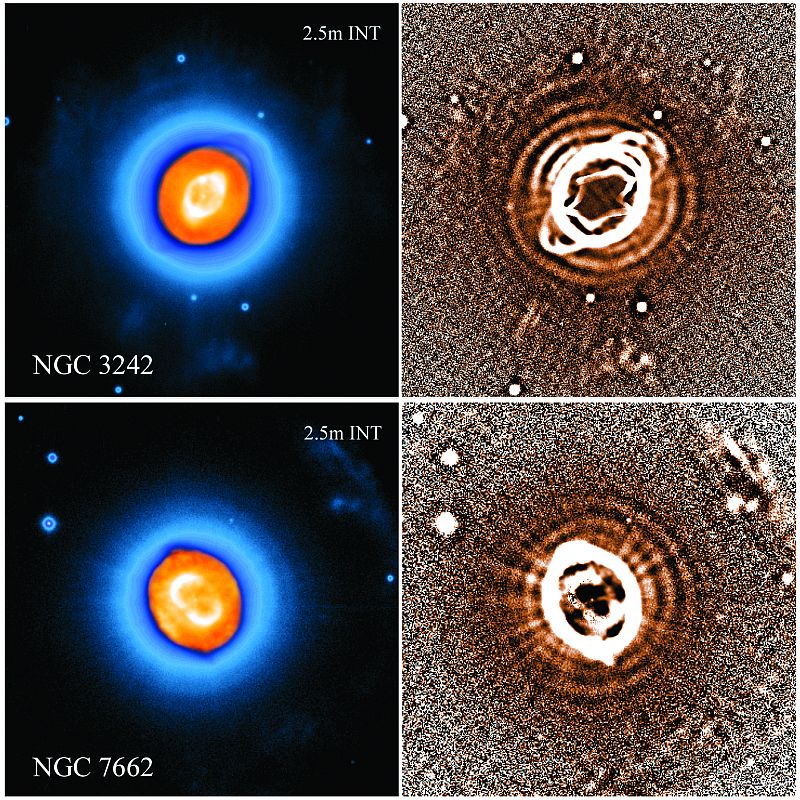
Rings in the Haloes of Planetary Nebulae
The end-point of the evolution of solar-type stars is essentially determined by the onset of a strong stellar wind, which, in a few hundred thousand years completely removes the star’s gaseous envelope, thereby removing the fuel that has previously maintained the thermonuclear energy source in its interior. This phenomenon occur during a (second) phase in which the star becomes a red giant, the so-called the Asymptotic Giant Branch (AGB) stage. In the last million years of the AGB, the red giant is dynamically unstable and pulsates with typical periods of few hundred days: a prototypical star in this phase is Mira in Cetus. The mechanical energy of the pulsations pushes large amounts of material far away enough from the core of the star for it to cool down and condense into dust. This newly formed dust is further accelerated out of the gravitational bounds of the star by the pressure of the radiation coming from the hot stellar remnant. Gas, which is coupled to dust by collisions, also leaves the star in this process.In the last hundred thousand years of the AGB, this mass loss process is so strong that the star is completely surrounded by a thick, expanding dust shell that makes it very difficult to observe what is going on inside it. One way to recover valuable information about this critical phase of stellar evolution is to study the progeny of AGB stars, i.e. planetary nebulae (PNe). These are nothing but the ejected AGB envelopes, heated by the radiation of the hot stellar core, and therefore emitting at the specific wavelengths (emission-lines) typical of the gas that they are composed of.
PNe are fantastic laboratories in which to study a variety of physical phenomena, for example, in the past many aspects of atomic and molecular physics have been addressed by studying PNe. More recently, PNe have become laboratories for investigating the (hydro)dynamical formation of shock waves produced by collisions between stellar winds, with the consequent formation of thin gaseous shells, and bipolar flows or jets which closely resemble those observed in other type of stars or in the nuclei of active galaxies. If we understand the formation of the complex and spectacular shapes displayed by PNe, a lot can also be understood about the very late AGB evolution.
An observational highlight in the investigation of the shapes of PNe came from the HST images of the Cat’s Eye, which revealed the presence of a series of shells in the inner regions of its halo. They appeared to be produced by mass ejected from the star in a series of pulses at about 1500 years intervals during the last 20,000 years of the AGB evolution. Each shell contains about one hundredth of the mass of the Sun, i.e. approximately the mass of all the planets in the Solar System combined. When projected in the sky, these shells appear as “rings” (or sometimes “arcs”) composing a sort of “bull’s-eye” pattern.
Discovery of these rings came as a surprise, as mass-loss modulation on a timescale of 1000 years was not predicted by theory (compare with the 100 times longer timescale of the recurrence of thermal pulses). First, it was thought that rings were a rare phenomenon, but recent observations taken mainly with the Wide Field Camera of the INT, have instead shown that these structures are likely the rule rather than the exception. They are thus of general relevance to understanding the large mass loss increase that characterises the end of the evolution of a star like the Sun.
 |
The Deep Impact Event at the ING Telescopes
The NASA Deep Impact mission was due to collide with a comet in order to reveil the composition and constitution of comets and thereby provide better insight into these bodies that go back to the early phases of the formation of the Solar System. The mission consisted of two spacecrafts: an impactor, weighting 364 kg, and a flyby spacecraft for observing the impact and relaying data from the impactor. The main goal of the mission was to study the interior and outer layers of a comet. Until the impact, very little was known of the internal structure and the physical evolution of the outer layers of a comet nucleus. Most of what we know relies primarily on theoretical models. The relationship between the coma’s composition and the nucleus composition is also uncertain. Even if the coma is formed by material from the nucleus, there are several physical and chemical processes that rapidly affect the material ejected from the nucleus.Comets are remnants of the early stages of the formation of our Solar System and thus contain the most pristine material from that era, as well as clues to its subsequent evolution. Whatever evidence we have into their internal composition comes either from remote observation and modelling of the dust and gases that are lifted off the surface, or from in-situ analysis of data from recent spacecraft flybys. Deep Impact was designed to provide a first look at the interior of a comet by striking the surface to expose the material underneath the opaque crust.
The target comet was comet 9P/Tempel1. This is one of a class of comets known as the Jupiter-family of comets, most of which are believed to have formed in the trans-Neptunian region. These objects have low inclination orbits and typically take less than 20 years to orbit the Sun. Their orbits are strongly influenced by Jupiter, hence their name. 9P/Tempel1 orbits the sun once every 5.5 years, and the Deep Impact encounter was scheduled to take place at perihelion, when the comet was at 1.5 and 0.9 Astronomical Units from the Sun and Earth, respectively.
Deep Impact was designed so that much of the mission-critical science would be done from Earth-based telescopes. These facilities would observe the comet before, during, and after impact. This was an unprecedented coordinated observational campaign, which included over 550 whole or partial nights of observation using 73 ground-based telescopes at 35 observatories. These facilities would observe the comet’s evolution in wavelength regimes and timescales inaccessible to the spacecraft.
The Roque de Los Muchachos Observatory played a substantial role in this campaign. Observations started in 2000. But the interesting part of the game started on July 2nd, 2005. From July 2nd to July 10th a campaign involving three telescopes of the observatory, the WHT, the TNG and the NOT was conducted. LIRIS at the WHT was used from July 3rd to 7th to obtain near infrared images in the J and K bands and near infrared spectra. Also another group used the INT and the Liverpool Telescope to follow the activity of the comet from July 1st to 7th. The five largest telescopes of the Roque de Los Muchachos Observatory were used simultaneously to track an astronomical experiment in an unprecedented way.
On July 3rd, 2005 the Deep Impact impactor probe successfully separated from its mother craft onto a trajectory that would plunge the probe into the nucleus of comet 9P/Tempel1 at a velocity of 10 kms–1. At 05:44:36 UT on July 4th the impactor collided with the comet producing an impact of 19GJ of kinetic energy and excavating a crater shaped by gravity.
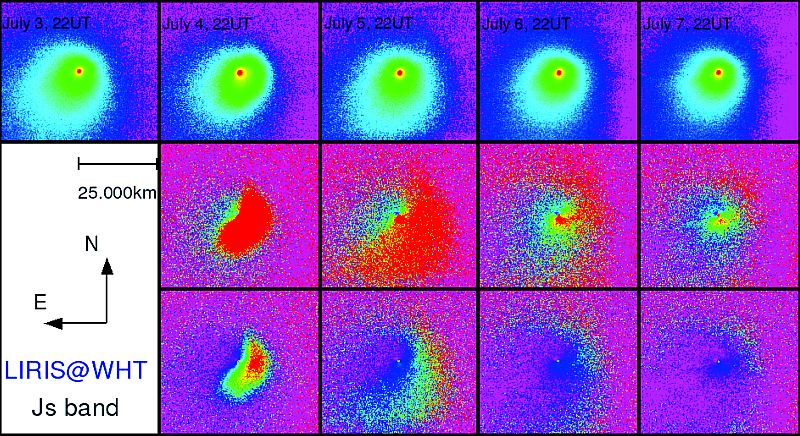 |
Figure 20. First row: Sequence
of calibrated near-infrared J-images of the dust coma of comet Tempel1
obtained with LIRIS at the WHT. Notice the changes in the images from
July 3rd (pre-impact) to July 4th (taken 16 hours after the impact).
Second row: Post-impact J-images processed to show only the dust ejected
by the impact. Each image has been divided by the pre-impact one obtained
on July 3rd. The evolution of the ejecta cloud is clearly seen. Third
row: Same as 2nd row shown in a different flux scale [ JPEG
| TIFF ]. |
The first aim of the campaign was to study the dust ejected by the impact by using the high S/N images obtained in the visible and near infrared, and the spectra in the near infrared where there are many features due to gas emission. The evolution of the intensity and colour of the dust gives important information on the size of the ejected grains, like their size distribution and ejection velocities. The second aim of the campaign was to measure possible variations of the gas emission by means of visible spectroscopy, to detect any possible new activity in case the impactor penetrated deep enough to meet the fresh ices below the dust mantle. This would evaporate part of them and expose ices to the sun-light generating a new active area.
The impact produced an ejected cloud of dust and the observers were able to obtain a set of excellent images, in particular, in the R and J bands. At these wavelengths the images were sampling the reflected sunlight by the dust in the coma. The spectra also showed that the gas contribution was very low in particular in the near infrared. Some conclusions about the dust cloud ejecta follow: the dust ejected by the impact formed a semi-circular expanding cloud that extended from position angles (PA) 145° to 325°; assuming an albedo typical of cometary grain size, and from the flux of the dust ejecta, an estimation of a total mass of dust ejected of ~106 kg (equivalent to about 10 hours of normal comet activity) can be derived; the orientation of the ejecta proves that the impact happened below the orbital plane of the comet; the position of the leading edge of the dust cloud present on the July 4th images show that it expanded outward at a projected speed of about 200±20ms–1 (though varying with azimuth).
In the following days the shape of the cloud changed because of the effect of solar radiation pressure that moved the dust particles to the tail of the comet (PA=110°). The maximum projected distance in the sunward direction, achieved on July 7th, was 30,000 km. By July 9th most of the ejected dust was moved to the coma and the comet looked like as in the pre-impact phase. The ejected dust is diluted in the comet tail.
The study of the structures of the dust coma in high S/N images provided also very interesting results. The comet presented some dust structures in the pre-impact phase that indicate that the nucleus had some particularly active regions. These structures remained after the impact, thus these active regions were not affected. And the new structures observed after the impact on July 4th rapidly disappeared and none remained at a high S/N level after a few days.
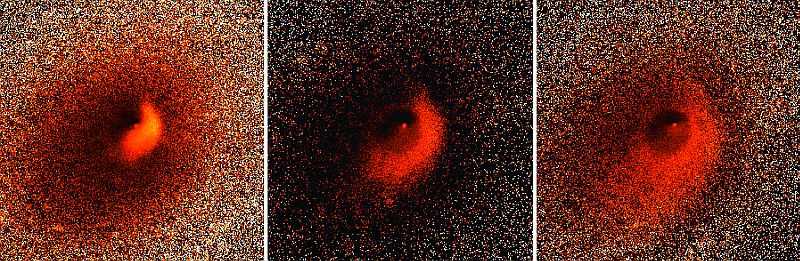 |
Figure 21. These dramatic images
of the expanding and dissipating ejecta plume were obtained by dividing
the July 4th, 5th, and 6th coadded images of the comet by the pre-impact
image on July 3rd. North is up and East to the left. The plume expands
mostly into the South-Western quadrant, and appears to be decelerating
at a non-uniform rate. The dust particles at the leading edge of the
plume, are expanding at a rate of ~210 ms–1 (±10%) on
July 4th (measured at a Position Angle of 225°). The field of
view in every image is 190×190 arcsec, which is equivalent to
~123,000×123,000 km at the comet [ JPEG
| TIFF ]. |
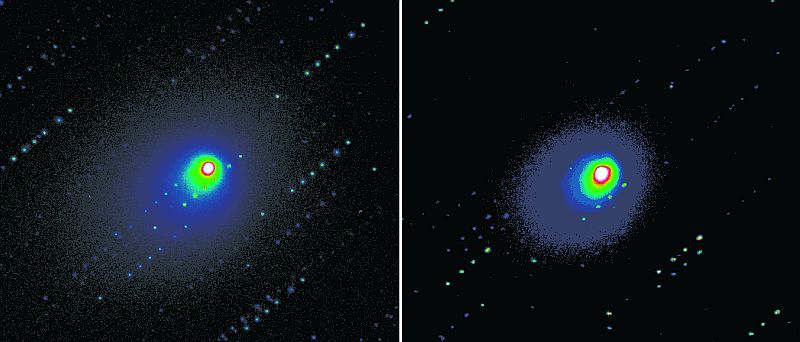 |
Figure 22. When comet Tempel1 came
into view from La Palma, some 16 hours after the Deep Impact probe
struck the comet, observes were able to start tracking the target
comet with the INT. Both images above are a combination of 7×20
second Sloan-Gunn r' (red) filter images which isolate the dust component
of the coma. The image on the left was taken on July 3rd between 21:56
and 23:03 Universal Time, about 7 hours before impact. The image on
the right was taken between 22:08 and 23:56 UT on July 4th, 16 hours
after probe impact. The comet was seen to increase in brightness by
a factor of two —as measured in the central pixel— before
and after the impact as seen from this location. Even in these images
the effects of the impact can be seen by the changing coma shape between
the two images. North is up and East to the left. The field of view
in both images is 340×340 arcsec, which is equivalent to ~220,000×220,000
km at the comet [ JPEG | TIFF
]. |
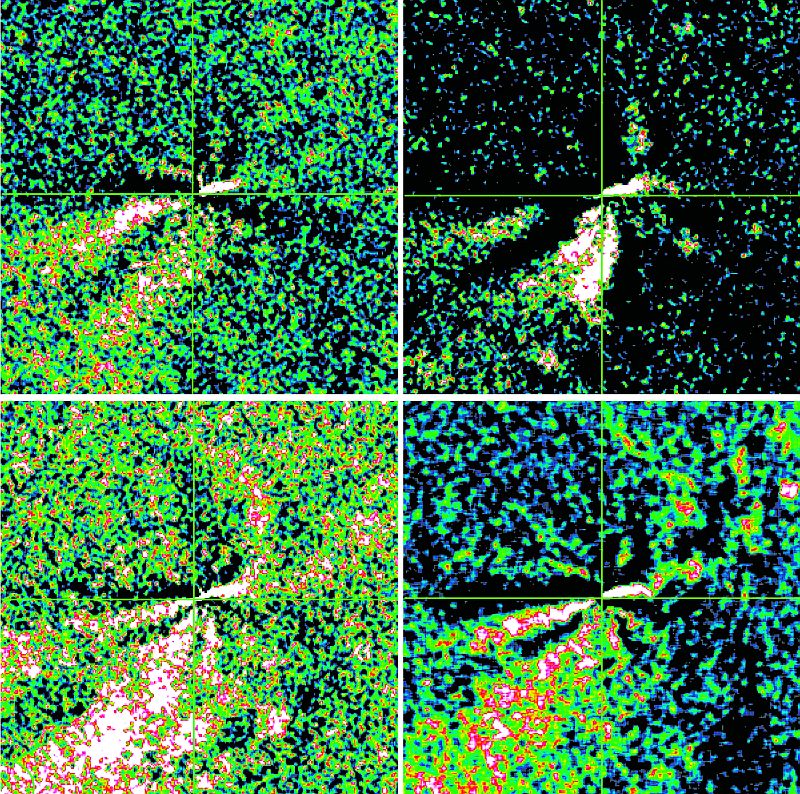 |
Figure 23. Larson-Sekanina image
processing techniques were applied to the coadded r'-filter coma images
from four of the nights to reveal the dramatic changes in the structure
of the dust coma that resulted from the impact. Before impact on July
3rd (upper left panel), three jet structures can be seen to be emanating
from the comet’s nucleus. On July 4th, just 16 hours after probe
impact, the intensity of the jet/coma structures in the West and Southern
direction increase dramatically (upper right panel). North is up and
East to the left. On July 5th, new curved structures can be seen in
the North-Western quadrant (lower left panel), possibly made visible
by the extra material ejected into the coma from the impact. The structures
seem to return to their pre-impact status on July 6th (lower right
panel). The field of view in every image is 95×95 arcsec, which
is equivalent to ~62,000×62,000km at the comet [ JPEG
| TIFF ]. |
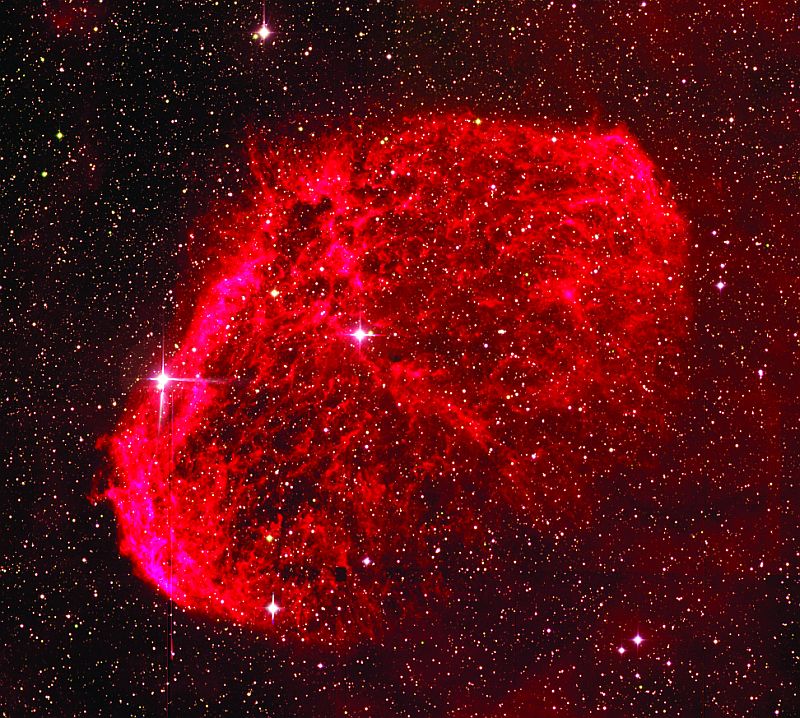
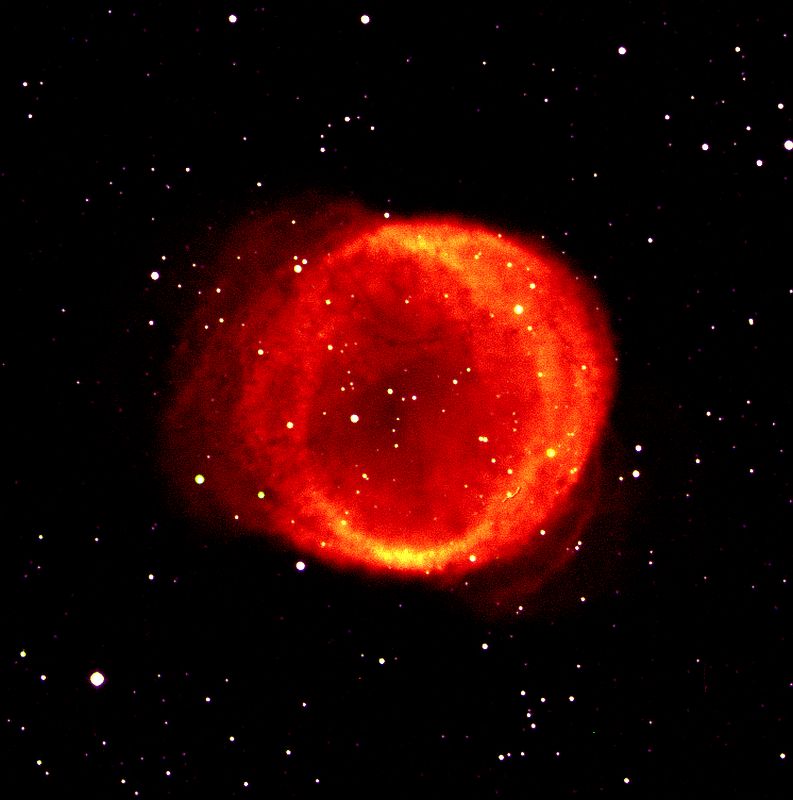
A Jet-Powered Bubble Formed in the Gas Around Black Hole Cygnus X-1
Galactic black holes undergoing accretion are thought to emit the bulk of their
power in the X-ray band by releasing the gravitational potential energy of the
infalling matter. At the same time, they are capable of producing highly collimated
jets of energy and particles flowing out of the system with relativistic velocities
that travel into the surrounding medium.
Black Hole X-ray Binaries (BHXBs) are the essential laboratories for understanding
the overall physics of the accretion process in these systems, and have provided
us with a wealth of understanding of, for example, the properties of the accretion
disc. In comparison, the energy and matter content of the jets produced by BHXBs
are not well constrained because they are radiatively inefficient.
Relativistics jets are a common feature of accreting black holes on all mass
scales, ranging from supermassive black holes at the centres of active galactic
nuclei to stellar-mass black holes in X-ray binary systems within our own Galaxy.
Whereas the inflow of hot gas can be very efficient in producing light (up to
40% of the accreted material may be transformed into energy and radiated away
in the form of optical/ultraviolet/X-ray photons), the same is not true for
the synchroton-emitting outflow, whose efficiency might be lower than a few
per cent. Estimating the total —radiated plus kinetic— power content
of the jets, and hence their importance with respect to the accretion process
in terms of energetics, is a primary aim of high energy astrophysics.
Attempts at measuring the jet power from radio luminosities are riddled with
assumptions about its spectrum and radiative efficiency. However, the jet power
can also be constrained by analysing its interaction with the surrounding interstellar
medium (ISM). Synchrotron radio lobes associated with jets from AGN are commonly
used as accurate calorimeters of the power×lifetime product of the jets,
a method only very recently applied to jets from stellar mass black holes.
In 2004, very deep low radio frequency observations of the field of Cyg X–1,
a 10-solar-mass black hole, resulted in the discovery of a shell-like structure
which is aligned with the resolved radio jet of this BHXB. This radio shell
has been interpreted as the result of a strong shock that develops at the location
where the collimated jet impacts on the ambient ISM. Models of jet-ISM interactions
predict a shell of shocked compressed ISM visible via bremsstrahlung emission,
containing a bubble of relativistic synchrotron-emitting plasma. The spectrum
of the shocked shell should be approximately flat from radio to much higher
frequencies and possess spectral lines in emission. To test this, the Cyg X–1
jet-blown nebula was consequently observed at optical wavelengths with the Wide
Field Camera of the INT.
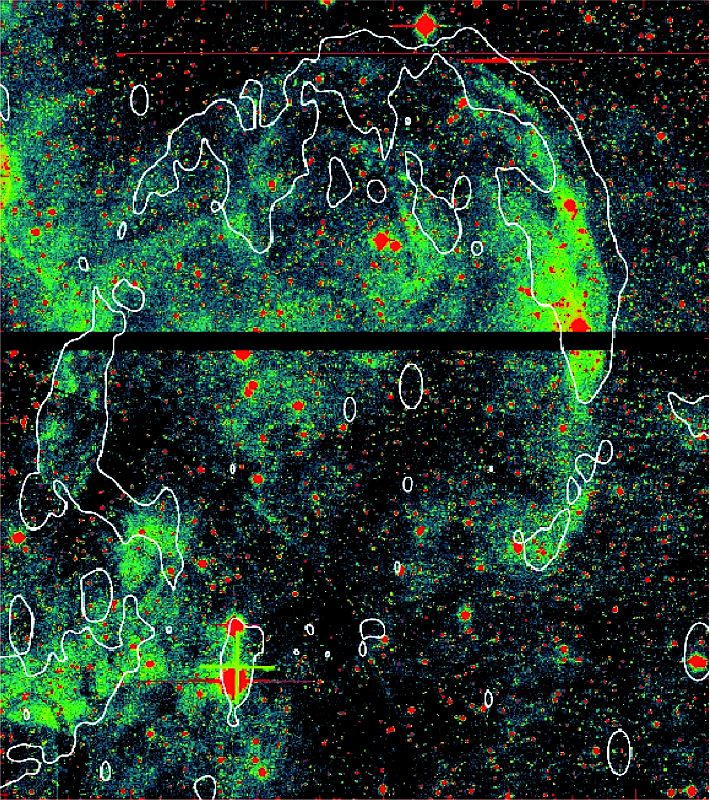
The shell of the nebula is clearly visible in a 100-minute Hα image (a lower
limit of m=23.1 arcsec–2 from the nebula was calculated from the observations).
The researchers claim that an emission mechanism with a flat spectrum, such
as bremsstrahlung, plus excess flux possibly due to line emission, as expected
in the case of radiative shock, can explain the radio and optical data obtained.
However, the spectrum is inconsistent with that of optically thin synchrotron
radiation. This, therefore, is the first detection of a thermal shell of gas
that is shocked by its interaction with a jet of a Galactic black hole.
The discovery of this large-scale (~5 parcsecs in diameter) ring-like structure
surrounding Cygnus X-1 that appears to be inflated by the inner radio jet, imply
that low-luminosity stellar-mass black holes as a whole dissipate the bulk of
the liberated accretion power in the form of "dark", radiatively inefficient
relativistic outflows, rather than locally in the X-ray-emitting inflow, whose
key signature is the eventual energization of the ambient medium. So for decades
astronomers have been severely underestimating how much power black holes pump
back into the universe instead of merely swallowing material across their event
horizons.
 |
This profitable technique has potential for constraining the jet power associated with other BHXBs if further jet-blown nebulae are identified. With the confirmation of this jet-ISM interaction associated with Cyg X–1, it is clear not only that there may be an undiscovered population of jet-blown bremsstrahlung nebulae associated with BHXBs, but also that these nebulae may easily be found with simple wide-field red-optical imaging.
Highly Attenuated Supernovae in the Nuclear Regions of Starburst Galaxies
A handful of nearby supernovae (SNe) with visual extinctions of a few magnitudes
have recently been discovered. However, an undiscovered population of much
more highly attenuated (AV>10) core-collapse supernovae
(CCSNe) is likely to exist in the nuclear (central kiloparsec) regions of
starburst galaxies. For instance, in the nuclear regions of M82 and other
nearby starburst galaxies one core-collapse supernova is expected to explode
every 5–10 years. Furthermore, in luminous infrared galaxies (LIRGs)
such as the interacting system Arp299 (NGC 3690+IC 0694) at least one CCSN
can be expected every year. The high dust extinction means that optical searches
for such SNe are unlikely to be successful.
By observing in the near-IR Ks-band the extinction is strongly reduced,
making searches for such dust obscured SNe look feasible. Making use of this
advantage, astronomers have been carrying out a near-IR Ks-band search
campaign for SNe obscured by dust in the nuclear regions of nearby starburst
galaxies with the WHT since 2001. Initially, the search started using INGRID
near-IR imager. In 2004 observations with LIRIS commenced. By that time, the
search had only produced the detection of a possible SN in old images making
any follow-up observations and definite confirmation of this SN impossible.
They estimated that the lack of SN detections from the INGRID SN search database
indicated an average extinction towards the nuclear SNe exceeding AV=10.
Such high extinctions would certainly be expected for most of the SNe within
the nuclear regions of starburst galaxies such as M82.
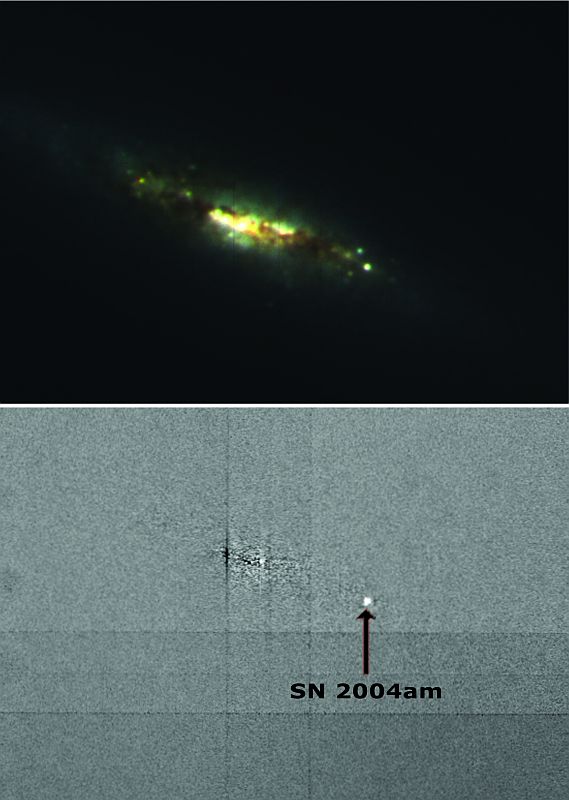
Already on the first run LIRIS observed a SN, SN 2004am, within the nuclear
regions (~500 pc) in M82. The discovery of this event, however, had already
been reported just one day before the observations. The 0.89-1.53-m LIRIS
spectrum showed broad hydrogen lines demonstrating that this was a type II
event. The LIRIS JHKs images showed a moderately reddened source
exactly coincident with a bright starburst knot within the nuclear regions
of M82. The optical-near-IR colours also showed that the extinction towards
this SN was AV~5.
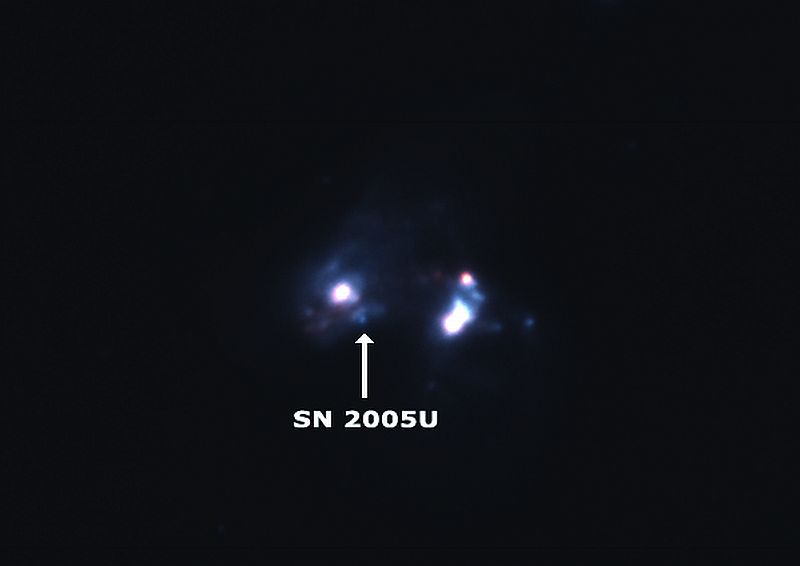
Later observations with LIRIS in 2005 produced discoveries of subsequently
confirmed SN events in the interacting luminous infrared galaxy Arp 299 (distance
~45 Mpc) and in the nearby starburst galaxy NGC 2146 (distance ~13 Mpc). Both
Arp 299 and NGC 2146 have high expected CCSN rates of ~1–2 and ~0.2
SNe per year, respectively, as indicated by their far-IR luminosities. SN
2005U with Ks=16.2 was discovered 1.3 kpc from the Ks-band
nucleus A of Arp 299 and it was classified as a type II SN. The near-IR colour
estimated from the LIRIS images gave an extinction of AV~4.
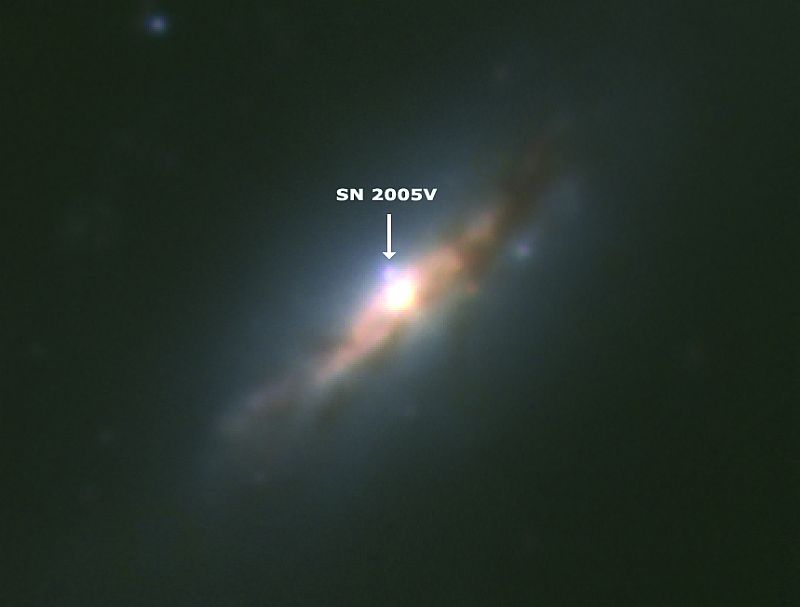
SN 2005V was also discovered by LIRIS on the same night. It had a magnitude
of Ks=13.8 and it was located 330 pc from the Ks-band nucleus
of NGC 2146. It was spectroscopically classified as a type Ib/c SN, about
1–2 weeks past maximum brightness. The near-IR colours from LIRIS indicated
an extinction of AV~3–4 towards SN 2005V.
A Dark Hydrogen Cloud in the Virgo Cluster
Simulations of cold dark matter models predict far more dark matter halos than are observed as galaxies. For this reason, it has been hypothesized that there must exist dark matter halos that contain no stars. The advent of neutral hydrogen multibeam systems has allowed surveys of large areas of sky to be carried out with much higher sensitivity than has been possible in the past, thus allowing sources to be detected by their gas content alone rather than their stars and opening up the possibility of finding truly isolated clouds of extragalactic gas with no stars.A recent deep neutral hydrogen survey of the Virgo Cluster (VIRGOHI) using the multibeam system on the Lovell Telescope has covered 32 deg2 and detected 31 sources, of which one of them, VIRGOHI 21, does not have an optical counterpart. There have been several previous claims of the detection of isolated clouds of extragalactic gas with no stars in them, but subsequent analyses have either revealed the optical counterparts or shown that the gas is mereley debris from nearby visible galaxies. Many other detections of HI clouds have been associated with nearby optically bright galaxies, but VIRGOHI 21 cannot be so easily explained.
Following detection, VIRGOHI 21 was observed at the Arecibo Telescope and the Very Large Array (VLA). From the HI flux astronomers calculated an HI mass of 108Msolar and a velocity width of ΔV20=220km s-1. From the speed it is spinning VIRGOHI 21 is a thousand times more massive that could be accounted for by the observed hydrogen atoms alone, and from the Tully-Fisher relation, a galaxy with this velocity width would be expected to be 12 mag or brighter.
Deep optical CCD images in B, r', and i' bands with the INT were obtained, reaching surface brightness limits of 27.5, ~27.0 and 25.8 mag arcsec-2 respectively. On the B-band frame, an object of 10" scale or larger at this surface brightness limit should have been detected. This is more than 100 times dimmer than the central surface brightness of the disks of typical spiral galaxies and dimmer than any known massive low surface brightness galaxy or than the lowest surface brightness dwarf galaxy.
 |
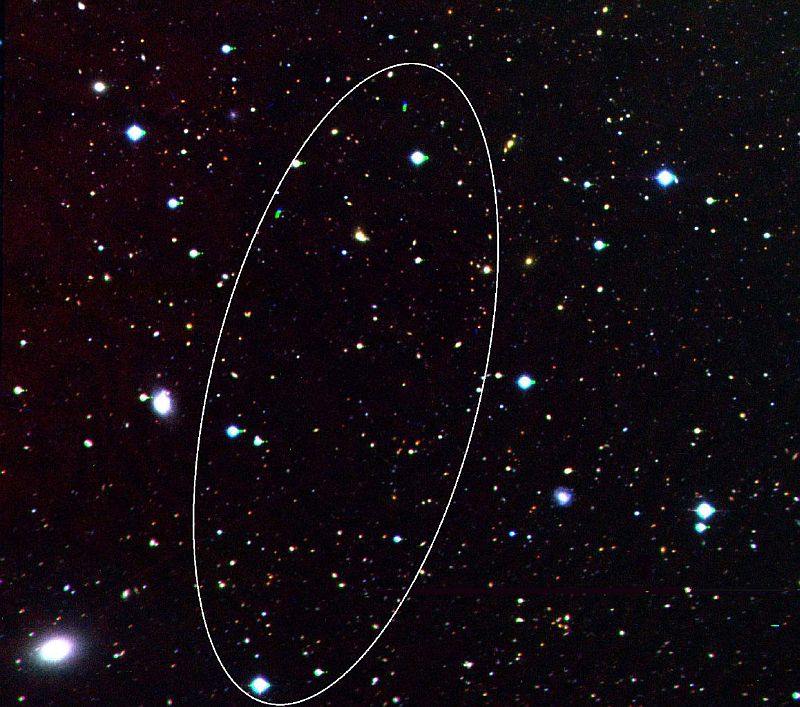 |
The members of the discovery team conclude that in the very nature of things it would be difficult to make an indisputable claim to have found a dark galaxy, particularly when past claims to that effect have quickly been ruled out by subsequent observations (either of a dim underlying galaxy or of bridging connections to nearby visible companions). Nevertheless, VIRGOHI 21 passed all of the careful tests the astronomers were able to set for it, using the best equipment currently available.
Dark galaxies are thought to form when the density of matter in a galaxy is too low to create the conditions for star formation. The observations of VIRGOHI 21 may have other explanations, but they are consistent with the hydrogen being in a flat disc of rotating material, which is what is seen in ordinary spiral galaxies.
Most of the Growth of Supermassive Black Holes is Obscured by Dust
Supermassive black holes underwent periods of exponential growth during which we see them as quasars in the distant Universe. Quasars are some of the brightest objects in the Universe and are seen by the light emitted as gas and dust spiral into the black hole. They are situated in the inner-most regions of galaxies and can consume the equivalent mass of between ten and a thousand stars in one year. It is believed that all quasars are surrounded by a dusty ring which hides them from sight on Earth in about half of cases.The summed emission from these quasars generates the cosmic X-ray background, the spectrum of which has been used to argue that most black-hole growth is obscured. There are clear examples of obscured black-hole growth in the form of 'type 2' quasars, but their numbers are fewer than expected from modelling of the X-ray background. Objects surrounded by dust are hard to see in visible light, so the astronomers looked at infrared wavelengths. Using NASA's Spitzer Space Telescope data, they selected objects that have mid-infrared and radio emissions characteristic of quasars, but which are faint at near-infrared and optical wavelengths.
The researchers found 21 examples of lost quasars in a relatively small patch of sky. All of the objects were confirmed as quasars in radio wavelengths and using the ISIS spectrograph on the WHT. This new population of obscured quasars are hidden behind the dust of the galaxy itself rather than just by a dust ring. The presence of lots of dust in a galaxy indicates that stars are still forming there.
Therefore, this population of distant type-2 quasars, which is at least comparable in size to the well-known unobscured type-1 population, is responsible for most of the black-hole growth in the young Universe and, throughout cosmic history, black-hole growth has been concentrated in the dusty, gas-rich centres of active galaxies. This is in good agreement with predictions from the X-ray background and implies, from comparisons between the integrated luminosity density of quasars (both type-1 and type-2) and the local space density of relic black holes, that black-hole growth occurs in short, efficient spurts in the cores of forming galaxies.
The INT/WFC Survey of the Monoceros Ring
The formation and evolution of galaxies remains one of the big questions in astronomy. In the currently favoured Ω cold dark matter model (ΩCDM), galaxies are built up over time via accretion of smaller systems. One firm prediction of this model is that this accretion of smaller systems should still be ongoing and that the Milky Way halo should contain a large number of satellite systems. It has been suggested that, given the model, there are too few satellites actually within the Milky Way halo.The tidal dismemberment of a dwarf galaxy as it falls through the Milky Way halo is a slow process, with extensive streams of tidal debris existing for long periods of time. While ancient remnants have been identified in our own Galactic neighbourhood, more extensive surveys of the Galactic halo have concluded that there is only a single, major ongoing accretion event, that of the Sagittarius dwarf galaxy. While this accretion event is adding mass to the Galactic halo and provides an important probe of the shape of the dark matter potential, the lack of other major accretion events is somewhat disconcerting given the predictions from the ΩCDM.
The recently discovered Monoceros Ring (MRi, or the One Ring) can be interpreted as an additional ongoing accretion event within the Milky Way. Investigating the density and extent of this structure is important when trying to fully understand the impact this type of event is having on the evolution of our Galaxy both in the past and into the future. If the MRi is instead the outermost edge of the Milky Way, mapping the outer reaches of the disc will provide insight into the past of the Milky Way.
Astronomers used the INT Wide Field Camera to continue a campaign to detect this stellar population around the Galactic plane, mapping out the extent of the MRi in the region of Galactic longitudes l=61°–150° with 10 pointings in symmetric pairs above and below the plane of the Galaxy spanning 90° about the equator of the Milky Way.
This ongoing survey has yielded three detections of the ring in the region l, b= (118°, 16°), (150°, 15°) and a tentative detection at (150°, -15°). Galactocentric distance estimates to these structures gave ~17, ~17 and ~ 13 kpc, respectively. These are combined with a re-examination of the field observed with the INT WFC in 2003, (123°, -19°), showing the position of the halo is not in accordance with the model and possibly represents another detection of the ring. The Galactocentric distance to this feature is estimated at ~21 kpc. This provides evidence that the ring may be wrapped around the Galaxy more than once.
These detections also lie very close to the newly discovered structure in Triangulum-Andromedae hinting at a link between the two. The remaining six observed fields are apparently non-detections although in light of the new models, closer inspection reveals tentative structure.
With the overdensity of M giant stars in Canis Major being claimed both as a progenitor to the MRi and alternatively a manifestation of the Milky Way warp, much is still unknown concerning this structure and its connection to the MRi.
Both detections and non-detections support a complex picture of the MRi. In particular, those detections above the plane suggest the MRi has an extended stream tracing an arc ~17 kpc from the Galactic Centre, while the detections below the plane, reveal a tentative detection of the Triangulum-Andromedae region in the background of the (123°, -19°) region and also the presence of a foreground stream. Lying roughly in the plane of the Milky Way, the MRi may represent a unique equatorial accretion event which is contributing to the thick disc of the Galaxy, or alternatively, the MRi may be a natural part of the disc formation process.
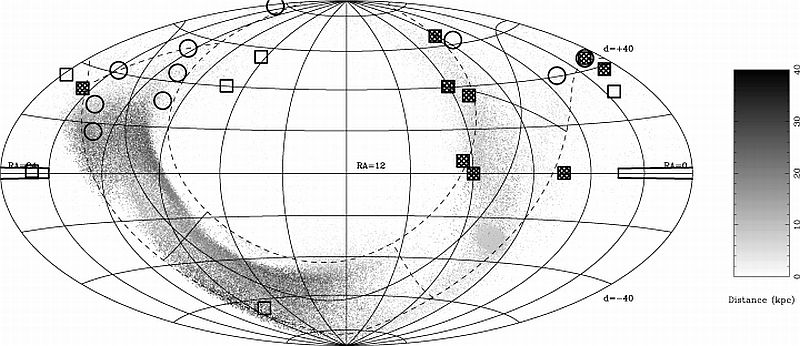 |
Figure 30. Aitoff projection of
the sky, illustrating the locations of the fields obtained for this
current survey. The projection is in equatorial coordinates, with
the Milky Way equator (b= 0°) shown as a solid black curve accompanied
by the dashed curves which mark out Galactic latitudes of b=±20°.
The Galactic Centre (l= 0°) and anticentre (l= 180°) are shown
as solid bars crossing the Galactic equator. The points represent
the prograde model for the destruction of the Canis Major dwarf with
the grey-scale showing the Galactocentric distance (kpc) of the points,
as shown in the side bar. The dense knot located below the Galactic
equator represents the final location of the progenitor used in the
simulation. The symbols in the plot are represented as follows: the
circles represent the location of the fields in this survey; the squares
represent the fields associated with the M31 survey, with the hashed
squares being confirmed detections of the ring and empty squares being
non-detections [ JPEG | TIFF
]. |
| Top | Back |
|
