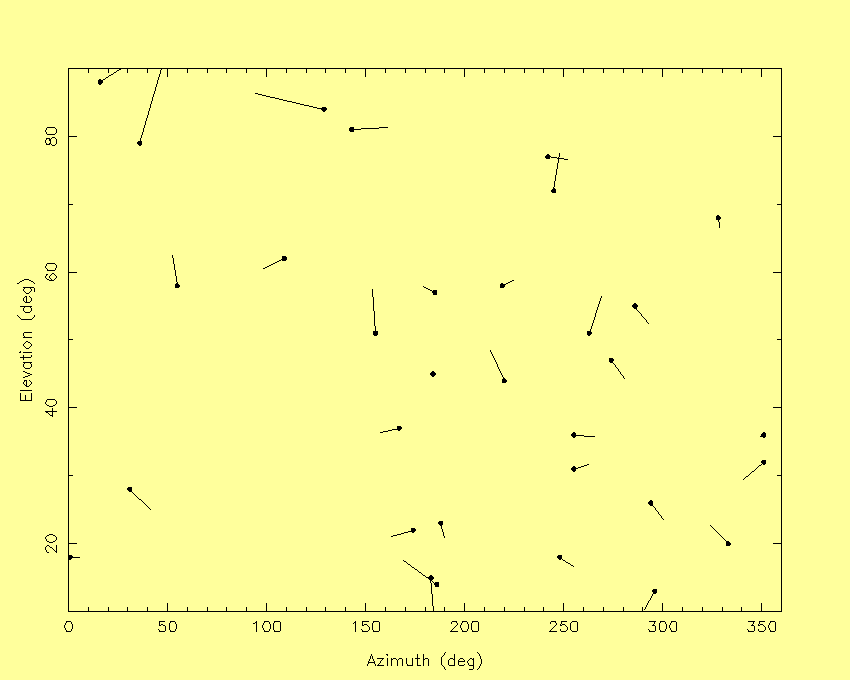
WHT tracking
Without autoguiding (i.e. open-loop), the WHT typically tracks with accuracy
~ 1 arcsec per 10 minutes in both azimuth and elevation.
On at least this timescale, the drift is steady and monotonic.

The vectors on the above plot indicate the measured direction and size of drift when
open-loop tracking, as a function of star azimuth and elevation.
A vector whose plotted length equals the separation of 10-deg ticks on the elevation axis
indicates a measured drift rate of 10 arcsec per 30 minutes (i.e. 3.3 arcsec per
10 minutes).
The median drift is 1.1 arcsec per 10 minutes.
There's no evidence of a dependence on azimuth or elevation, except that
tracking is significantly poorer at the highest
elevations (>~ 80 deg), where tracking in azimuth is more rapid.
(A movement of 1 arcsec on the sky, in the azimuth direction,
corresponds to a change in telescope azimuth of 1 / (cos(elevation)) arcsec.)
The plotted measurements were made in 2014 - 2016
(usually when conditions
were unsuitable for science observing, or for other tests), by
monitoring the open-loop movement of a star on the acquisition camera or autoguider.
The raw data are reproduced below, together with earlier measurements
made during 1991 - 2006.
Measured tracking drifts
Columns 2 and 3 give the azimuth and elevation being tracked
(without autoguiding), column 4 is the time spent tracking,
and columns 5 and 6 give the adjustment in azimuth
(arcsec on sky) and elevation required
after that time to bring the star back to its original position
on the camera. The data for each night are in order of increasing elevation.
   Date       AZ   EL   Time       DAZ   DEL
yyyy mm dd   deg  deg   mins        "     "
   (1)       (2)  (3)   (4)        (5)   (6)

2016 01 31   296   13    12        0.6   1.1
2016 01 31   351   36    12        0.2   0.1
2016 01 31   274   47    16       -1.0   1.4
2016 01 31   242   77    16       -1.5   0.2

2016 01 30   186   14    13        2.1  -1.5
2016 01 30   174   22    16        1.7   0.5
2016 01 30   167   37    13        1.2   0.3
2016 01 30   220   44    18        1.2  -2.7
2016 01 30   155   51    13        0.2  -2.8
2016 01 30   328   68    16       -0.1   0.8
2016 01 30    36   79    12       -1.8  -6.2

2016 01 29   263   51    10       -0.6  -1.8

2016 01 22   183   15    11       -0.2   2.4
2016 01 22   248   18    13       -0.9   0.6
2016 01 22   333   20    12        1.0  -1.1
2016 01 22   188   23    10       -0.2   0.7
2016 01 22   351   32    12        1.2   1.0
2016 01 22   255   36    11       -1.1   0.1
2016 01 22   184   45    16        0.0   0.0
2016 01 22   219   58    11       -0.6  -0.3
2016 01 22   245   72    11       -0.3  -2.0
2016 01 22   143   81    11       -1.9  -0.1

2014 05 19    01   18    14       -0.6   0.0
2014 05 19   294   26    16       -1.0   1.3
2014 05 19    31   28    10       -1.0   1.0
2014 05 19   255   31    10       -0.7  -0.2
2014 05 19   286   55    23       -1.5   2.0
2014 05 19   185   57    13        0.7  -0.4
2014 05 19    55   58    12        0.3  -1.8
2014 05 19   109   62    10        1.0   0.5
2014 05 19   129   84    13        4.3  -1.0
2014 05 19    16   88     7      -11.0  -7.0  close to zenith blind spot

2006 05 12   191   58    15        1.4   1.5
2006 05 12   197   68    15        0.4   1.4

2006 05 10         29    15        0.1  -0.8
2006 05 10         66    15        0.0  -1.9

2005 11 20    21   58    15        1.3   2.3

2005 09       32   66    30        0.0   1.4

1999 09 24   170   30    15        0.4   0.9
1999 09 24   170   40    25        0.8   1.6
1999 09 24   150   50    20        0.0   2.9
1999 09 24   180   50    20        0.2   1.4
1999 09 24   200   60    20      < 0.3 < 0.3
1999 09 24   180   80    35        2.4   3.0

1998 01 15         hi    15        ~ 3   ~ 3

1991 01 23        ~60    30        < 1   < 1
1991 01 23        ~60    30        < 1   < 1
For the measurements prior to 2007, the signs
of DAZ and DEL were not always recorded.

