ISIS Blue Arm
The default CCD on the blue arm of ISIS is a
thinned, blue-sensitive EEV12 array of 2048×4096 13.5µ
micron pixels.
- General information on the device
- Biases and the overscan region
- Wavelength coverage and spectral resolution
- Spatial scale
- Fringing and cosmetic defects
- Linearity measurements
- Shutter effect
- Charge spreading and its effect on resolution
- Flux standard data and empirical through-puts
- Quality control history
- Bad pixel masks
- Atlas of arc lines in the blue arm
Biases and the overscan region
The EEV12 detector bias frames can be characterised as B(x,y,t) = f(x,y) + g(t), where f(x,y) represents the quasi-fixed pattern of pixel-to-pixel variation, and g(t) represents
the variation of the mean (over x,y) bias level with time. The time variability typically amounts to up to ~10-20 counts on the timescale of hours and days, and depends on environmental factors such as CCD and controller-electronics temperatures.
The quasi-fixed pattern function f(x,y) is measured from the median of the usual afternoon bias frames, and the time-variation function g(t) is measured from the overscan region of the detector
from each science observation.
The overscan strip of the EEV12 detector extends over rows 4105 to 4190, and is defined in the FITS headers by the usual BIASSEC keyword.
Wavelength coverage and spectral resolution
The table below gives the dispersion provided by
each grating when mounted blaze to collimator (see the
ISIS
manual for more detailed information on gratings and their properties),
and the spectral range covered by the EEV12 CCD. The EEV12 is mounted on
the blue arm with its 4096-pixel axis along the dispersion direction,
giving maximum utility of the beam width leaving the camera. However, the camera
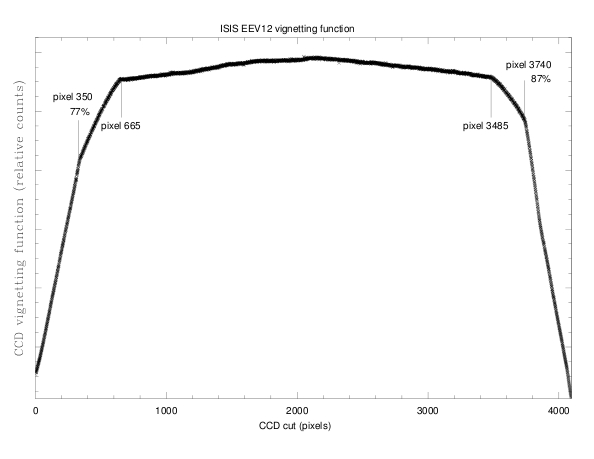
optics vignette the outer regions of the dispersed light beam such that
approximately 600 pixels at either end of the CCD are vignetted.
A plot of the CCD vignetting function across the chip
is shown below to illustrate this effect. This function was measured in May
2011 from a flat-field exposure corrected by CCD quantum efficiency, grating
efficiency and tungsten lamp spectral emissivity functions. The unvignetted
region is from (spectral) pixel 665 to 3485, which is essentially the central 2820 pixels,
and both the unvignetted and 50% vignetted spectral ranges in Å are given in the table below.
The dispersions of the blue-arm gratings in Å/mm are 120 (R158B), 64 (R300B), 33 (R600B), 17 (R1200B) and 8 (H2400B). The pixel size of the EEV12 detector is 13.5µ, and the corresponding grating dispersions in Å/pixel are listed in the table, as are the slit widths that project to four pixels (54µ) with the gratings set at blaze. The spectral resolution elements, Δλ, in Å for a 1-arcsec slit are also listed. The corresponding nominal spectral resolutions, λ/Δλ, at 4000Å with a 1-arcec slit are approximately 512 (R158B), 976 (R300B), 1980 (R600B), 4706 (R1200B) and 11429 (H2400B). These values exclude the impact of
diffusion of charge
between pixels, which
degrades resolution by at least 10% for wavelengths ≲6000Å.
Note that the slit width projecting to four pixels increases with grating resolution. This is due to grating anamorphic de-magnification, which is parameterised by
cos(θ+φ/2)/cos(θ-φ/2), where θ is the grating tilt with respect to zero order and φ is the camera-collimator angle. This relation demonstrates why the slit size projecting to four pixels is larger for the higher resolution gratings; they are set to larger tilt angles for a given central wavelength, and so their de-magnification is greater.
See here for a discussion of this effect.
ISIS wavelength coverage and resolution with EEV12 |
Grating |
Blaze |
Total Spectral range (Å) |
Unvignetted range 2820 pixels (Å) |
50% unvignetted range 3670 pixels (Å) |
Dispersion (Å/pix) |
Slit-width for 54µ at detector (arcsecs) |
Resol. element with a 1" slit (Å) |
R158B |
3600 |
6635 |
4568 |
5944 |
1.62 |
0.83 |
7.81 |
R300B |
4000 |
3539 |
2436 |
3170 |
0.86 |
0.84 |
4.10 |
R600B |
3900 |
1825 |
1256 |
1636 |
0.45 |
0.89 |
2.02 |
R1200B |
4000 |
940 |
646 |
842 |
0.23 |
1.08 |
0.85 |
H2400B |
Holo |
442 |
304 |
396 |
0.11 |
1.24 |
0.35 |
According to sampling theory a line as recorded on the detector is fully sampled if
it has at least two
dispersion elements across its FWHM, and so the detector oversamples the
resolution element when the slit width is set to 1-arcsec (e.g., to approximately
match seeing). In this configuration the detector can be binned ×2 spectrally to
increase the signal-to-noise in each wavelength bin, without
loss of spectral resolution. This can also be done at the reduction
stage, but binning on-chip reduces the readout noise contribution to the
resolution element.
It is also possible of course to improve spectral resolution by reducing
the slit width. This increases slit losses especially in moderate seeing, and in any case the slit should project to at least two pixels so that the resolution element remains fully sampled by the detector.
The H2400 grating vignettes significantly at ''redder'' central wavelengths because of its high inclination to the collimator in longer-wavelength settings, e.g., by ~20% at 5000Å, ~45% at 6000Å and ~100% at 7000Å.
Spatial scale
The blue (and red) camera is a folded Schmidt design of focal length 500mm and gives
a scale of 14.9 arcsec/mm at the detector. Hence the spatial scale
with the EEV12 is 0.20 arcsec/pixel. It is possible to bin in the spatial
direction if one is not concerned with high spatial resolution observations;
indeed the seeing conditions need to be excellent to allow full advantage
to be taken of using an unbinned chip with this pixel scale. The maximum
unvignetted slit-length usable with ISIS is 3.7 arcmin, corresponding to
1110 spatial detector pixels, in a window [513:1622,1:4200], centred on
the standard window.
Fringing and cosmetic defects
These thinned chips suffer severely from fringing in the red part of the
spectrum, which limits their usefulness in this region despite their continued
good QE down to 8000 Å. Click here to see an
illustrative
flat field spectra. The following figures are illustrative:
Wavelength Peak-to-Peak Amplitude
6500Å                 5%
7000Å                 15%
7500Å                 30%
8000Å                 50%
8500Å                 60%
9000Å                 60-70%
There are a few cosmetic defects on the surface of the chip, but nothing
particularly severe.
Linearity measurements
A linearity test in standard readout mode with no binning showed the chip to be linear
to better than 1% up to just over 60,000 ADU.
Shutter effect
The Prontor shutter opens the aperture radially symmetrically.
The count levels on a series of exposures with requested integration times
2, 1, 0.5, 0.25, 0.13, 0.06, and 0.03 sec suggest that the overhead for
opening and closing the shutter is ~ 0.04 - 0.05 sec. An exposure of 0.03 s yields
fewer counts, probably due to the shutter not being fully opened. If an exposure time of
0.01 sec is requested, the exposure fails. To clear the error state the DAS should be reset using the
dasreset command.
For observations of spectrophotometric standards we recommend a minimum
exposure of two seconds.
Charge spreading and its effect on resolution
The diffusion of charge between pixels during integrations degrades
both the spatial and spectral resolutions.
For a back illuminated CCD this charge diffusion
becomes progressively
worse for shorter-wavelength incident light;
as wavelength decreases, absorption of photons occurs closer to the surface of the CCD where the pixel potential wells are less-well defined.
Photoelectrons generated closer to the surface have a greater tendency to diffuse into the wells of neighbouring pixels, thereby degrading resolution in both the spectral and
spatial directions.
In the spectral direction, using a slit-width
projecting to 2 pixels on the detector results in a measured FWHM of 2.4
pixels at wavelength λ~4000Å when the spectrograph is at best focus.
Similarly a slit-width projecting to 4 detector pixels will produce a FWHM
of ~4.4 pixels, again at λ~4000Å. This effect becomes less severe
towards redder wavelengths and is negligible at around 6000Å.
The FWHM of the spatial profile in median seeing is similarly broadened from
~4 to ~4.4 pixels by charge diffusion. Note that the combination of charge diffusion and the
λ-0.2 dependence of seeing means the spatial profile
in the blue arm can be broader than in the red arm by several tenths
of an arcsec at widely-spaced wavelengths, at optimum telescope focus.
Flux standard data and empirical throughput
The figure below shows the results from throughput measurements
of flux standards using the EEV12 detector. The Y-axis is the apparent AB magnitude of star observed
at zenith which gives one detected photon per second per Angstrom. The lowest resolution grating was used (R158B) in the blue arm (without
a dichroic) with a wide slit (10
arcsec). The conditions were photometric, with negligible dust levels present.
This figure shows the response of the whole ISIS blue channel
(i.e. WHT primary + secondary + ISIS blue optics + detector response) from
~3200 to ~8300Å.
Quality control history
The figure below shows historical results from several throughput measurements
of flux standards in both the blue and the red arms, with past generations of detectors. The Y-axis is the apparent AB magnitude of star observed
at zenith which gives one detected photon per second per Angstrom. In each
case the lowest resolution grating was used (R158B) in the blue arm (without
a dichroic) with a wide slit (10
arcsec). In each case, the conditions were photometric, with negligible dust levels present.
Bad pixel masks
Bad pixel masks for EEV12 with different binning were created using
noao.imred.ccdred task in IRAF. All masks are created for the default CCD
window [585:1550,1:4200].
bad pixel mask bin 1 1
bad pixel mask bin 1 2
bad pixel mask bin 2 1
bad pixel mask bin 2 2
bad pixel mask bin 3 1
bad pixel mask bin 3 2
bad pixel mask bin 4 1
bad pixel mask bin 4 2
Atlas of arc lines in the blue arm
An atlas of arc lines for a range of central wavelengths of the blue arm gratings is available
here.


