 | |||
|

| Home > Public Information > Scientific Highlights > 2000 |
|
in 2000* *Astronomical discoveries following from observations carried out with the ING telescopes. The report presented here is a preliminary version. [ SOLAR SYSTEM | STARS | EXTRAGALACTIC | OBSERVATIONAL COSMOLOGY | OTHER SCIENTIFIC HIGHLIGHTS BRIEFLY ] The following presents a selection of highlights, intended to be representative of the scientific quality and range of research being undertaken. |
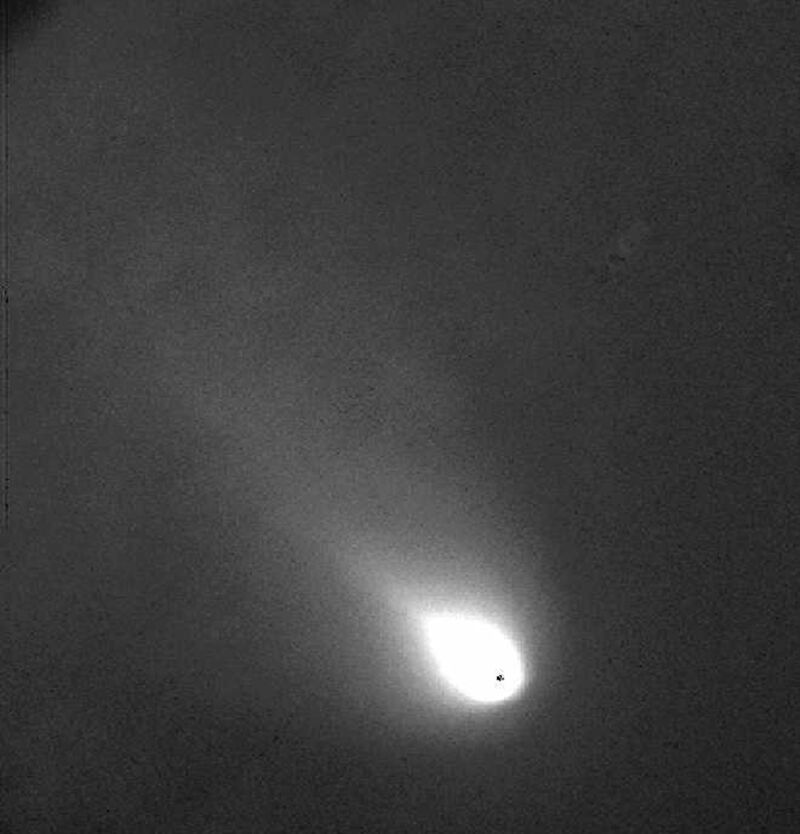
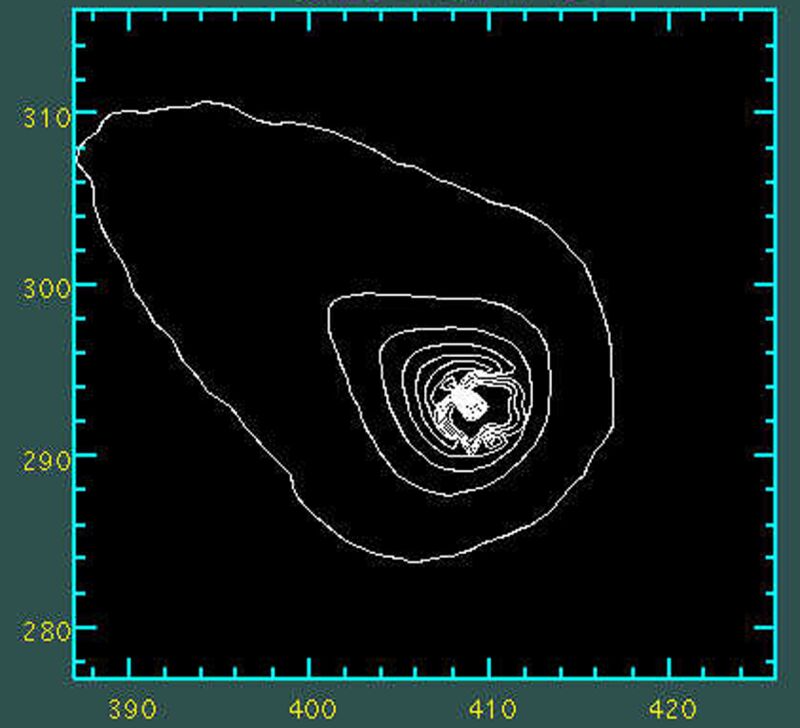
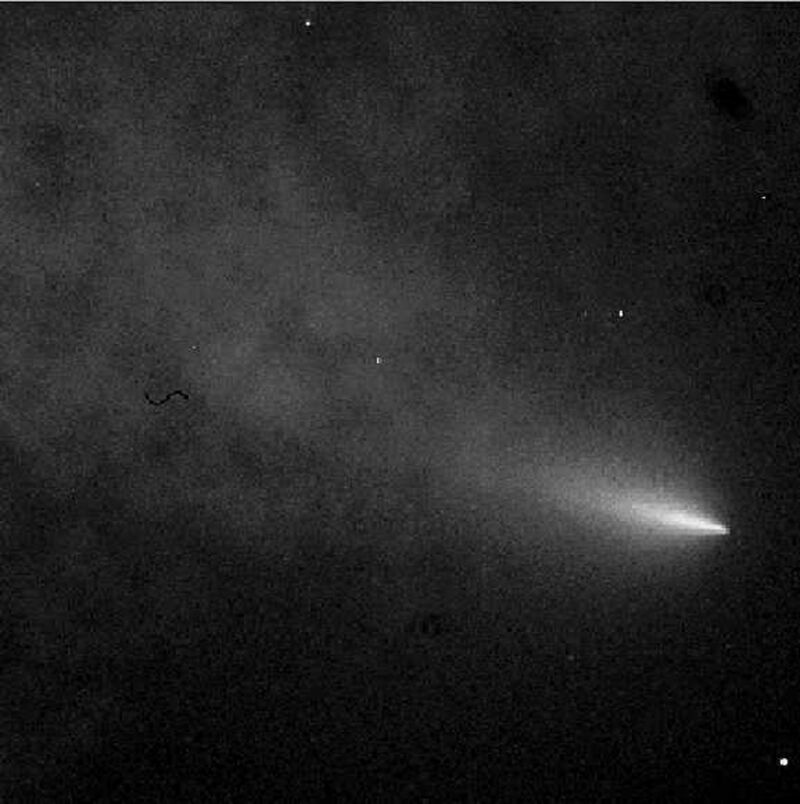
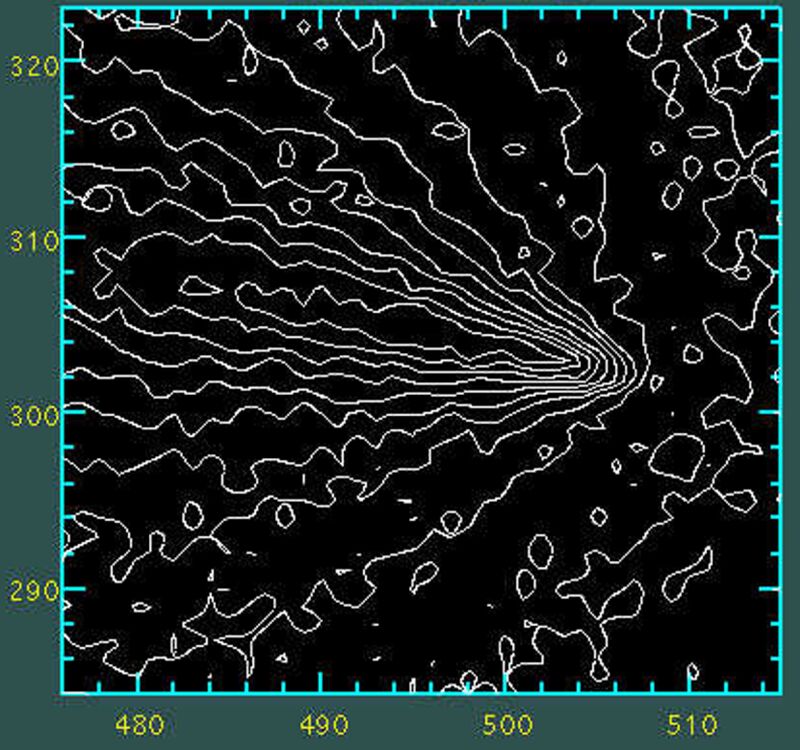
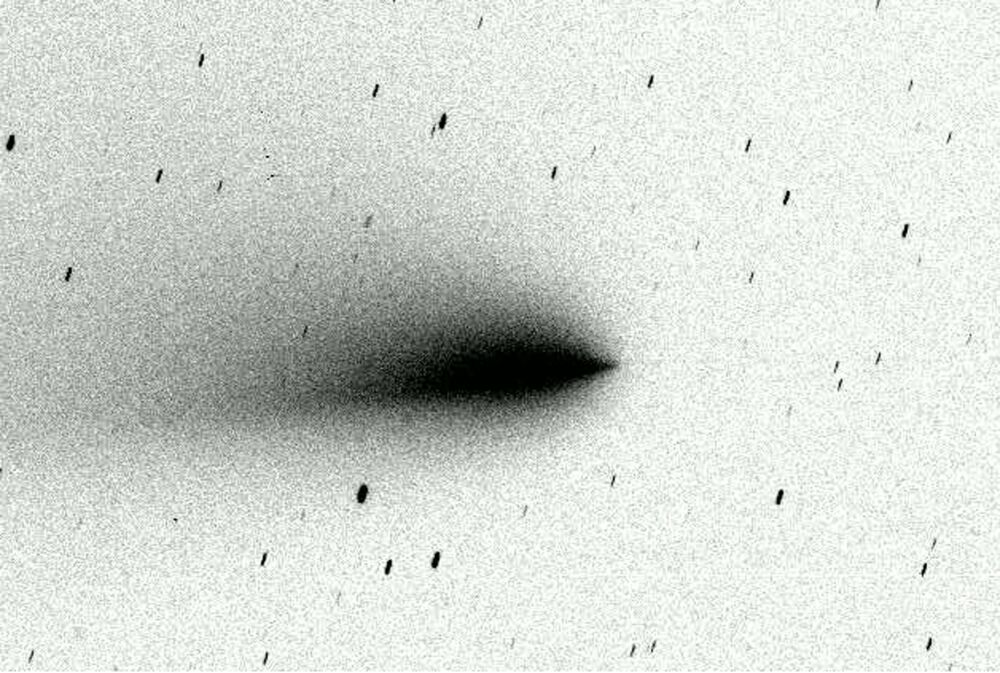
COMET LINEAR BLOWS UP IN FULL VIEW OF THE JKT JKT+CCD, INT+WFC Nightly observations made since July 23 in different broadband filters with the Jacobus Kapteyn Telescope showed what appears to be the complete disruption of the nucleus of comet LINEAR, the brightest comet of the year. The central condensation was highly condensed and showed the typical 'teardrop' form in the evening of July 23rd and July 24th, although its brightness decreased by a factor of about 3 between the two nights. In the evening of July 25th something very odd was happening to the comet: the central condensation was seen to be strongly elongated, with a very flat brightness distribution. The condensation's brightness faded further and its length increased on the following nights. On July 27 there was no evidence of any local brightness peaks that would indicate the presence of sub-nuclei. In other words, it
did not appear to have broken into individual fragments in the way that
Comet Shoemaker-Levy 9 did in 1993. Instead, it had completely blown apart.
The expansion velocity of the condensation was about 40 m/s, indicating
that it was solid particles and not gas. The gas tail, which virtually
had disappeared between July 23rd and 24th, had reformed as an extension
of the major axis of the central condensation.
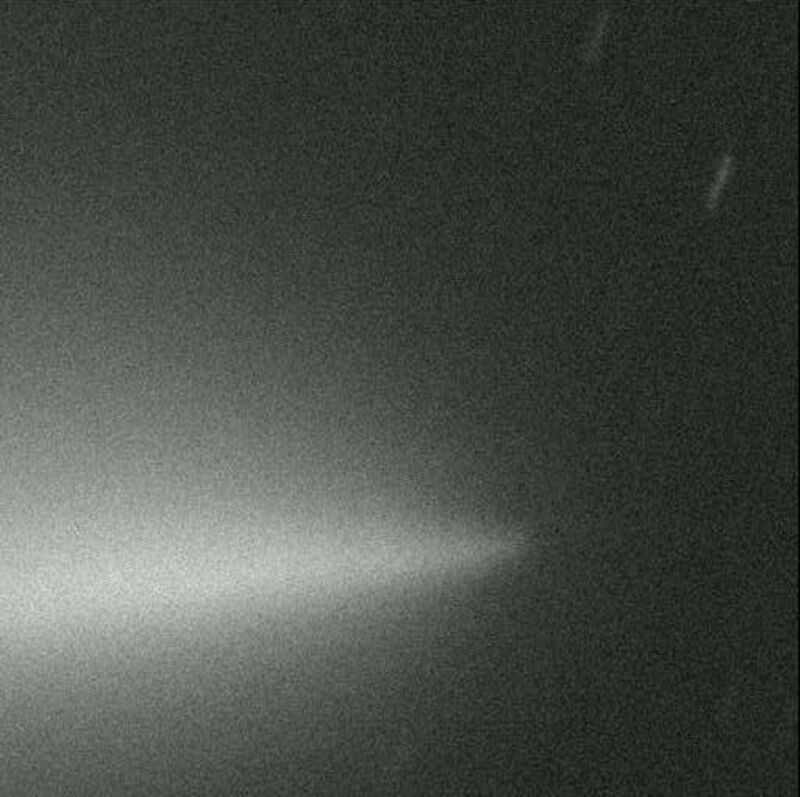
Further observations with the Isaac Newton Telescope confirmed the initial discovery and provided new insight into what the reason for the comet disruption could be: the evaporation of all the ice in the nucleus. Cometary nuclei are a mixture of solid lumps of material of various sizes, held together by a cement of ices. When comets pass close to the Sun during their journey across the solar system the icy elements (mainly water ice and carbon monoxide ice) sublime, leaving loose material behind that forms the dust tail of the comet, while the sublimed ice forms its gas tails. As a result of this process, or due to the strong gravitational pull from a planet such as Jupiter, or from the Sun, a comet nucleus may sometimes split into two or more fragments. What was seen in the case of Comet LINEAR, however, was different. From analysis of the images astronomers concluded that this small comet probably ran out of ice altogether, leaving behind a loose conglomerate of particles that gradually dispersed into space. This model fitted the observations well, as measurements shown that the activity of the comet had been declining for several weeks as ice gradually sublimed away. During the comet's closest approach to the Sun, a burst of activity was recorded. Then, when all the ice was exhausted and nothing was holding together the solids, the nucleus began to fall apart. The images taken
with the Isaac Newton Telescope after break-up showed no sign of the comet's
original nucleus, nor of any active sub-nuclei larger than a few metres
across. Any large remnants of the nucleus that remained cannot be subliming
significantly or they would have been detected in these images. Other comets
are known to have disappeared, but Comet LINEAR is the first one to have
been caught in the act.
Some references:
|
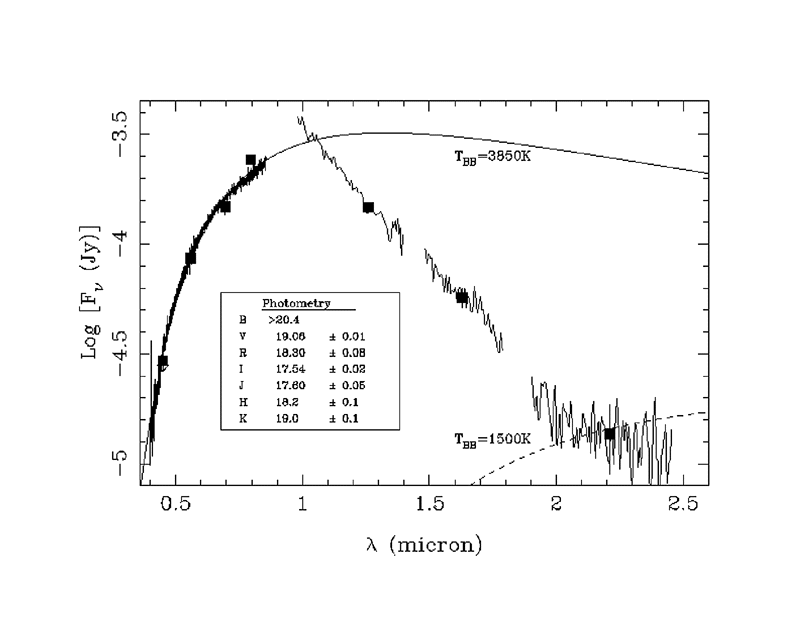
DISCOVERY OF A TYPE IA SUPERNOVA PROGENITOR INT+IDS Type Ia supernovae (SNe Ia) are one of the most important tools for observational cosmology because there appears to be a relatively small spread in their peak optical brightness and they can be seen out to cosmological distances so they can be used to measure cosmological parameters. However, the peak optical brightnesses of SNe Ia are not uniform; they are correlated with the shape of the light curve. Meaningful measurements of cosmological parameters require this variation to be calibrated. The corrections to peak brightnesses have to be empirical because it is still not yet clear what causes SNe Ia. All the most likely models for progenitors of SNe Ia feature an accreting white dwarf which ignites carbon in its core either because it has reached the Chandrasekhar mass or because ignition of accumulated helium causes compression of the core and a so-called 'edge-lit detonation'. This explains the fast rise times for SNeIa, the lack of hydrogen and helium and the fairly uniform peak brightness. To initiate the explosion, the white dwarf must accrete material from a companion star. Two models for the companion star which have gained popularity in recent times are supersoft sources and double degenerates. However, the possibility of a helium star companion to a white dwarf has not been widely considered as a source of SNe Ia. In particular, sub-dwarf B (sdB) star binaries might be good candidates. There are many white dwarfs which are known to begaining mass from a normal star, but these are made of hydrogen which causes a series of small explosions before the Chandresekhar limit is reached. This is what causes a nova explosion. To make a supernova, the white dwarf has to be supplied with helium, which explodes less easily but releases much more energy. KPD1930+2752 is a sdB star. It is about one fifth the size of the Sun and is about half as massive. Unlike normal stars, which are composed almost entirely of hydrogen, KPD1930+2752 is made of helium. It is not entirely clear how sdB stars are made, but recent work suggests they are the remains of stars like the Sun which lose half their mass just before they complete the end of the red giant phase of their evolution. Only some small fraction of stars evolve this way and this is thought to be related to the fact that most sdB stars are binary stars. KPD1930+2752 was observed with the INT as part of a programme to study sdB stars to understand how they are formed. The Doppler shift shows that the star is orbiting an unseen companion every 137 minutes at a speed of 350 km/s. The unseen companion has almost the same mass as the Sun, but it is much smaller and fainter. The unseen companion star could be a neutron star or blackhole, but it is much more likely to be a white dwarf star. When binary stars have orbital periods as short as two hours, they produce "gravitational waves" which drain energy from the orbit, so the stars gradually spiral in towards each other. KPD1930+2752 will merge within 200 million years. The white dwarf will then gain extra mass from the sdB star and will exceed the Chandresekhar critical mass. This is thought to lead to a Type Ia supernova explosion. KPD1930+2752 is the first star to be discovered that is a good candidate for the progenitor of a Type Ia supernova of this type, which may explode on an astrophysically interesting time-scale. Some references:
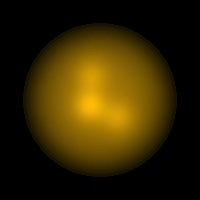
WHT+GHRIL
Most of the earlier images of Betelgeuse, made at wavelengths shorter than 800 nm, have exhibited a small number of bright regions. Astronomers have explained the bright regions as the tops of convection cells - bubbles of hot gas welling up from the interior of the star.
As we look at different wavelengths of light, we see to different depths in cool stars like Betelgeuse. The outer layers of the star are transparent to infrared light. Thus if we look in the infrared, we see a small, featureless star. The outer layers are not transparent to red light, because of absorption by titanium oxide molecules. However, if hot gas rising from below disturbs the outer layers, they become transparent to red as well as infrared light, and bright features are seen on the star, where hotter gas is visible through the "holes" in the outer layers.
Some references:
JKT+CCD, WHT+ISIS White dwarfs are the remnant cores of stars that initially had masses of less than 8 solar masses. They cool gradually over billion of years, and have been suggested to make up much of the 'dark matter' in the halo of the Milky Way. But extremely cool white dwarfs have proved difficult to detect, owing to both their faintness and their anticipated similarity in colour to other classes of dwarf stars. A white dwarf star, named
WD0346+246, was serendipitously discovered as a faint, very fast moving
star on a sequence of photographic plates. The high apparent velocity is
a characteristic of stars which are very old and are traveling on inclined
elliptical orbits around the Galaxy. Astronomers secured parallax measurements
on the Jacobus Kapteyn Telescope to determine the distance to WD0346+246
and confirm its low luminosity. They reported a distance of 28 parsecs.
They also estimated a surface temperature of around 3,500 Kelvin degrees.
Thus WD0346+246 has been shown to be one of the coolest and therefore oldest
white dwarfs ever found, and has to be a member of a hitherto unobserved
and possibly large population of faint stars in the Galactic halo.
This discovery has serious implications for our understanding of the Milky Way. The coolest white dwarfs provide a measurement of the age of the Galaxy. But they may also play a more important role. For the last thirty years, astronomers have found that most of our Galaxy seems to be invisible. In fact, as much as 90% of the mass in our Galaxy may be hidden in the form of 'dark matter'. Dark matter theories fall into two broad classes. The first suggests that the dark matter is not really dark - but is composed of many faint stars such as cool white dwarfs and brown dwarfs. The second class of dark matter candidates are various elementary particles, left over from the big bang. Indirect evidence for the dark matter being comprised of cool white dwarfs first came from the MACHO gravitational microlensing experiment. The MACHO project monitored some ten million stars in the Magellanic Clouds in the hope of detecting the occasional brightening caused by a dark halo object moving across our line of sight to one of the stars. The MACHO results suggest that these stars can be very numerous, and could contribute approximately 50% of the total mass of the Galaxy. The discovery of one nearby, very old and cool white dwarf does not solve the dark matter problem. But it does lend weight to the MACHO scenario, and presents astronomers with an astonishing conclusion: the Galaxy may be full of extremely old white dwarf stars. The race is now on to count how many objects like WD0346+246 exist in the Galaxy and to measure how much they weigh in total. Some references:
|

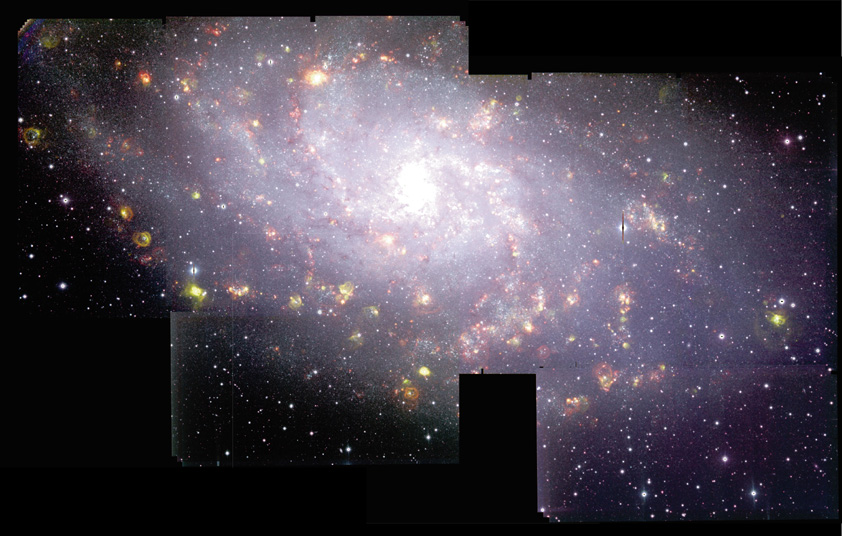
A SEARCH FOR PLANETARY NEBULAE IN M33 INT+WFC Extragalactic planetary
nebulae (PNe) are known in almost all galaxies of the Local Group. Most
of them were discovered in the last decade by means of continuum-subtracted
images in the bright nebular line of [O III]. M33, one of the two other
large spiral galaxies of the Local Group besides the Milky Way, was the
only major nearby galaxy which had not been searched for PNe yet. Astronomers
aimed to fill up this gap taking advantage of new observational capabilities
offered by the Wide Field Camera at the Isaac Newton Telescope. [O III],
H-alpha and continuum images allowed astronomers to detect 134 candidate
PNe in M33 and a large number of other emission line objects (mostly H
II regions).
Some references:
|
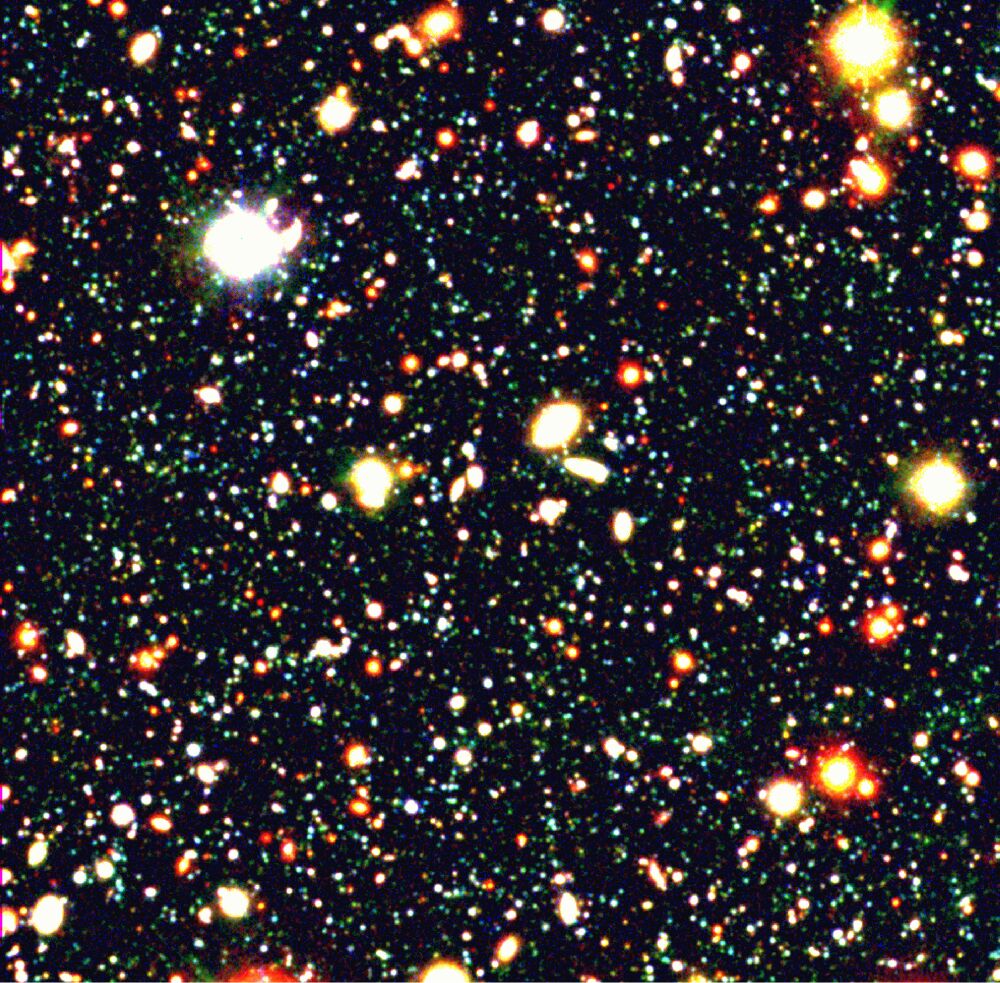
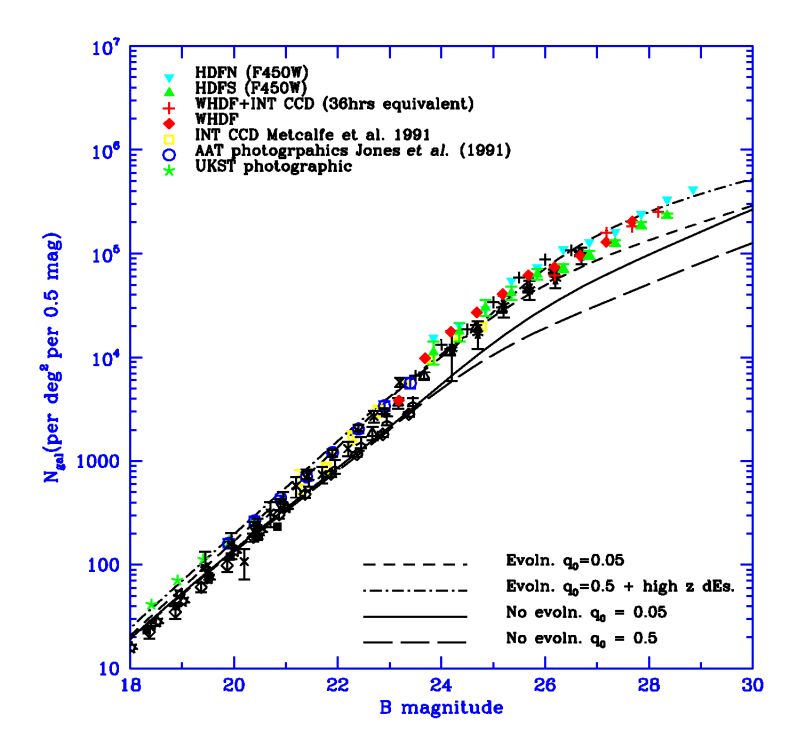
NEW EVIDENCE THAT GALAXIES FORMED EARLY IN THE HISTORY OF THE UNIVERSE WHT+PFC Ultra-deep imaging observations using powerful, ground-based telescopes such as the William Herschel Telescope have the capacity to probe the evolutionary history of galaxies back to their formation epoch. At the faintest galaxy magnitudes, we are looking out not only in distance but back in time to when the Universe was only a few percent of its current age. Over the past few
years, astronomers have used the WHT to produce the deepest ground-based
image of the sky which they have called the William Herschel Deep Field
(WHDF). With exposures of ~30 hrs in U and B, the resulting images reach
magnitudes which are comparable to the Hubble Deep Fields (U~27, B~28)
but covering a five times bigger area of the sky than the two HDFs combined.
For many aspects of the studies of high redshift galaxies, the bigger area of this Herschel Deep Field gives it a unique advantage over HST data. At intermediate redshifts (1<z<3) the larger numbers of galaxies means that they are more easily split into their various sub-populations by their colours. At high redshift, the big area means we have more chance of detecting candidates for galaxies in the redshift range 3<z<7 which are within the magnitude reach of multi-object spectrographs on 810m class telescopes for obtaining spectroscopic confirmation of their photometric redshift. The bigger area also has advantages for studies of high redshift galaxy clustering, aimed at understanding how structure forms in the early Universe. In 1996, the ultraviolet
and blue pictures in the WHDF revealed so many faint blue galaxies at a
redshift of 2 that they already challenged the claims of the most popular
cosmological theory, which suggested that galaxies formed around a redshift
of 1, when the universe was half as a big as it is now. Since then, observations
carried out at other telescopes have confirmed these results by finding
many galaxies at redshifts of 3 and 4. Now, applying similar techniques
as before but to the new red and infra-red images from the WHT, astronomers
find large numbers of galaxies at the even higher redshifts of 5 to 6,
pushing the epoch of formation of giant galaxies back even earlier. There
are as many galaxies at these redshifts as are found locally.
Some references:
|
| Top | Back |
|
