Wide Field Survey: Final Data Products
ING Banner
Home > Public Information > ING Newsletter > No. 9, March 2005 > Wide Field Survey: Final Data Products


ING Newsletter No. 9, March 2005
GENERAL
SCIENCE
TELESCOPES AND INSTRUMENTATION
OTHER NEWS FROM ING
TELESCOPE TIME

Previous: IPHAS: Surveying the Northern Galactic Plane in Hα | Up: Table of Contents | Next: Direct Detection of Giant Exoplanets
Reference: ING Newsl., No. 9, page 8-11.
Article mirrored at: La Palma server | Cambridge server
Other available formats: PDF

Wide Field Survey: Final Data Products

M. Irwin*, R. McMahon, N. Walton, E. González-Solares, S. Hodgkin, J. Irwin, J. Lewis (IoA, Cambridge)

W
e present the final data products from the Wide Field Survey and the online database access to them.

1. The INT Wide Field Survey

Major survey programmes covering a variety of wavelengths are the mainstay of observational astronomy. Recent highlights include the Two Micron All Sky Survey (2MASS) project which has covered the entire sky at a resolution of 4 arcsec in the JHK bands (http://www.ipac.caltech.edu/2mass/) and the Sloan Digital Sky Survey (SDSS; York et al., 2000; http://www.sdss.org/) which covers large areas of the Northern Hemisphere, with the goal of covering one quarter of the sky. These wide area surveys are having a significant impact, both as target selectors for 8m class telescopes and for inherent survey science programmes. The INT WFS provides deeper data than the SDSS covering significant areas of the sky, with many fields being observed by comparable facilities at other wavelengths.

The INT WFS has been using the Wide Field Camera (with a field of view of the order of 0.3deg2) on the 2.5m Isaac Newton Telescope (INT). The survey proposal was approved by the Joint Steering Committee in October 1997 with a subsequent ‘Announcement of Opportunity’ closing in March 1998. The WFS International Review Panel approved three main programmes in the first year with subsequent review and continuation into the following years. The project was initiated in August 1998 with duration of up to five years. The WFS is an umbrella for competitively judged science programmes which were assessed on the usual criteria plus the wider worth of the data set and the management competence of the proposing teams.

Multicolour data have been obtained over several square degrees to a typical depth of ~25 mag (U through Z). Importantly, the data have been publicly accessible by the UK and NL communities from day one, with access to the rest of the world after one year. The processing and calibration (up to object catalogue generation) is the responsibility of the WFS project.

1.1 WFS Programmes

The main science programmes were chosen to provide a wide area survey programme, a more focused but deeper smaller area programme, and a programme to address time variability. In the second period of observations two more programmes were selected.

The INT Wide Angle Survey (WAS; R. McMahon, M. Irwin, N. Walton) is the largest approved programme and includes sub-projects ranging from determination of cosmological parameters (e.g. via SN Type Ia studies) to searches for Solar System objects. It is the umbrella programme for the WFS project and leads coordination with the other programmes on, for instance, field and filter selection to maximise the scientific leverage of the project.
 
The WAS additionally incorporates two distinct science programmes in the summer semesters centred on Virgo and the equatorial strip of the North Galactic Cap: Deep UBVRI Imaging Survey with the WFC (G. Dalton) of four contiguous regions of 10 deg2 to a limiting magnitude of B=26 and I=24.5. It enables the study of the evolution of galaxy clustering as a function of colour at faint magnitudes and provides a catalogue of rich galaxy clusters at intermediate red-shifts. Furthermore, quasars can be detected at z>5. In good seeing, observations of two 5 deg2 fields to U=26 were observed to investigate clustering of Lyman-break galaxies at z>3.
 
The Faint Sky Variability Survey (FSVS; van Paradijs —see http://staff.science.uva.nl/~fsvs/) searched an area of  ~20deg2, studying photometric and astrometric variability on scales of one hour to a year to a magnitude of V=25. Example areas of investigation include: the evolution of specific Galactic populations (e.g. CVs, RR Lyraes, halo AGB stars, brown and white dwarfs, Kuiper Belt objects, sdB stars), the structure of the Galactic halo, statistics of optical transients related to gamma-ray bursts, and deep proper motion studies.

The Local Group Census (N. Walton —see http://www.ing.iac.es/WFS/LGC/) was a deep narrow band (Hα, [OIII], [SII], HeII) image survey of all Local Group (LG) galaxies in the northern hemisphere MV brighter than –14. Old and new emission line populations (e.g.  planetary nebulae (PNe), HII regions, LBVs, symbiotic stars) were the main targets of interest. Complementary broad band data were obtained to enable the study of linkages between stellar populations (e.g. AGB to PNe).

As far as PNe are concerned, the LGC observations have been fully exploited, providing a much more complete view of the PN population of the LG than previously known, especially for dwarf galaxies. Details are presented by Corradi et al. (2003) and in the five refereed papers and many contributions at international conferences published so far (including the invited review in the first workshop entirely dedicated to extragalactic PNe, held in Garching on May 2004). The PNe discovered by the LGC allowed discussion of the use of PNe as luminosity indicators in external galaxies and in the intergalactic space, and form a valuable database for (ongoing) follow-up spectroscopy to determine their physical and chemical properties. This allow us to discuss stellar and galactic evolution over the large range of metallicites covered by the LG galaxies.

An Imaging Programme for the XMM-Newton Serendipitous X-ray Sky Survey (M.G. Watson —see http://www.ast.cam.ac.uk/~xmmssc/data_release/xid_data/) obtained multi-colour optical imaging of ~200 fields drawn from the XMM-Newton Serendipitous X-ray survey programme. The INT data has provided an optical catalogue for ~20,000 X-ray sources over 25deg2.
 
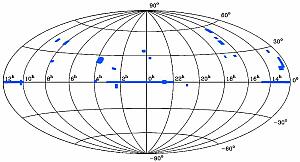
Figure 1
Figure 1. Location of the WFS fields. [ JPEG | TIFF ].

1.2 Pipeline Processing

The WFS data was fully processed by the Cambridge Astronomical Survey Unit (CASU) at the IoA. A detailed description of the pipeline processing carried out is found in (Irwin & Lewis, 2001) and is briefly summarised here. The data is first debiased, bad pixels and columns are flagged and recorded in confidence maps which are used during catalogue generation. The CCDs are found to have significant non linearities so a correction using look-up-tables is applied to all data. Flatfield images in each band are constructed by combining multiple sky flats obtained in bright sky conditions during twilight. Master fringe frames are created by combining all the science exposures for each band and used to correct the images (i' and Z bands only). Finally an astrometric solution is applied which results in an internal astrometric precision better than 100 mas over the whole WFC array. Global systematics are limited by the precision of the APM and PMM astrometric catalogue systems and are at the level of 250mas. The data are photometrically calibrated using a series of Landolt standard stars. Data from non photometric nights are flagged by the pipeline and each area is calibrated using the overlap regions (~10%) between pointings.

Object detection is performed in each band separately using a standard APM-style object detection and parametrisation algorithm. Standard aperture fluxes are measured in a set of apertures of radius r/2, r, 2½r, 2r, 2×2½r where r=3.5 pixels (the median seeing —1 pixel equals 0.333 arcsec) and an automatic aperture correction based on the average curve-of-growth for stellar images is applied to all detected objects.

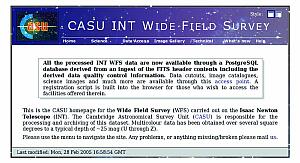
A number of key quality control performance measures are extracted on a nightly basis from the generated object catalogues. These indicators include instrumental information such as sky brightness, image quality (ellipticity, FWHM) and throughputs from extraction of standard star fluxes and comparison with known zero point data. More details about the data products and the format of the catalogues can be found in the CASU web page (Figure 2; http://www.ast.cam.ac.uk/~wfcsur).

Figure 2
Figure 2. INT Wide Field Survey main page at CASU. [ JPEG | TIFF ].

2. Final Data Products

All the processed INT WFS data are available online through a PostgreSQL database derived from an ingest of the FITS header contents including the derived data quality control information. FITS header information, including quality control parameters, are ingested on a regular basis, and a series of flat files point to the processed object catalogues and image data. This has allowed us to offer optional further processing stages driven from a survey Data Quality Control (DQC) database.

The main DQC interface is accessible from the WFS web page at CASU and provides a large number of search options (RA, Dec, run number, object name, observation date,...) and constraints (airmass, exposure time, filters, seeing,...). Figure 3 shows an example query in which the RA and Dec coordinates of a particular object are inserted into the form.

Figure 3
Figure 3. Example query of images in a search box of 20 arcmin around a RA, Dec position. All images observed in the U, g', r' ,i' and Z are requested if the seeing is better than 2'' and they have been observed at an airmass lower than 1.5. No other constraints have been imposed, but the run number, object name, observation date, exposure time among others have been selected to be displayed into the ouput table. [ JPEG | TIFF ].

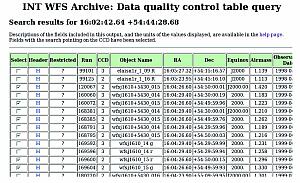
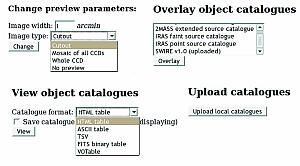
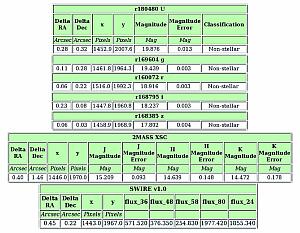
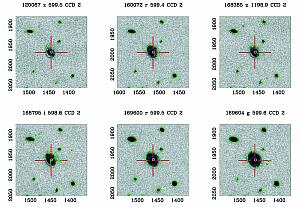
The data query returns a table with all the images that satisfy the constraints. All those fields which contain the search position are selected by default (see Figure 4). A range of visualisation options are available from here. It is possible to display image cutouts around the selected position (eg. Figure 7) with optional overlay of already predefined catalogues (the WFS catalogue, FIRST, 2MASS and IRAS catalogues are also available) and user supplied catalogues. It is also possible to display the whole CCD or the mosaic of all CCDs as well as view the catalogues in various formats (see Figures 5 and 6) with the federation between them being done on the fly. A registration script is built into the browser for those who wish to access the facilities offered therein.

Figure 4
Figure 4. Returned query listing the available images. Those fields with the search pointing on the CCD are selected by default. [ JPEG | TIFF ].

Figure 5
Figure 5. Display options available. Note the ‘Overlay object catalogues’ box is updated with one user supplied catalogue; sources in that catalogue can be displayed in the image cutouts as well as be federated with the other catalogues. [ JPEG | TIFF ].

Figure 6
Figure 6. Example catalogue federation output for one source (display rearranged due to page size limits). Together with the WFS optical magnitudes, also the magnitudes from 2MASS are displayed as the properties from our user supplied catalogue. [ JPEG | TIFF ].

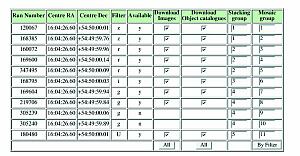
Finally the interface allows the automatic retrieval and downloading of catalogue and image products; the ability to group and remotely process images using CASU facilities including the CASU VDFS (Vista Data Flow System) image subtraction, image stacking and image mosaicing software utilities and retrieval of the results etc. (Figure 8).

Figure 7
Figure 7. Example cutouts in different wavebands returned from the DQC query around our selected source with object catalogues overlaid. [ JPEG | TIFF ].

Figure 8
Figure 8. Data retrieval form. We have selected to retrieve the catalogues from all the images as well as per band stacked images. Note that two of the images and catalogues are not available to the user because they are propietary. [ JPEG | TIFF ].

2.1 The INT WFS Legacy

The WFS archive contains 3.5Tb of reduced and calibrated imaging data online corresponding to about 1200deg2. The use of such database extends beyond the original proposal programmes described in section 1 and highly increases the value of the WFS as a legacy survey. Several of the fields observed are located in very well known regions of the sky. For example the 9deg2 observed in each of the two northern areas covered by the European Large Area ISO Survey (ELAIS) have been essential to characterise the population of infrared sources detected (Rowan-Robinson et al., 2004). Furthermore, these two regions have been observed in the mid- and far-IR by the Spitzer Wide-area Infrared Extragalactic Survey (SWIRE; Lonsdale et al., 2003). The WFS optical data have been used to provide the optical identifications of the infrared sources detected and have been also included in the first SWIRE data release.

3. Summary


The INT WFS programme is now completed. All the data is available online from the CASU WFS web page at IoA. Data cutouts, image catalogues and science images are available from this access point. The database also supports on the fly multipassband merging of catalogues and optional federation with user supplied catalogues as well as image mosaicking and stacking. The INT WFS imaging data has also been used by external programmes. ¤

References:

*: Email contact:  Mike Irwin (mike@ast.cam.ac.uk)


Top | Back

Contact:  (Public Relations Officer)
Last modified: 01 January 1970