Under the Microscope: Galaxy Centres with OASIS
R. McDermid
1,*, R. Bacon
2,
G. Adam
2, C. Benn
3, E. Emsellem
2, M. Cappellari
1,
H. Kuntschner
4, M. Bureau
5, Y. Copin
6,
R. L. Davies
5, J. Falcon-Barroso
1, P. Ferruit
2,
D. Krajnovic
5, R. F. Peletier
7, K. Shapiro
8,
P. T. de Zeeuw
1
1: Leiden Observatory; 2: CRAL-Observatoire, Lyon; 3: ING; 4:
STECF-ESO; 5: Dept. of Astrophysics, University of Oxford; 6: Institut
de Physique Nucleaire de Lyon; 7: Kapteyn Institute; 8: UC Berkeley
Early-type
galaxies are thought to be among the oldest known stellar systems, and as
such have experienced the full diversity of evolutionary mechanisms at work
in the universe. They are crucial laboratories for understanding how galaxies
form and evolve from early epochs until the present day. A key aspect of unlocking
their fossil evidence is by studying the dynamics of stars and gas, and characterising
the stellar populations. To this end, the SAURON survey (
de
Zeeuw et al., 2000,
Peletier
et al., 2001,
de
Zeeuw et al., 2002) has undertaken a study of 72 representative nearby
early-type galaxies and spiral bulges using the SAURON integral field spectrograph
at the WHT (
Bacon
et al., 2001).
The SAURON survey has a spatial sampling of 0.94"×0.94" per lenslet,
therefore often undersampling the median seeing at La Palma (0.7" FWHM).
Towards the galaxy nucleus, however, there are often sharp, localised features
in the kinematics, such as decoupled cores or central disks, as well as
distinct stellar populations and ionised-gas distributions. Such features
may only be partially resolved in the SAURON data, or perhaps not visible
at all.
Additionally, at Hubble Space Telescope (HST) resolution, elliptical
galaxies exhibit power-law central luminosity profiles. The slope of this
power-law shows clear trends with certain global properties, such as the
degree of rotational support, isophotal shape, and stellar populations.
It is therefore crucial to fill the gap between the medium (few 100s of
pc) to large-scale (few kpc) structures probed with SAURON and the inner
(<200pc) components probed by HST. We have thus begun a complementary
study on a subset of the SAURON sample using the OASIS spectrograph, during
its former life mounted on the Canada-France-Hawaii Telescope (CFHT), Hawaii.
This follow-up survey is being continued with OASIS at the WHT, with the
aim of completing all E/S0s of the SAURON survey by spring 2005. Here we
give an overview of this follow-up survey, and future prospects for using
OASIS in this field.
The OASIS Spectrograph
The OASIS integral-field spectrograph, mounted behind the NAOMI Adaptive
Optics (AO) system (Benn et al.,
2002,
2003)
in the GRACE Nasmyth enclosure of the WHT (
Talbot
et al., 2003), was offered to the ING community in semester 2004B,
and was awarded time during 15 nights for a variety of science projects.
OASIS is based on the TIGER lens-array concept (
Bacon
et al., 1995) and is designed for high-spatial resolution observations,
specifically with the assistance of AO. There is a selection of gratings
and filters available, giving low and medium spectral resolution modes within
the 0.43mm to 1mm wavelength range. Via the use of different enlargers, there
is also a range of spatial samplings which can be adapted to suit the available
PSF.
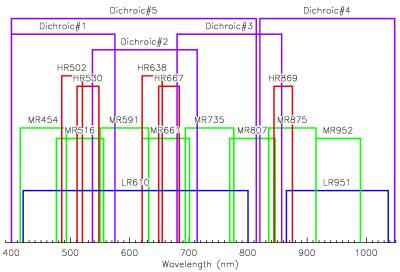
Figure 1 and
Table 1 summarise
the available instrument modes. With the addition of AO capabilities provided
by NAOMI, OASIS is one of the most versatile optical integral-field spectrographs
currently in operation.
|
| Figure 1. Spectral configurations of OASIS.
Blue lines indicate the low-resolution (LR) modes (R~1000); green lines
indicate medium-resolution (MR) modes (1000<R<2000); and red lines
indicate high-resolution (HR) modes (R>2000). The dichroics are required
to isolate the science light from the NAOMI AO system. [ JPEG | TIFF ]
|
Table 1. OASIS spatial configurations.
| Mode
| Enlarger
| Sampling
| FOV
|
| (mm)
| (")
| (")
|
| Spectral |
8.5 |
0.09 |
2.7×3.7 |
|
12.5 |
0.14 |
4.0×5.5 |
|
22 |
0.26 |
7.7×10.3 |
|
33 |
0.42 |
12.0×16.7 |
| Imaging |
62 |
0.02 |
37.6 |
Observations
For this project, OASIS was configured to give similar spectral coverage
and resolution as SAURON by using the MR516 configuration. The data were
reduced using the publicly available
XOasis software (
Rousset,
1992) developed at CRAL (Lyon). Galaxy observations were composed of
two or more exposures, which were merged by first aligning the galaxy nucleus
of the separate reconstructed images. Co-spatial spectra were then combined,
taking into account the error spectra that are propagated through the reduction.
In order to provide reliable, unbiased measurements, the data cubes are
binned in the spatial dimension to a minimum signal-to-noise ratio of 60
per pixel using the Voronoi 2D-binning developed by Cappellari & Copin
(
2003).
Results
From the 2D-binned data cubes, it is possible to derive the following
properties:
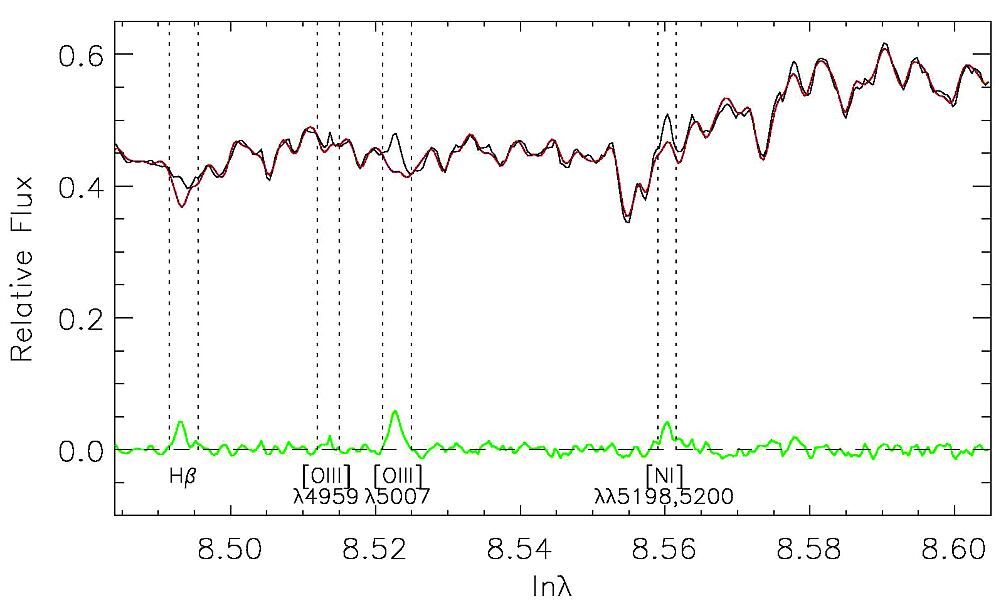
Stellar Kinematics: These are derived by directly fitting the
spectra in pixel-space (
Cappellari
& Emsellem, 2004), which avoids contamination by nebular emission
lines, which can often be strong in the central regions of early-type galaxies
(
Figure 2). Template mismatch was minimised by building
an ‘optimal template’ from a library of stellar population models from
Vazdekis (
1999).
|
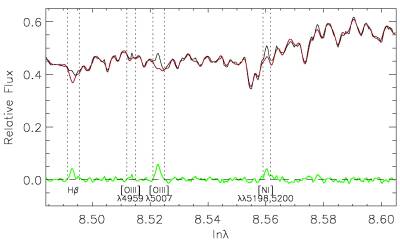
| Figure 2. Optimal template fit to the central
spectrum of NGC 2768. The lower spectrum shows the residual emission lines
after the template-fit, which are fitted using single Gaussians to obtain
the gas properties. Vertical lines show regions around the emission that
are excluded from the fit. [ JPEG | TIFF ]
|
Gas Kinematics: By subtracting the optimal template, one obtains
a residual spectrum in which the emission-line features are revealed. We
then determine the distribution and kinematics of the ionised-gas, by fitting
the emission-line profiles of these continuum-free spectra with simple
Gaussians.
Line Strengths: The OASIS spectral range contains a number of
key absorption features which can be used as diagnostic tools to determine
the age and metallicity of the stellar populations within a galaxy. To
remove the contaminating emission lines, the Gaussian fits are subtracted
from the original data before measuring the absorption line strengths. Finally,
the absorption line strengths are calibrated onto the well-established LICK/IDS
system (e.g.
Trager
et al., 1998).
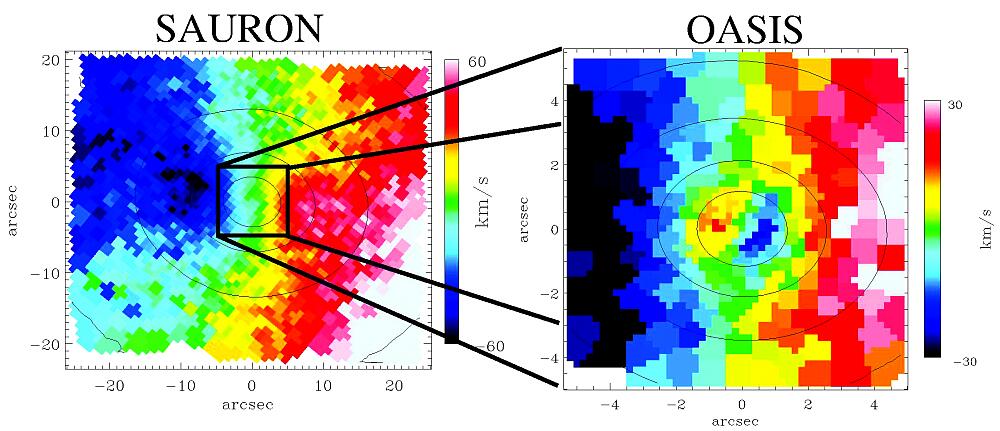
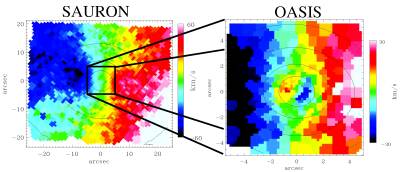
Figure 3 shows an example of how the OASIS data
can be used to reveal central features of galaxies in the SAURON survey.
The left panel of this figure presents the SAURON velocity field of NGC 4382.
There is a low-level ‘kink’ in the zero-velocity (green) contour near the
galaxy centre. The OASIS data (right panel) clearly reveal this as a counter-rotating
decoupled component.
|
| Figure 3. Spatially binned SAURON (left map) velocity
field of NGC 4382 (Emsellem
et al., 2004) showing the outline of the OASIS field (right map). [
JPEG | TIFF ]
|
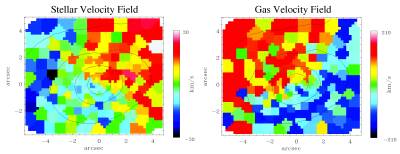
Figure 4 presents the OASIS stellar (left panel)
and gas (right panel) velocity fields for NGC 2768. The stellar component
rotates around the apparent short-axis of the galaxy. The gas, however,
rotates around the apparent long-axis, perpendicular to the stars. This
illustrates how we can separate the stellar and gas properties, using the
optimal template fit. There is some evidence of non-axisymmetry in the stellar
velocity field, which may indicate the presence of a bar.
|
| Figure 4. OASIS stellar (left) and ionized-gas
(right) velocity fields for NGC 2768 showing the decoupled rotation of the
stars and gas. Isophotes from the reconstructed image are overplotted, showing
the total flux within each OASIS spectrum. Distortion of these isophotes indicates
dust features. [ JPEG | TIFF ]
|
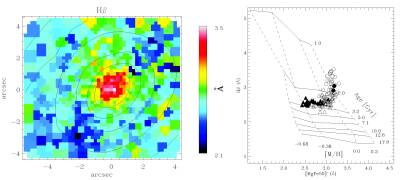
Figure 5 presents a map of Hβ absorption strength
(after emission subtraction) for the galaxy NGC 3489 (left panel) showing
a strong peak in the central 1", indicating a young stellar population.
The right panel of
Figure 5 quantifies this, plotting
Hb absorption strength against the abundance-insensitive metallicity indicator
[MgFe50]' (
Kuntschner et al.) from the OASIS data.
The young population in the core of this galaxy indicates that it is in
a post-starburst phase, with a luminosity-weighted age of around 1.5 Gyr.
Equivalent SAURON data are also shown, illustrating that both data sets
are consistent.
|
| Figure 5. Left panel: OASIS map of Hβ absorption
strength in NGC 3489. Right panel: Hβ absorption strength versus an abundance-insensitive
metallicity index, overplotted with a grid of stellar population models from
Vazdekis (1999). Open symbols: OASIS measurements; filled symbols: SAURON
measurements, binned in 1" circular annuli. Circles indicate measurements
inside a 1" radius of the centre; triangular symbols indicate measurements
outside this radius. [ JPEG | TIFF ]
|
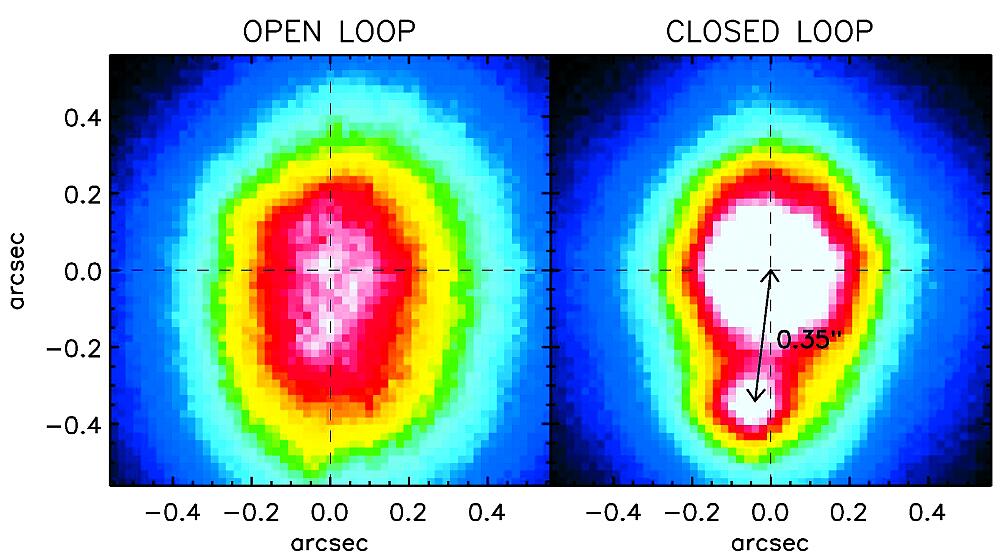
Future Prospects: NAOMI
The integral-field capabilities of OASIS are ideal for exploiting the
corrected PSF delivered by the NAOMI AO system, and commissioning results
indicate that NAOMI is performing well at optical wavelengths (
Figure 6). There are several objects in our sample which
have a suitable guide star nearby, for which we have been allocated observing
time to push the limits of spatial resolution, and measure stellar motions
close to the putative central supermassive black hole residing at the galaxy
centres. There are few targets in the sky with such conveniently placed bright
stars, and so this project provides a glimpse of what will be possible on
many targets when the GLAS laser guide-star system becomes available in 2006.
More information on GLAS can be found on the web page:
http://www.ing.iac.es/About-ING/Strategy/glas_web_announcement.htm.
|
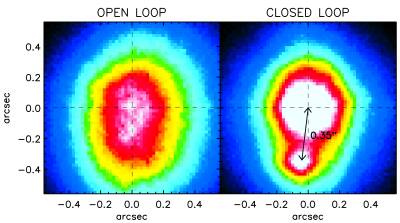
| Figure 6. OASIS R-band images of a close binary
(Vmag~ 9+10) in 0.5" natural seeing (“open loop”) and with NAOMI correcting
the PSF (“closed loop”) to 0.2" FWHM. [ JPEG
| TIFF ]
|
Summary
The central regions of nearby early-type galaxies contain a wealth of
structure and detail that we are only just beginning to uncover. Galaxy properties
show connections on vastly different scales, and by understanding these relationships,
we gain insight into galaxy formation mechanisms. The OASIS follow-up of
the SAURON survey will provide a unique data set for a large sample of objects,
complementing the panoramic view delivered by SAURON, and giving a comprehensive
picture of galaxy structure.
Acknowledgments: It is a pleasure to thank the staff of the ING and CRAL
for all their hard efforts in ensuring an efficient transfer and installation
of OASIS at the WHT. Thanks also to the CFHT staff for their support of
OASIS during its time there.
¤
References:
- Bacon, R., et al., 1995, A&AS, 113, 347. [ First citation in text | ADS
]
- Bacon, R., et al., 2001, MNRAS, 326, 23. [ First citation in text | ADS
]
- Benn, C. R., et al., 2002, ING Newsl., No. 6, 21. [ First citation in text | ADS
]
- Benn, C. R., et al., 2003, ING Newsl., No. 7, 21. [ First citation in text | ADS
]
- Cappellari, M. & Copin, Y., 2003, MNRAS, 342,
345. [ First citation in text | ADS
]
- Cappellari, M. & Emsellem, E., 2004, PASP, 116,
138. [ First citation in text | ADS
]
- Emsellem, E., et al., 2004, MNRAS, 352, 721. [ First citation in text | ADS
]
- Kuntschner, H., et al., in prep. [ First
citation in text ]
- Peletier, R. F., et al., 2001, ING Newsl., No. 5, 5. [ First citation in text | ADS
]
- Rousset, A., 1992, PhD, Univ. J. Monnet de Saint-Etienne. [ First citation in text | ADS
]
- Talbot, G., et al., 2003, ING Newsl., No. 7, 19. [ First citation in text | ADS
]
- Trager, S. C., et al., 1998, ApJS, 116, 1. [ First citation in text | ADS
]
- Vazdekis, A., 1999, ApJ, 513, 224. [ First citation in text | ADS
]
- de Zeeuw, P. T., et al., 2000, ING Newsl., No. 2, 11. [ First citation in text | ADS
]
- de Zeeuw, P. T., et al., 2002, MNRAS, 329, 513. [
First citation in text | ADS
]
*Email contact: Richard McDermid (
mcdermid@strw.leidenuniv.nl)