 | |||
|

| Home > Public Information > ING Newsletter > No. 10, December 2005 > The SAURON View of the Nuclear Ring in M100 |
|
|
SCIENCE |
|
|
|
Previous: Deep Impact Observing at the Isaac Newton Telescope | Up: Table of Contents | Next: Progress on the GLAS Rayleigh Laser Beacon System for the William Herschel Telescope
Article mirrored at: La Palma server | Cambridge server
Other available formats: PDF
The SAURON View of the Nuclear Ring in M100
Emma L. Allard1, *, Johan H. Knapen1 and Reynier F. Peletier2
1: Centre for Astrophysics Research, University of Hertfordshire; 2: Kapteyn
Institute, University of Groningen.
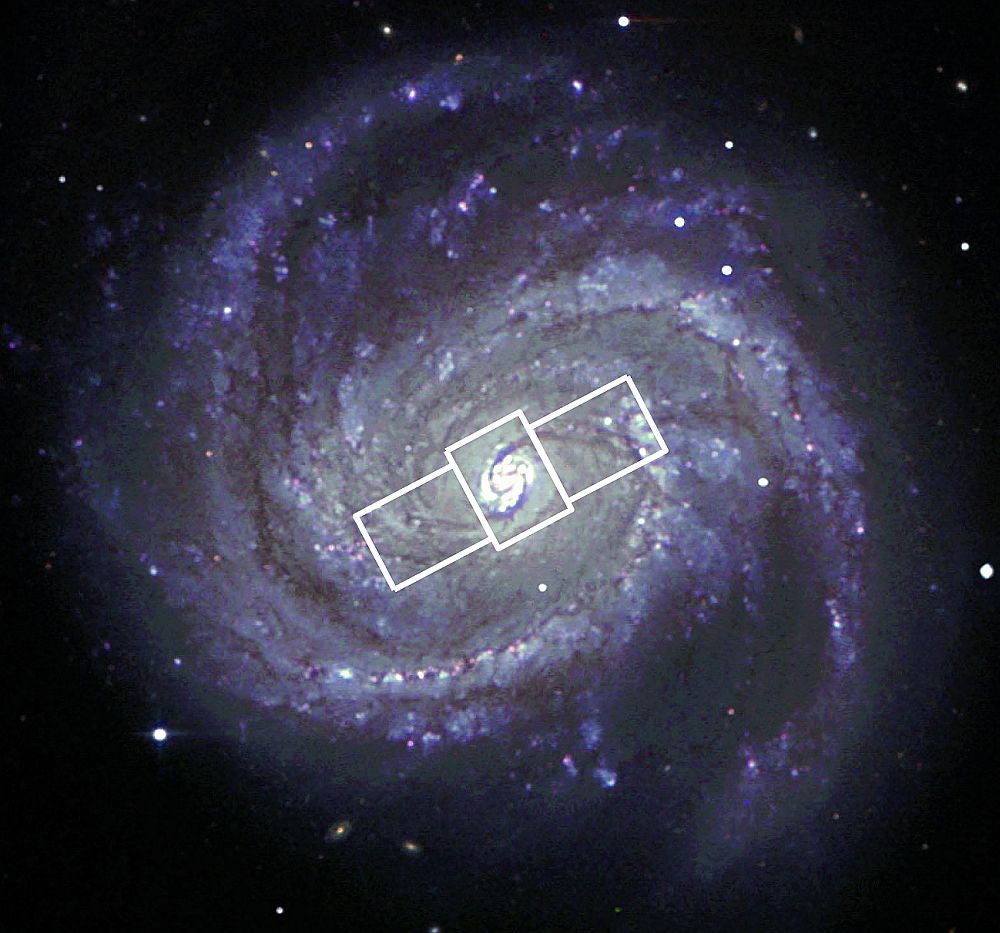
| Figure 1. Optical image of M100 (courtesy of Nik Szymanek) showing the location of the three SAURON fields. Our fields span the complete bar, while the nuclear ring is contained within the central pointing. All images shown in this paper are orientated North up, and East to the left. Reproduced with permission from Allard et al. (2005). [ JPEG | TIFF ] |
Most of what is known about the dynamical origin and evolution of these rings stems from detailed numerical modelling, confirmed on the observational side mainly from the gas kinematics. Two-dimensional kinematics of the stars from actual observations are mostly lacking, but are needed to provide essential constraints on the theoretical models. In addition, detailed spectroscopic studies of the stellar populations in the rings are rare, but needed to confirm the detailed mechanism leading from inflowing gas to star formation.
Observations and Data Reduction
We have observed the nearby spiral galaxy M100 with the SAURON integral field unit (Bacon et al., 2001) on the WHT to help rectify this situation. SAURON boasts a relatively large field of view of 33×41 arcsec, and by using 3 pointings mosaiced together we have covered the ring and bar region of M100 (Figure 1). SAURON has a wavelength range of 4760– 5350Å, which contains the Hβ and [OIII] emission lines from which we can measure the gas kinematics, and the Hβ and Mgb absorption lines to measure the stellar kinematics.
The data were reduced using the specially developed XSauron software (Bacon et al., 2001) and were spatially binned to a constant signal to noise ratios of 10 for the gas and 60 for the stars (using the Voronoi 2D binning method of Cappellari & Copin, 2003). To extract the kinematics, we have made use of the Penalized Pixel Fitting method (PPXF) of Cappellari & Emsellem (2004). This method fits the galactic spectrum to a stellar template library (Vazdekis, 1999) while convolving with a line of sight velocity distribution (LOSVD). We fit the LOSVD with a modified Gaussian and from this we derive the stellar kinematics. With this technique we can successfully separate the stellar and gas components in the individual spectra. To measure the gas kinematics we fit individual Gaussians to the emission lines. Using the PPXF method it is also possible to measure emission and absorption line strengths.
Results
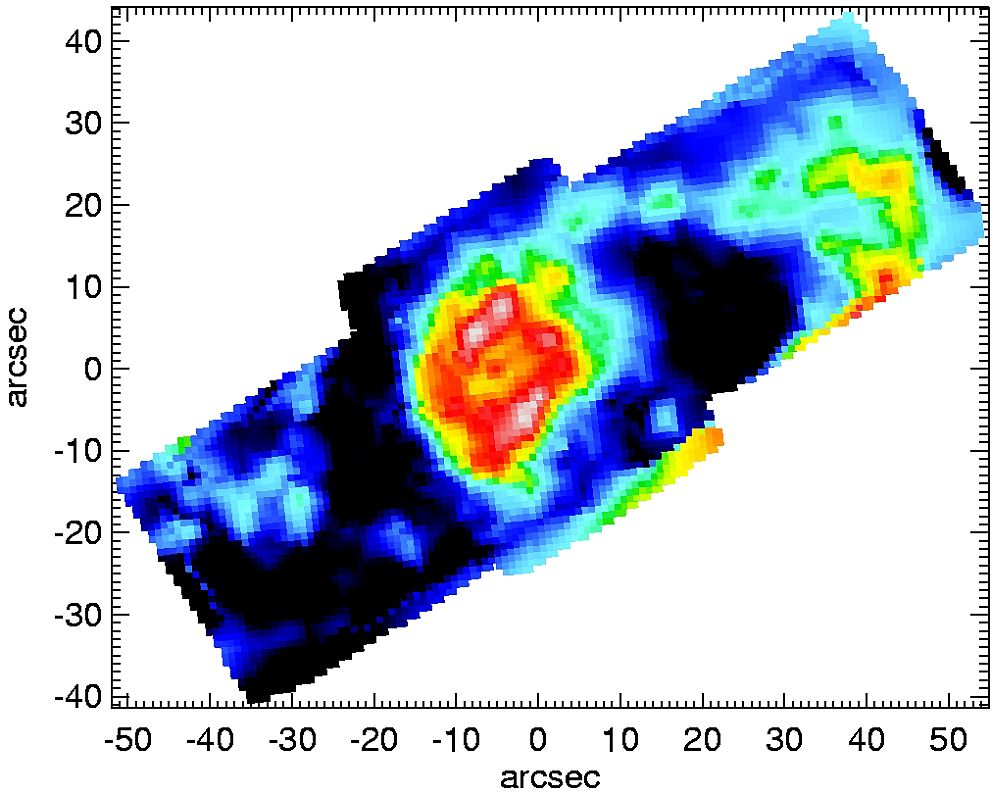
We present here some of the most salient results from our analysis (see also Allard et al., 2005). Firstly, we describe the Hβ emission across the field (Figure 2). This shows clearly the nuclear ring of star formation, connected to a cluster of HII regions at the end of the bar (at a position angle of 153°) by a thin arc of emitting material. A closer inspection of the ring reveals it to consist of four tightly wound spiral armlets (cf. Knapen et al., 1995a, b).
| Figure 2. Hβ emission across the field. Reproduced with permission from Allard et al. (2005). [ JPEG | TIFF ] |
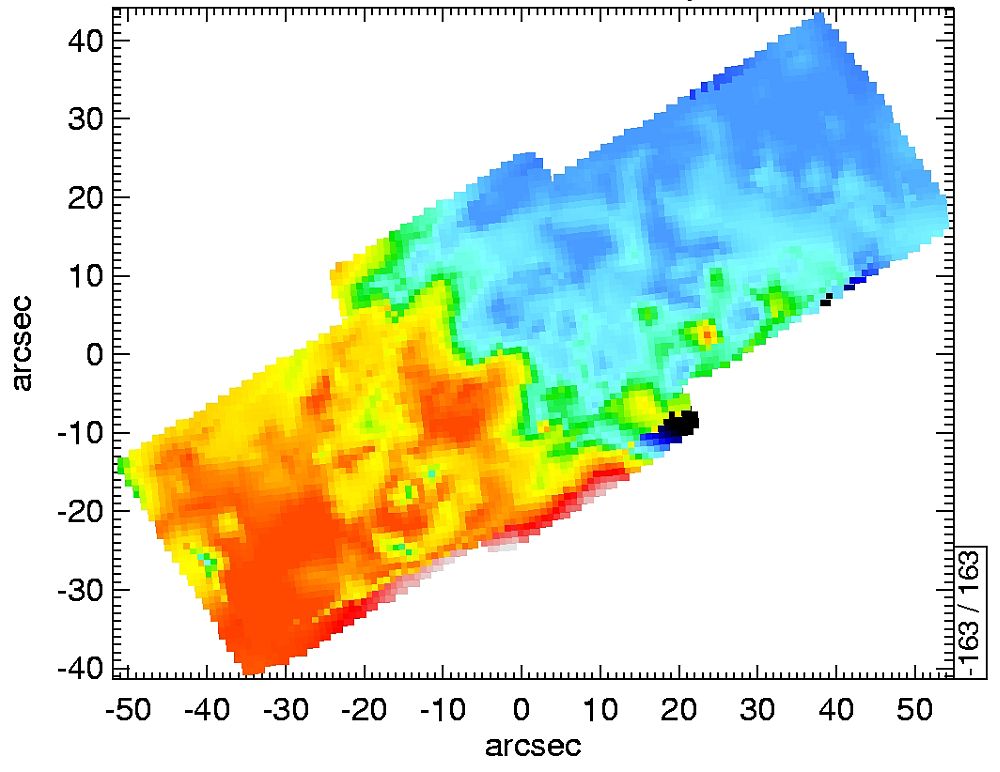
The gas and stellar velocity fields are presented in Figures 3 and 4. The stellar kinematics probe the underlying gravitational potential while the gas kinematics probe the response of the gas to this potential. The gas velocity field (Figure 3) shows strong deviations from circular motion, evident from the twists and wiggles in the velocity contours near the centre of the galaxy (previously seen in the Hα velocity field, Knapen et al., 2000). These deviations are interpreted as a combination of two effects: streaming motions due to a spiral density wave and streaming due to the bar.
| Figure 3. Mean gas velocity field. Red and blue indicate redshifted and blueshifted material. The minimum and maximum values are quoted in the bottom right box. [ JPEG | TIFF ] |
The stellar velocity field (Figure 4) shows predominantly circular motion, although some indication of non-circular motions is present along the minor axis of the bar, at the location of the nuclear ring. This may either be due to the stellar orbits being affected by the injection of gas into the region, or to young stars having similar kinematics to their parent gas cloud. As our stellar kinematics are derived from stellar absorption features, strongest in older stars, the former explanation is more plausible.

Relatively Cool Gas from which Stars Form
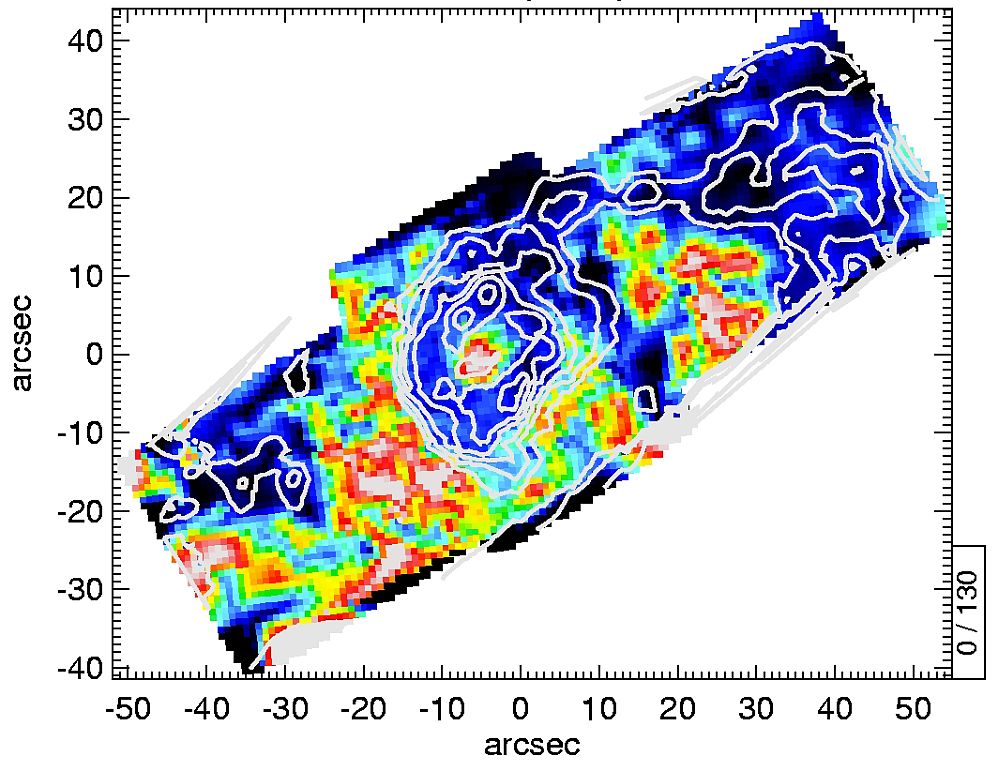
We also present here the gas velocity dispersion across the field (Figure 5). This shows a high central value of around 130km/s, and a much lower value of around 60km/s in a ring around the centre. We have overlaid Hβ emission contours over the dispersion map to show that this low dispersion material lies at the exact location of the star forming ring. The low gas dispersion at the location of the ring is further evidence of the existence of a resonance region there, specifically the pair of Inner Lindblad resonances described before (e.g., Knapen et al., 1995a). Cold gas is very unstable to star formation, and we are detecting here the cold gas from which the massive stars form.
| Figure 5. Gas velocity dispersion across the field. Overlaid are Hβ emission contours indicating the location of the ring. Values are in km/s with red and blue colours representing high and low values respectively. Reproduced with permission from Allard et al. (2005). [ JPEG | TIFF ] |
The relatively low dispersion gas is also spatially correlated with Hβ emission at other locations, such as in the HII regions at the end of the bar and along the thin arc connecting these with the ring. This confirms that the origin of the cold gas is further out in the disk of the galaxy, and that it is being driven inwards along the dustlanes in the bar, where it finally accumulates in a ring (Allard et al., 2005).
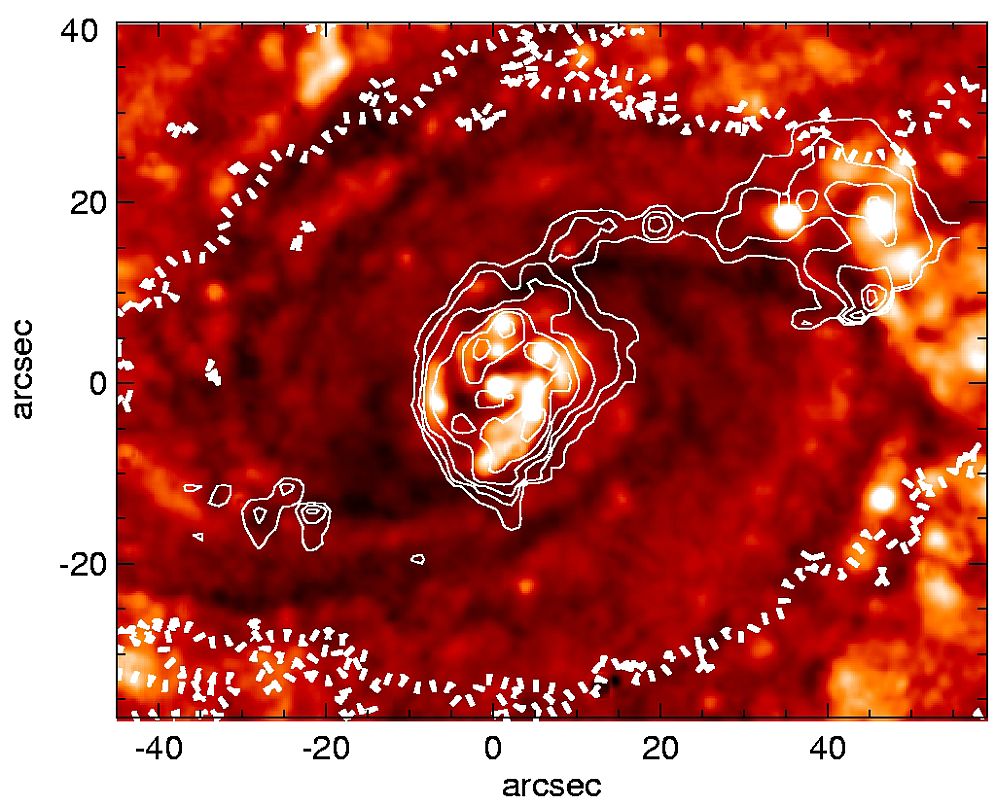
The Hβ emission appears to follow the curved dustlanes, as can be seen in Figure 1, so to investigate any spatial correlation between the two we have overlaid Hβ emission contours onto a B–R colour image (Figure 6). There is a clear offset between the dustlanes and the star formation of around 700pc. At the location of the shocks we expect strong shear, and so star formation will be prevented. Immediately downstream from the shock, however, the piling up of gas allows material to cool and acquire lower velocity dispersion, and star formation can be triggered.
| Figure 6. B–R image of M100. Overlaid are Hβ emission contours (thin white line), and a Ks-band contour outlining the bar (white dashed line). Reproduced with permission from Allard et al. (2005). [ JPEG | TIFF ] |
Summary
The results presented here support the theoretical picture in which star formation at the centres of spiral galaxies is brought about by the injection of gas into the area through shocks (manifested as dustlanes), and the creation of rings in the presence of resonances. Our SAURON data have allowed an unprecedented view of the two-dimensional relationships between the different gas and stellar tracers. Further results from our analysis will be published in a forthcoming paper (Allard, Knapen & Peletier, in preparation). ¤
References:
Allard, E. L., Peletier, R. F., Knapen, J. H., 2005, ApJ, 633,
L25. [ ADS
| First citation in text ]
Bacon, R., et al., 2001, MNRAS, 326, 23. [ ADS
| First citation in text ]
Benedict, G. F., Howell, D. A., Jørgensen, I., Kenney, J. D. P., Smith,
B. J., 2002, AJ, 123, 1411. [ ADS
| First citation in text ]
Cappellari, M., Copin, Y., 2003, MNRAS, 342, 345.
[ ADS
| First citation in text ]
Cappellari, M., Emsellem, E., 2004, PASP, 116, 138.
[ ADS
| First citation in text ]
Knapen, J. H., 2005, A&A, 429, 141. [ ADS
| First citation in text ]
Knapen, J. H., Beckman, J. E., Heller, C. H., Shlosman, I., de Jong, R. S.,
1995a, ApJ, 454, 623. [ ADS
| First citation in text ]
Knapen, J. H., Beckman, J. E., Shlosman, I., Peletier, R. F., Heller, C. H.,
de Jong, R. S., 1995b, ApJ, 443, L73. [ ADS
| First citation in text ]
Knapen, J. H., Shlosman, I., Heller, C. H., Rand, R. J., Beckman, J. E., Rozas,
M., 2000, ApJ, 528, 219. [ ADS
| First citation in text ]
Kormendy, J., Kennicutt, R. C., 2004, ARA&A, 42,
603. [ ADS
| First citation in text ]
Vazdekis, A., 1999, ApJ, 513, 224. [ ADS
| First citation in text ]
*: Email contact: Emma Allard (
 )
)
| Top | Back |
|
