Flux standard data and empirical throughput
The
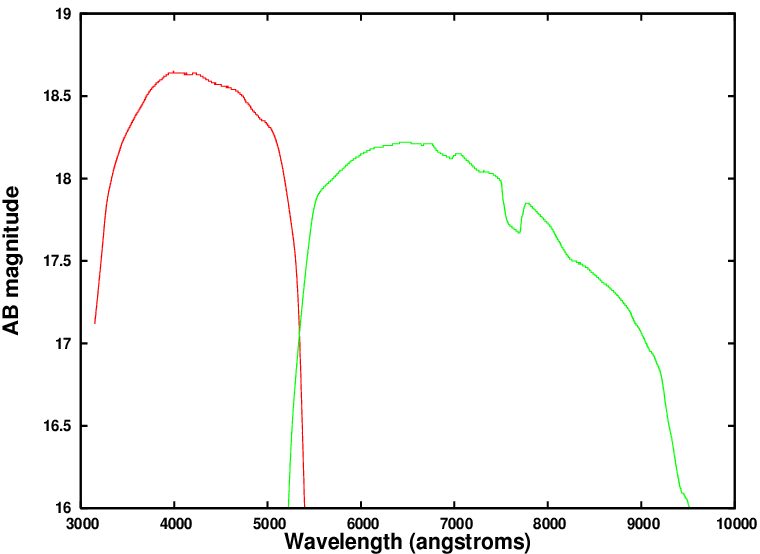
figure below shows the results of throughput measurements of flux standards with the
EEV12 and RED+ detectors in the blue and red arm
respectively, and the 5300 dichroic. The Y-axis is the apparent AB
magnitude of a star
observed
at the zenith which gives one detected photon per second per Angstrom. The
lowest resolution grating (R158R) was used in the red arm (without any
order sorter filter) and the R300B grating was used in the blue arm.
Spectra were obtained with a wide slit (10
arcsec). Conditions were photometric, with negligible dust levels
present.
The figure shows the total response of the ISIS blue and
red arms (i.e., of the WHT primary and secondary, the 5300 dichroic, ISIS optics and the detector
responses) over the spectral range
~3200 to ~9300Å. The dip in throughput centred on ~5300Å is
of course caused by reduced throughput at the dichroic cross over
from reflection (blue arm) to transmission (red arm).


