| |||
|
Home > Public Information > ING Newsletter > No. 9, March 2005 > The Search for the Companion Star of Tycho Brahe’s 1572 Supernova |
|
SCIENCE |
|
|
|
Figure 1. Chandra image of Tycho SNR. The colours in the Chandra X-Ray image of the hot bubble show different X-ray energies, with red, green, and blue representing low, medium, and high energies, respectively. (The image is cut off at the bottom because the southernmost region of the remnant fell outside the field of view of the Chandra camera). The bright star in the centre of the remnant is the same bright star in the centre of Figure 2 (star labelled ‘Tycho A’). Credit: Chandra X-Ray Observatory/DSS2. [ JPEG | TIFF ]. |
Figure 2 (left). B-band image of the centre of
Tycho SNR from the Auxiliary Port camera at the William Herschel Telescope.
The emptiness of the field is remarkable. We carried out repeated photometric
and spectroscopic observations of the included stars in the surveyed area
(see solid circle in Figure 3) at various epochs to check for variability
and exclude binarity. [ JPEG | TIFF ]. Figure 3 (right). Positions and proper motions of stars. Positions are compared with three centres: the Chandra (Ch) and ROSAT (RO) geometrical centres of the X-ray emission, and that of the radio emission (Ra). Dashed lines indicate circles of 0.5 arcmin around those centres and the solid line is a circle with a radius of 0.65 arcmin around the Chandra centre. The supernova position reconstructed from Tycho Brahe’s measurements (Ty) is also shown, though merely for its historical interest. The proper motions of the stars measured from HST WFPC2 images are represented by arrows, their lengths indicating the total displacements from 1572 to 2004. Error bars are shown by parallel segments. Red circles are the extrapolated positions of the stars back to 1572. [ JPEG | TIFF ]. |
Figure 4. Radial velocity in the Local Standard of Rest (LSR), versus distance for the subsample of stars closer than 6.5kpc. The dashed line shows the approximate relationship for the stars in the direction of Tycho given by the expression vr=–vsolar cos(l–lsolar)+Arsin(2l), where l and lsolar are the respective Galactic longitudes of Tycho SNR and the solar apex, vsolar is the Sun’s velocity in the LSR, A is the Oort’s constant and r is the distance in kpc. We include two field stars (stars Tycho O and U) that are slightly away from the search area but at distances in the range 2–4 kpc. [ JPEG | TIFF ]. |
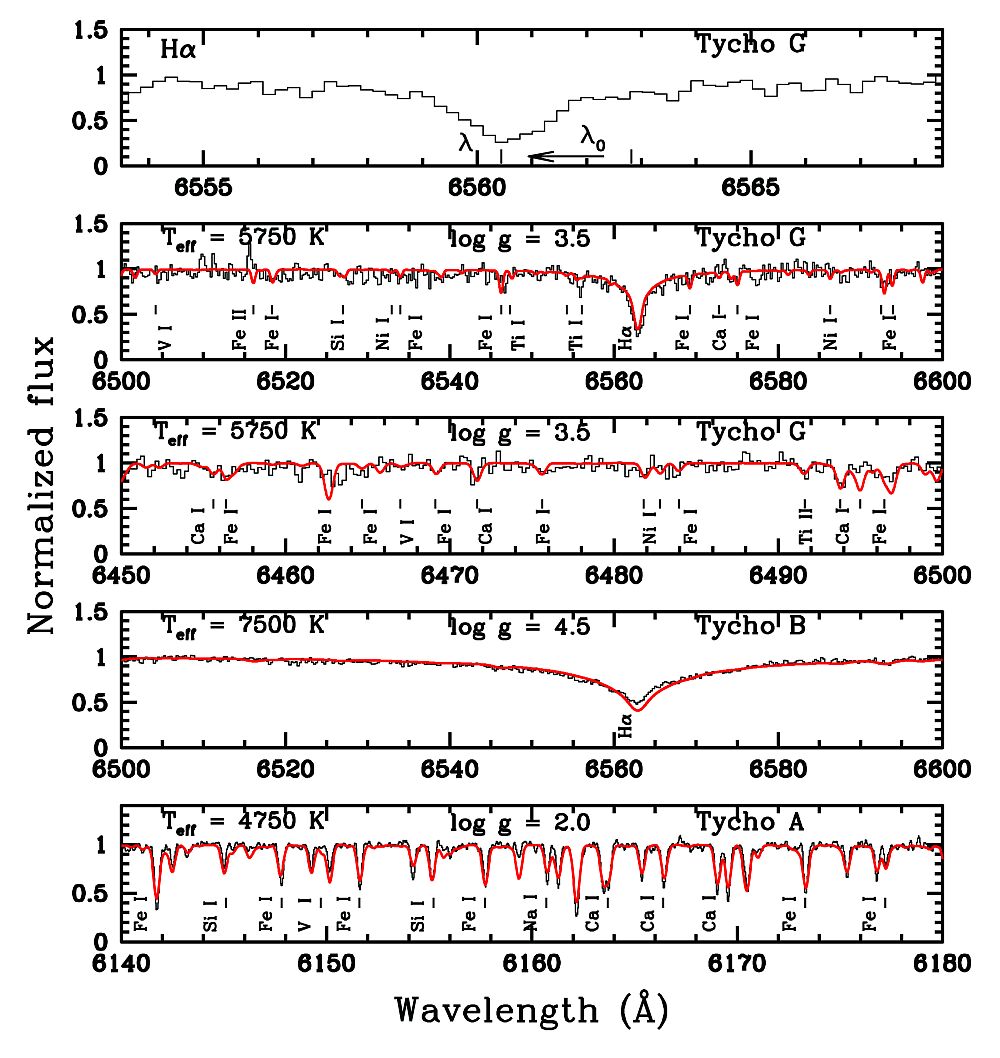
Figure 5. Model fits to observed spectra of the subgiant star Tycho G, the red giant star Tycho A and the main-sequence star Tycho B. Identification of the most significant metal lines are given. We have not detected significant spectroscopic anomalies, either here or in the whole sample, and most spectra are well reproduced assuming solar abundances. Thin lines correspond to the observations and thicker lines to the synthetic spectra. Spectra were obtained at the WHT with UES and ISIS. Tycho A (bottom panel) is the closest red giant in the sample. It is a K0 III star, and its mas should be 3 solar masses approximately. Tycho A is ruled out as the companion star of SN 1572 on the basis of its short distance: 1.1±0.3kpc. All the other red giants are located well beyond Tycho´s remnant, and therefore are also ruled out. The A8/A9 star Tycho B (second panel from bottom) has 1.5 solar masses, which would fall within the appropriate range for main-sequence type Ia supernova companions, as it would have been massive enough to transfer the required amount of mass to the white dwarf. The entirely normal atmospheric parameters, however, strongly argue against any such event in the star’s recent past. The second and third spectra from the top show computed spectra compared with observed spectra for Tycho G. The upper panel shows the observed spectrum near Hα. This line is blueshifted, implying a peculiar radial velocity exceeding about 3 times the velocity dispersion for its stellar type. [ JPEG | TIFF ]. |
Figure 6. Left: A low-resolution spectrum over a wide wavelength range was obtained with LRIS at the Keck Observatory (second from top) and it is compared with template model spectra of the same spectral class and various metallicities. Right: Several fits to Fe and Ni lines in Tycho G for solar abundances (bold line), [Fe/H]=–0.5 (dashed line) and [Fe/H]=–1 (dotted line). The high content of nickel and iron in the gas of Tycho G clearly identifies it as a star born in the Galactic Plane. The data was obtained with ISIS at the WHT. [ JPEG | TIFF ]. |
Top | Back |
|