 | |||
|

| Home > Public Information > ING Newsletter > No. 9, March 2005 > IPHAS: Surveying the Northern Galactic Plane in Hα |
|
|
SCIENCE |
|
|
|
Previous: Contacts at ING | Up: Table of Contents | Next: Wide Field Survey: Final Data Products
|
| |||
|
| Home > Public Information > ING Newsletter > No. 9, March 2005 > IPHAS: Surveying the Northern Galactic Plane in Hα |
|
|
SCIENCE |
|
|
|
|
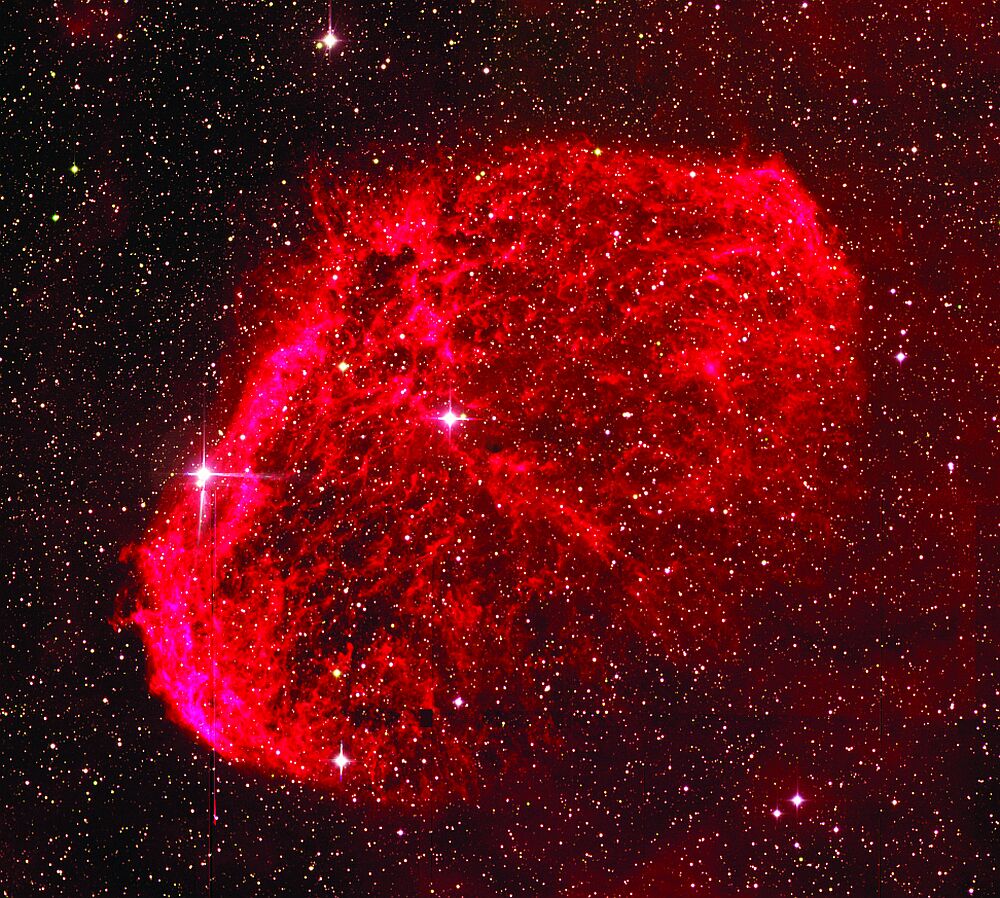
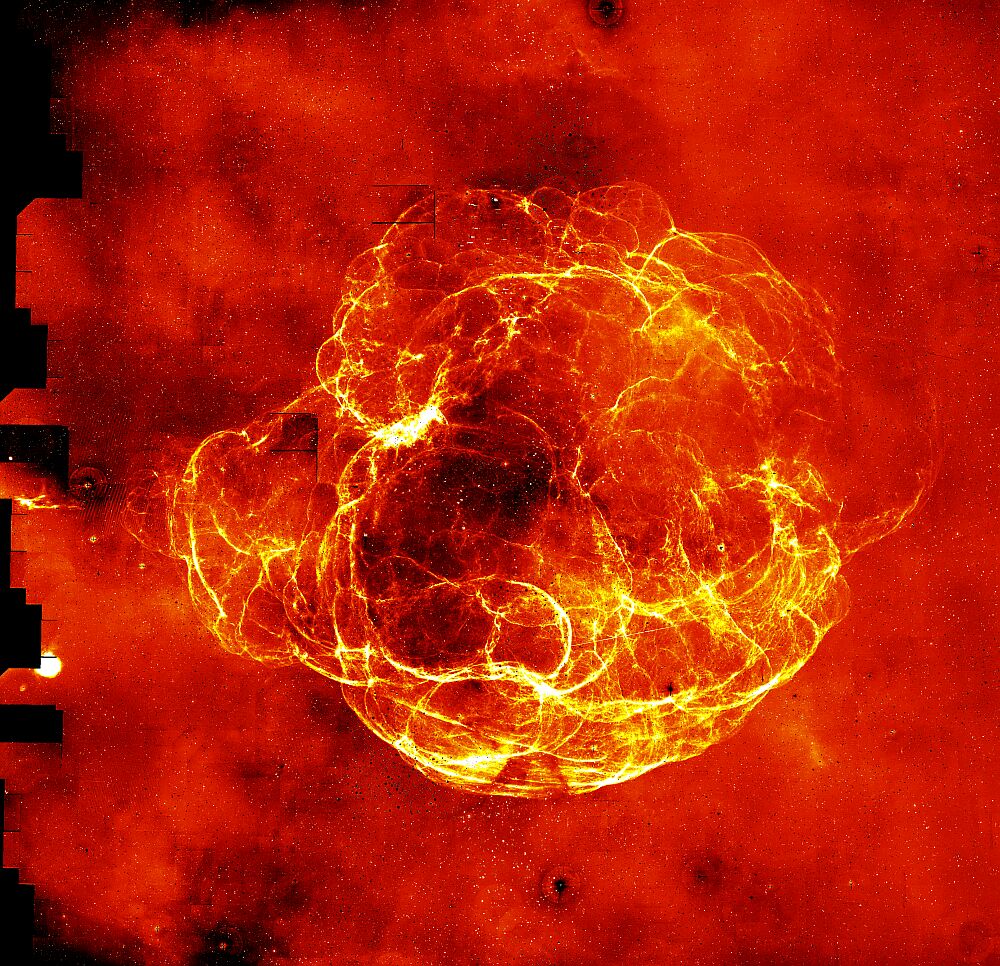
| Figure 1. The crescent nebula, NGC6888, which surrounds the Wolf-Rayet star PPM 84423, seen in Hα emission by IPHAS. Colour image courtesy of Jonathan Irwin. [ JPEG | TIFF ] |
|
|
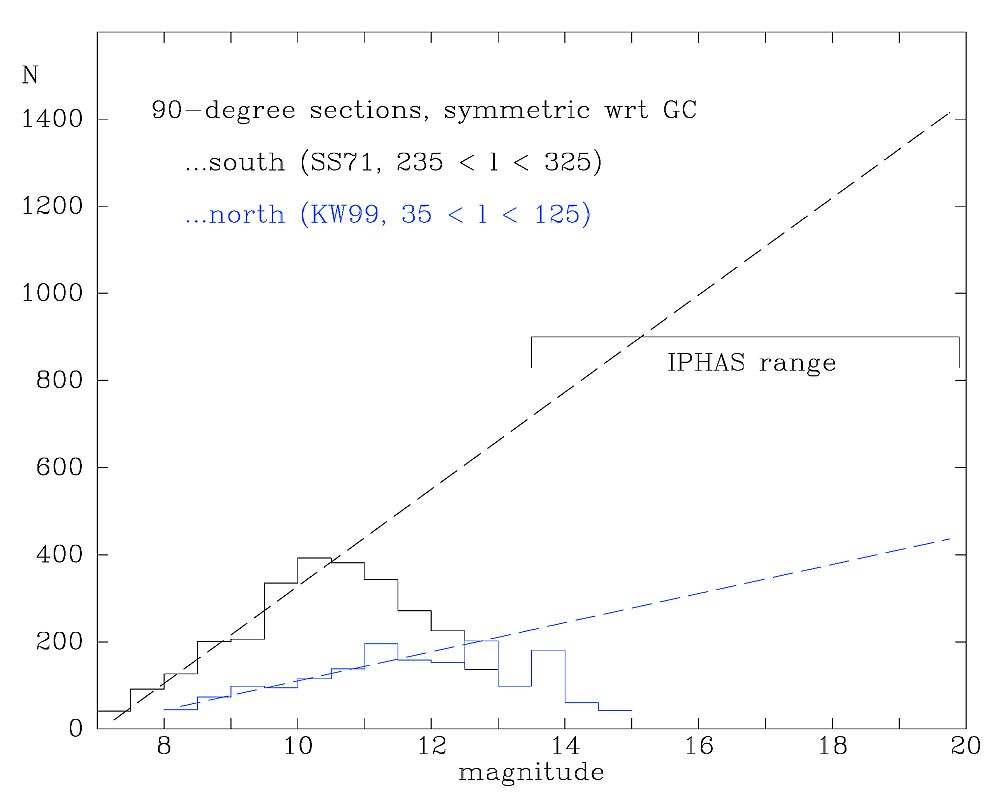
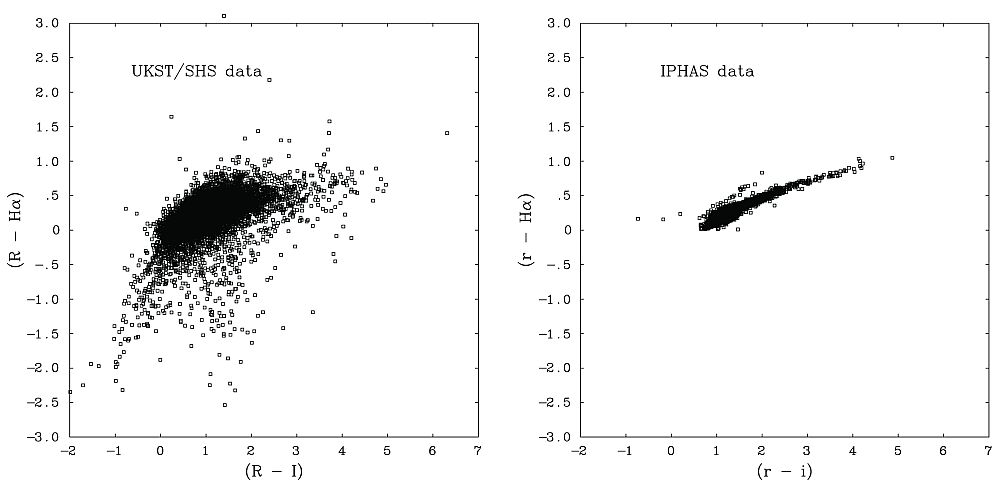
| Figure
2. The left-hand panel illustrates the effect of a simple extrapolation
of numbers of catalogued emission line stars from previous Ha surveys of
Kohoutek & Wehmeyer (1999) in the north, and Stephenson & Sanduleak
(1971) in the south. Based on a rough extrapolation of these earlier surveys
it is estimated that of order ~104 emission line stars will be
discovered. [ JPEG | TIFF ] The central and right-hand panels compare
the quality of the current IPHAS colour-colour diagrams with those for the
same sky area taken from the UK Schmidt southern Hα photographic survey.
Notice the superb delineation of the field population of normal stars and
M dwarfs in the IPHAS data (cf. Figure 3). [
JPEG | TIFF ] |
|
|
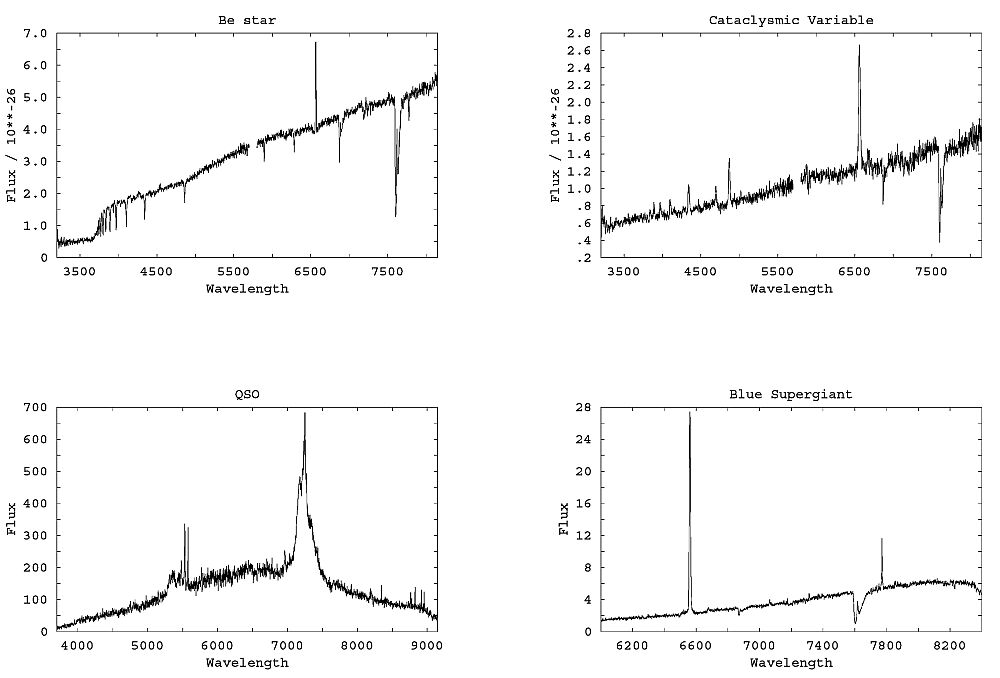
| Figure 3. Sampling the Hα zoo as discovered by IPHAS. Clockwise from top left; a typical Be star, a cataclysmic variable, a potential luminous blue supergiant in Cygnus and a low redshift QSO (the QSO was detected as a peculiar outlier in the colour-colour plane). [ JPEG | TIFF ] |
|
|
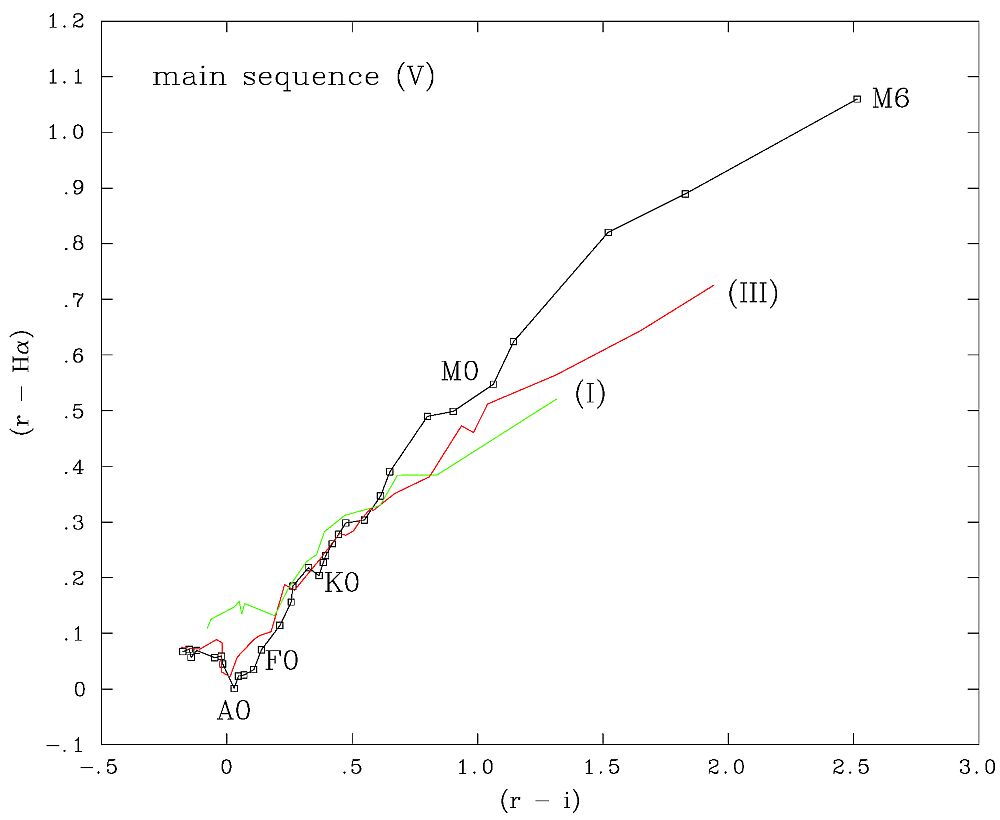
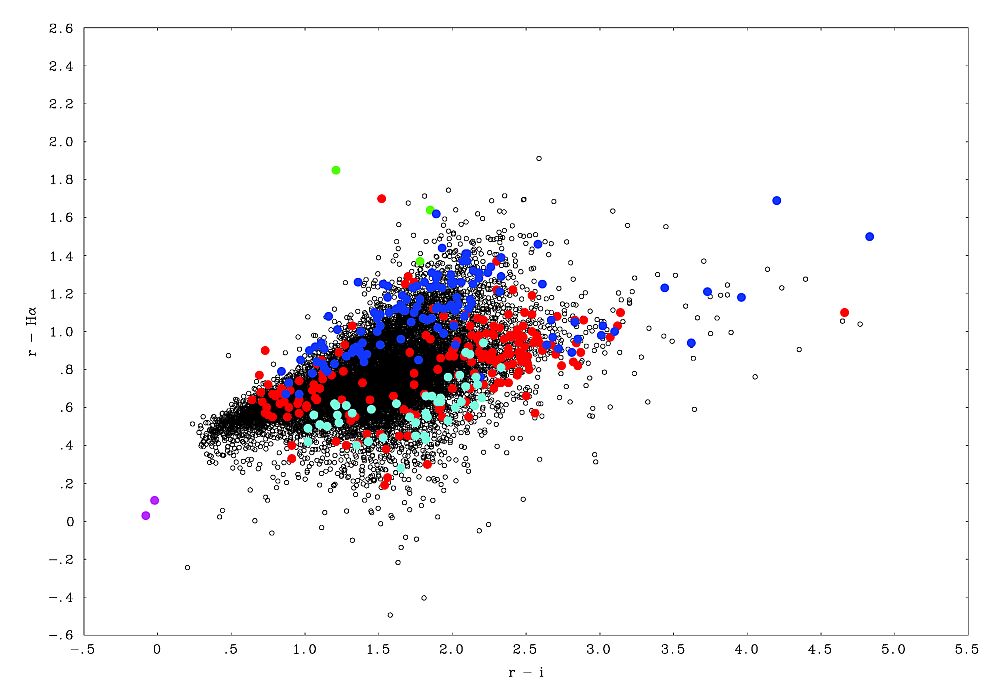
| Figure 4. Left-hand panel shows the simulated positions of the unreddened main sequence (black), giant (red) and supergiant (red) stars in the (r'–i',r'–Hα) plane according to spectral type. [ JPEG | TIFF ]. The right-hand panel shows the observed sources in a field in the Cygnus region (black points), with some spectroscropically determined spectral types overplotted in colour; light blue points are early-type stars, red points are mostly G and K stars, while dark blue points are M stars. The magenta points are strong Hα absorbers, in fact they are white dwarfs, while the green points are emission line stars, in fact Be stars. Note that the trend from early-type to late-type stars is well reproduced by the synthetic colours (there is a zero point offset due to extinction which drives stars diagonally upward and to right this diagram). The central gap in the spectroscopic sample is simply a selection effect due to the algorithm used to select targets for follow-up. All spectroscopy for this field was carried out using Hectospec on the MMT. [ JPEG | TIFF ]. | |
|
|
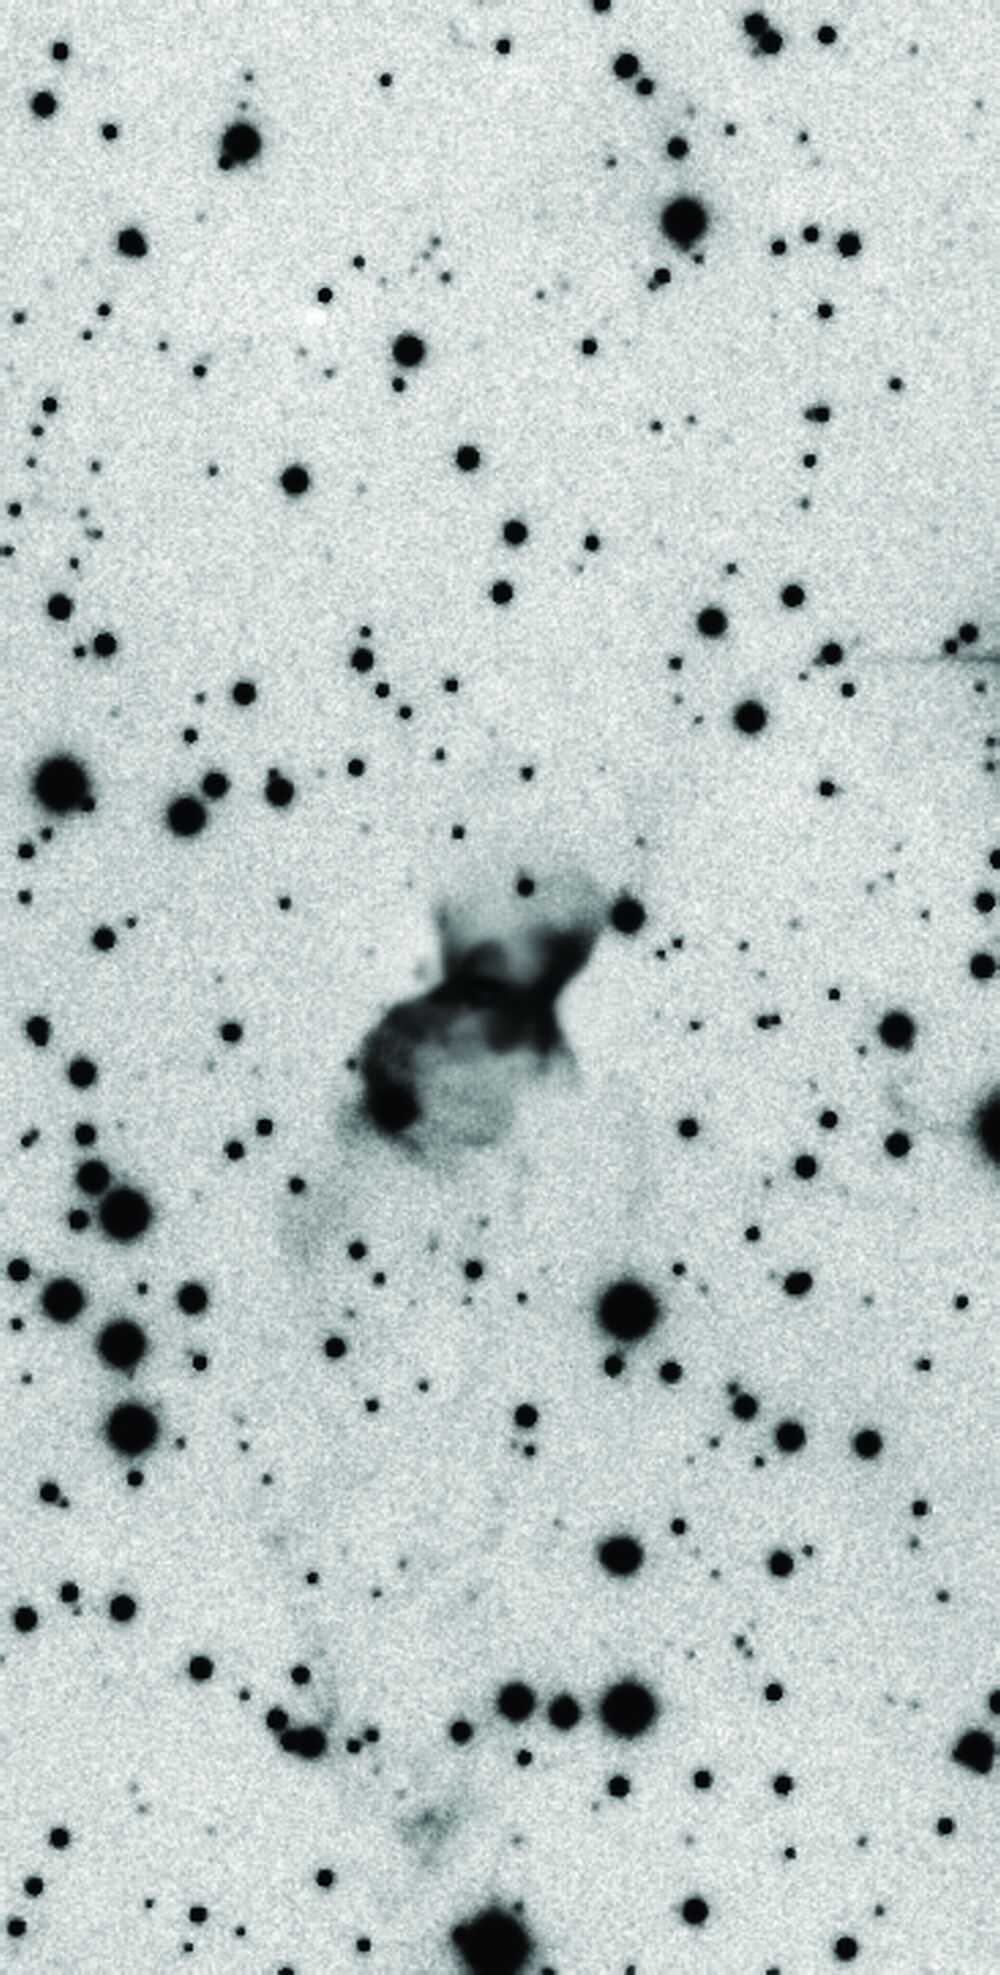
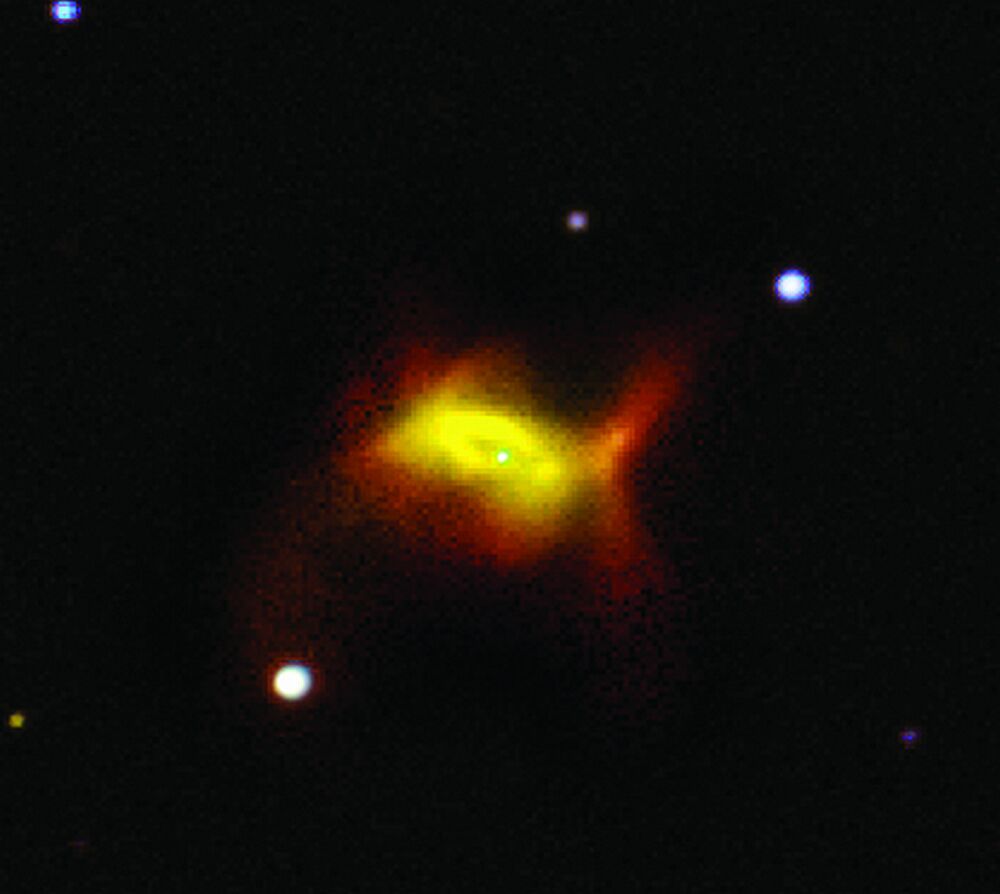
| Figure 5. Left: The newly discovered Planetary Nebula PN 126.62+1.32, the ‘Prince of Asturias’, is a rare quadrupolar nebula (central region), with extended fainter lobes extending over 16 arcminutes from the central star. [ JPEG | TIFF ]. Right: Publicity version of the discovery image. [ JPEG | TIFF ]. | |
|
| Figure 6. A 5°×3.5° mosaic of the supernova remnant S147 in Hα. North is to the top and East to the left. Courtesy of Albert Ziljstra and Jonathan Irwin. [ JPEG | TIFF ]. |
| ||
| Top | Back |
|
