The SAURON Deep Field: Investigating
the Diffuse Lyman-α Halo of “Blob1” in SSA 22
R. G. Bower1, S. L. Morris1, R. Bacon2,
R. Wilman1, M. Sullivan1, S. Chapman3,
R. L. Davies4, P. T. de Zeeuw5
1: Physics Department, University of Durham. 2: CRAL-Observatoire,
Lyon. 3: California Institute of Technology. 4: Dept. of Astrophysics,
University of Oxford. 5: Sterrewacht Leiden.
Recent
studies of star-forming objects in the early universe, measuring their
clustering properties and determining their luminosity functions, have
shown that these galaxies are key to understanding the star formation
and metal enrichment history of the universe and the role of galactic
“super-winds” in regulating the conversion of baryons into stars.
In this article, we describe how, using the SAURON integral
field spectrograph, we study the formation of the most massive galaxies
in the Universe. The primary target is the bright Ly-α emission line
halo in the conspicuous SSA 22 super-cluster at
z=3.07–3.11 (
Steidel
et al., 2000). The highly-obscured very luminous submillimeter
galaxy found by SCUBA near the centre of this halo probably is an example
of a forming massive elliptical galaxy (
Chapman
et al., 2001).
Using SAURON, we can map the three-dimensional velocity structure
of the SSA 22 ‘blob1’ halo. This allows us to probe the nature
of the ionised gas surrounding the SCUBA source, gaining insight into
the origin of the diffuse halo (is it primordial material infalling onto
the central object, or material expelled during a violent star burst),
the mass of its dark matter halo, and the energetics of any super-wind
being expelled from the galaxy. We can also trace the large scale structure
surrounding the central source, and investigate whether similar haloes
are surrounding other galaxies in the field. The answers to these questions
will allow us to understand how galaxy formation is regulated in massive
galaxies in the high-redshift Universe. They offer key insight into the
“feedback” process and will help explain why less than 10% of the baryon
content of the universe ever forms into stars (the “cosmic cooling crisis”;
Cen
& Ostriker, 1999;
Balogh
et al., 2001).
This is new ground for the SAURON instrument. Although it was
designed to study the dynamics and stellar populations of nearby elliptical
galaxies, we will show that it can very effectively be used to study
low surface brightness emission features only detectable in long integrations.
These observations offer a fore-taste of the deep field observations
that can be made with the VIMOS and MUSE integral field spectrographs
on 8m telescopes.
The Data-Cube
The SAURON instrument is a high throughput integral field spectrograph
(
Bacon
et al., 2001) that is currently operated on the William Herschel
Telescope. It was designed and built by a partnership between Lyon,
Durham and Leiden with the main objective of studying the dynamics and
stellar populations of early-type galaxies (
de
Zeeuw et al., 2002). It combines a wide field (41"×33" sampled
at 0.95") with a relatively high spectral resolution (4Å FWHM,
equivalent to σ = 100 km s
–1 in the target rest frame). The
instrument achieves this by compromising on the total wavelength coverage,
which is limited to 4810 to 5400Å. This spatial and spectral sampling
ensure that low surface brightness features are not swamped by read-out
noise. However, the limited spectral coverage means that it is only possible
to study the Ly-α emission from systems at redshifts between
z=2.95 and 3.45. Fortunately, the SSA 22 supercluster lies within
this redshift range. The sky background is devoid of strong night sky
emission in the Sauron wavelength range. For these observations, the SAURON
grating was upgraded with a VPH unit giving an overall system throughput
of 20%.
Sauron was used to observe the SSA 22 source for a total of
9 hours, spread over 3 nights in July 2002. The raw data was reduced
using the XSauron software. The extraction procedure uses a model for
the instrumental distortions to locate each of the spectra, and to then
extract them using optimal weighting. The extraction process takes into
account the flux overlap between adjacent spectra. To remove small flat-field
and sky subtraction residuals, a super-flat was created using the eighteen
30 min individual exposures. This procedure improved the flat field
accuracy up to 1% RMS. Each individual datacube was then registered to
a common spatial location using the faint star in the south east of the
field and then merged into the final data-cube. To produce the map of Ly-α
emission, we subtract the continuum, using a low order polynomial fit to
the full wavelength range. The end result is a 3-D (x, y, λ) map of the
Ly-α emission from the region.
Results
Three dimensional data of this type must be carefully visualised
in order to extract the maximum information from the data. We started
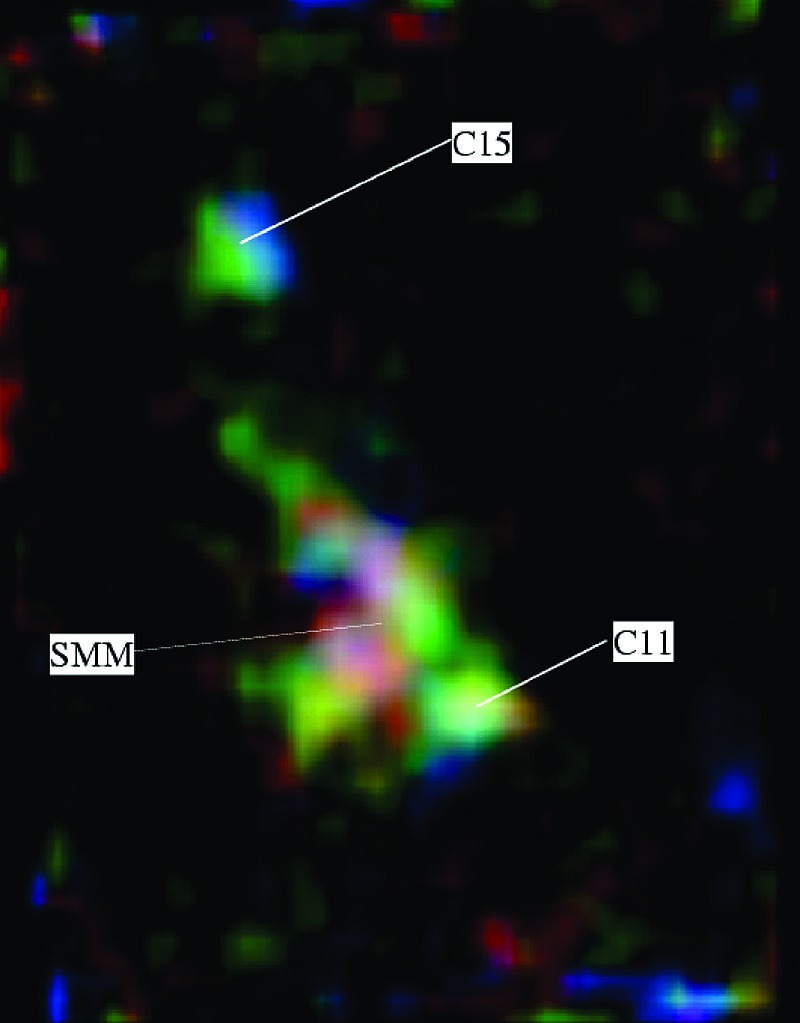
by creating a colour projection of the data cube shown in
Figure 1. In
this view, the red, green and blue colour channels have been created from
the data in the wavelength ranges 4976.05, 4964.75, 4988.70. Each channel
is 5.75Å wide (350 km s
–1 in the system rest frame). The
image has also been smoothed spatially with a Gaussian of 1" width. We have
marked the positions of the Lyman break galaxies, C11 and C15, identified
by
Steidel
et al. (1996) and the location of the sub-mm source identified
by
Chapman et al. (2003) (see below). The data-cube
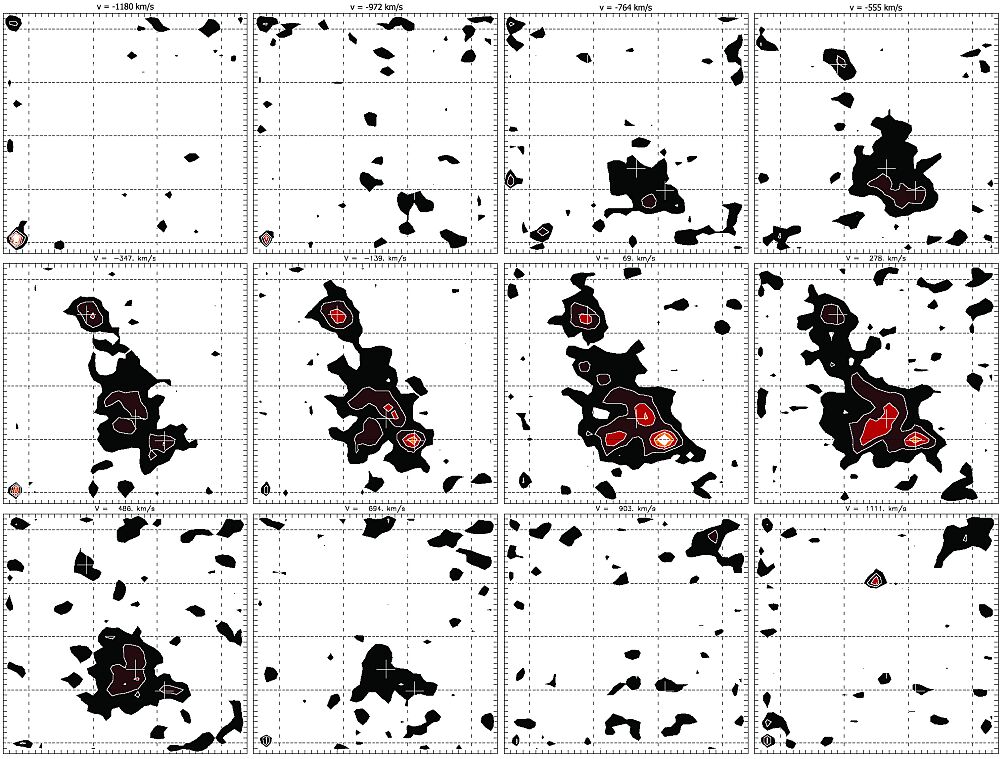
can alternatively be viewed as a sequence of wavelength slices as shown
in
Figure 2, or these slices can be combined together to make an animation.
|
Figure 1. A colour representation of
the wavelength shifts of Ly-α emission in the diffuse halo of SSA 22
‘blob1’. A simple interpretation of the image is that red, green and
blue channels represent the red-shifted and blue-shifted motions of
the ionised material in the halo. The positions of the two Lyman break
galaxies C11 and C15 are marked, along with the position of the submillimeter
source (SMM). The area shown is 37"×46". [ JPEG | TIFF ]
|
|
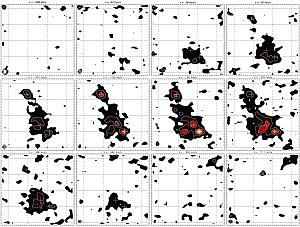
Figure 2. A sequence of contour plots
showing the changing morphology of the Ly-α emission at different wavelengths.
The velocity step between each map is 208 km s–1, with each
slice combining a 5.75Å wavelength range so that alternate panels
show independent data. Crosses mark the positions of Lyman break galaxies
and the submillimeter source. The grid squares have a spacing of 8".
[ JPEG | TIFF ]
|
Many striking structures can be clearly seen in the main halo.
The overall width of the emission is very broad (~1500 km s
–1
FWHM) but separate emission structures can be identified. If we interpret
the wavelength shift as a Doppler shift, the systems differ in velocity
by a few hundred km s
–1. There is significant velocity asymmetry
in the emission region around the Lyman break galaxy C11 and across the
main halo. The morphology of the diffuse emission also becomes clear in
these velocity slices: particularly interesting is the depression seen
near the centre of the halo (this is partially filled by redshifted emission),
and the diffuse extension of the halo towards the nearby Lyman break
galaxy C15. C15 itself is centred in a separate but much smaller halo.
There is a clear E–W velocity shift across this ‘mini-halo’. We discuss
each of these features below.
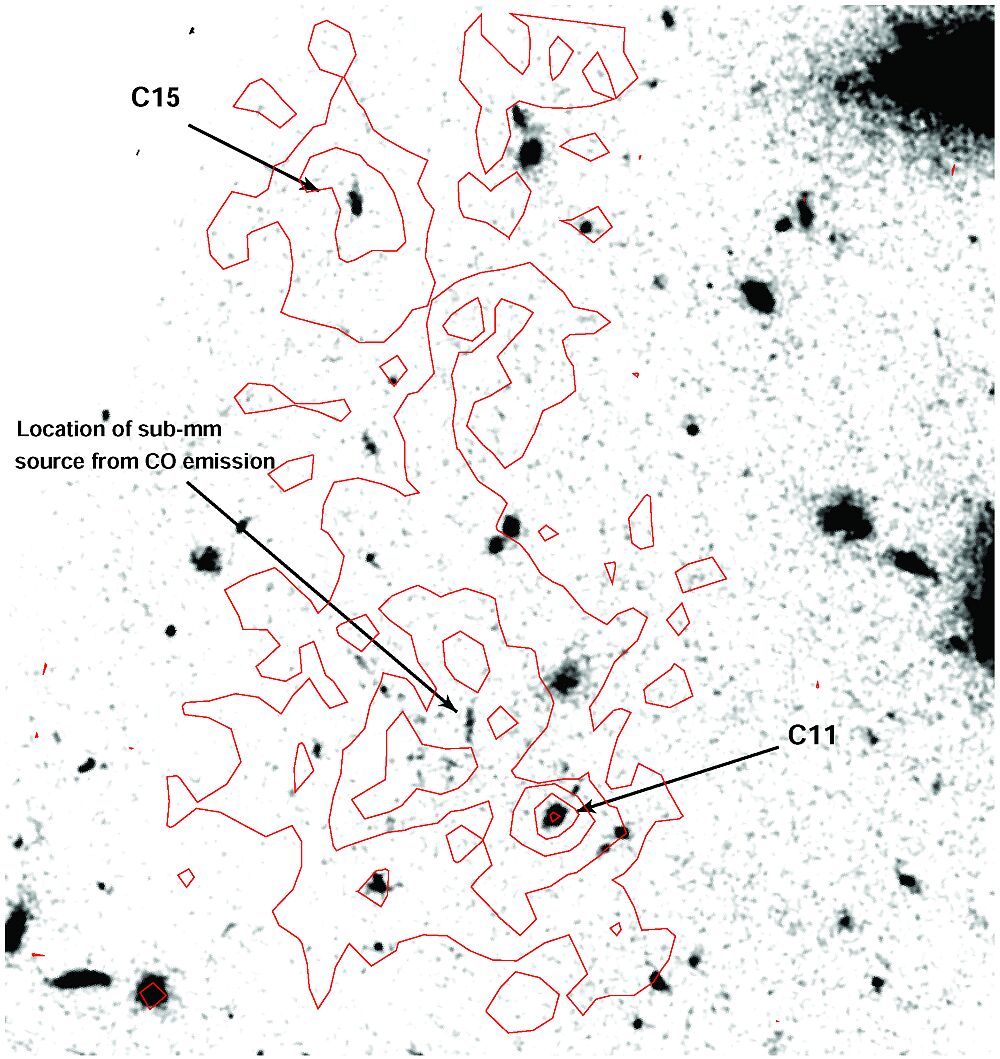
The optical counter-part of the sub-mm source has been identified
by Chapman et al. (2003) after detecting the associated CO emission.
To locate the emission relative to the SCUBA source more precisely,
we aligned the IFU data cube and the HST STIS image of Chapman et al.
using the locations of the alignment star and the Lyman break galaxies
C11 and C15.
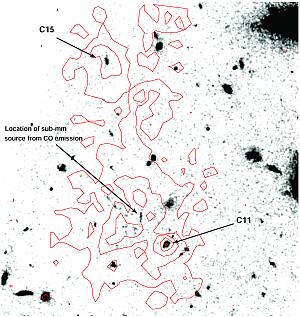
Figure 3 shows the STIS image overlayed with the contours of
the total Ly-α emission. This clearly shows the location of the sub-mm
source close to the centre of the ‘cavity’ in the emission structure.
|
Figure 3. A deep STIS image of the SSA
22 ‘blob1’ region showing the position for the SCUBA counterpart (Chapman
et al., 2003) relative to the total Ly-α emission (contours). The sub-mm
source may lie in a 3-D cavity in the emission (compare contours with
Figure 1). The Lyman break galaxies C15 and C11 are marked. Their distinct
haloes are clearly seen in the 3-D data set. [ JPEG | TIFF ]
|
Discussion
Below we divide our results into the separate features seen
in our data and discuss some ideas for how we might interpret them.
The interpretation is complicated because Ly-α is a resonant line. Thus
shifts in the feature can appear both because of genuine gas motion and
because photons diffuse in wavelength to escape from optically thick
regions. In what follows we assume that bulk motion is the dominant source
of line broadening.
- The main halo has a complex structure. Within the broad
emission, there are many halo components. The variations in line width
and velocity are inconsistent with a simple outflowing shell. The distribution
is better modelled by distinct gas components, moving relative to each
other with speeds of several hundred km s–1. One (certainly
naive) interpretation of the wavelength variations is that they reflect
the free motions of separate gas clumps bound in a common gravitational
potential.
- If the above were true, we could use the magnitude of
the velocity differences to infer the halo mass within ~75 kpc (or
10", the typical radius at which the clumps can be identified). If we
assume that the clumps are on random orbits with a line of sight velocity
dispersion of 500 km s–1, this suggests a mass of order
1.3×10¹³ M
 , as expected for a small cluster. It is likely, however,
that in fact the clumps have a net outflow or inflow, or are subject to
drag from the intergalactic medium (IGM). This makes the mass estimate
uncertain.
, as expected for a small cluster. It is likely, however,
that in fact the clumps have a net outflow or inflow, or are subject to
drag from the intergalactic medium (IGM). This makes the mass estimate
uncertain.
- Figure 3 shows the relative location of the emission-line
halo and the optical counterpart of the strong sub-mm source (Chapman
et al., 2001; 2003). The overlay suggests that the sub-mm source
may be located at the centre of a ‘cavity’ in the Ly-α emission. There
are several possible interpretations of this cavity. (1) It may be a genuine
cavity in the ionised gas distribution. This might be evidence for a strong
wind being blown away from the central sub-mm source. This would obviously
not be consistent with the more distant material being discrete gas clumps
moving on orbits with their motion dominated by the gravitational potential.
(2) The cavity may occur because the ionised gas in this region contains
significant dust. As the Ly-α diffuses out of the region, it is strongly
extincted. This would be consistent with redshifted emission being seen
in this location (this wavelength is not resonantly scattered). This explanation
is appealing since we know that the central SCUBA source has high extinction.
(3) It is possible that we are seeing the optical equivalent of Wide Angle
Tail radio sources, where line emission is coming from poorly collimated
outflows from a central galaxy, which are then decelerated by the IGM, while
the central source moves on through the IGM.
- The two other Lyman break galaxies embedded in the structure
appear to have dynamically distinct haloes. This is particularly clear
for C15, to the north of the main halo. Indeed there is faint emission
that bridges between C15 and the central halo. A similar feature can also
be discerned around C11. This is a surprising discovery that leads us
to consider whether other Lyman break galaxies would also have extended
Ly-α haloes.
- The mini-halo around the C15 Lyman break galaxy has its
own characteristic velocity shear pattern. We can identify the morphology
of this galaxy from the STIS imaging of Chapman et al. (2003). C15 is
elongated at roughly 60 degrees (Figure 3) to the velocity shear seen
in Ly-α. This, together with the morphology of the emission, makes it
unlikely that the shear reflects the rotation of a conventional gas disk.
Instead, the shear pattern is reminiscent of the super-wind outflows predicted
from proto-galactic disks (Springel
& Hernquist, 2002), and observed (on a smaller scale) in local
starburst galaxies such as M82.
Next Steps
These observations clearly demonstrate the ability of deep integral
field spectroscopy to detect low surface brightness emission from distant
galaxies in the early universe. They give us fascinating insight into
the nature and structure of the ionised halo of SSA 22-1. It is interesting
to now see how far this powerful new technique can be taken. On the one
hand it is fundamental to establish whether the diversity of structure
seen in SSA 22-1 is a generic property of other highly luminous sub-mm
galaxies, or whether the deep potential well of the SSA 22 super-cluster
is necessary to produce emission of this luminosity and extent. It will
also be important to determine whether other Lyman break galaxies show
mini-haloes similar to C15.
Our observations with the SAURON spectrograph also lay out a
path for forthcoming integral fields units. For example, OASIS, an adaptive
optics optimised integral field spectrograph, could be used to complement
SAURON by studing the higher surface brightness emission line regions
in greater detail. The MUSE spectrograph being designed for the VLT
will offer the ideal combination of all these instruments providing a
combination of wide-field coverage, good spatial resolution and optimal
spectral resolution.
Acknowledgments
We thank the SAURON instrument team for their support of this
program, and for creating an instrument with the superb sensitivity
of SAURON. RGB acknowledges the support of the Leverhulme foundation.
¤
References:
- Bacon et al., 2001, MNRAS, 326, 23. [ First citation in text | ADS
]
- Balogh, Pearce, Bower & Kay, 2001, MNRAS, 326,
1228. [ First citation in text | ADS
]
- Cen & Ostriker, 1999, ApJ, 519, L109.
[ First citation in text | ADS
]
- Chapman, et al., 2001, ApJ, 548, 17. [ First citation in text | ADS
]
- Chapman et al., 2003, in prep. [ First citation in text ]
- de Zeeuw et al., 2002, MNRAS, 329, 513. [
First citation in text | ADS
]
- Springel & Hernquist, 2003, MNRAS, 339,
289. [ First citation in text | ADS
]
- Steidel, Giavalisco, Dickinson, Adelberger, 1996, ApJ,
462, L17. [ First citation in text
| ADS
]
Email contact: Richard
Bower (
r.g.bower@durham.ac.uk)