SLODAR: Profiling Atmospheric Turbulence
at the WHT
Richard Wilson, Christopher Saunter (University of Durham)
A
new method for measuring the altitude and velocity of turbulent layers in
the atmosphere —which cause the astronomical seeing and scintillation or
‘twinkling’ of the stars— has been demonstrated at the WHT. SLODAR (SLOpe
Detection And Ranging) is a triangulation method, in which the turbulence
profile is recovered from observations of bright binary stars using a Shack-Hartmann
wavefront sensor.
In the past, astronomers have been concerned only with the overall effects
of the turbulence, in terms of the resulting image spread or ‘seeing angle’
(FWHM for a point source) at the telescope focus. However with the advent
of adaptive optical correction for astronomy, measurements of the changing
atmospheric turbulence structure are of increasing importance.
The altitude distribution of the turbulence determines the corrected or ‘isoplanatic’
field of view for adaptive optics (AO). High altitude layers reduce the isoplanatic
angle, since for these layers the wave-front aberrations measured in the
direction of the AO guide star will not coincide perfectly with the aberrations
at off-axis field-angles.
The velocities of the turbulent layers are also important, since these determine
the rate of change of the seeing aberration at the telescope, and hence the
temporal bandwidth of the AO control system required to achieve effective
image correction.
SLODAR is a highly automated system which can provide real-time data for
optimising and calibrating observations with AO. More details of the method
and instrument can be found at the Durham astronomical instrumentation website:
http://aig-www.dur.ac.uk/fix/projects/slodar/res/wht.html
Figures
1 and < a href="#figure2">2 show SLODAR results for April 15th and 16th, both recorded
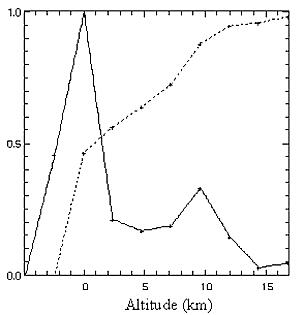
in excellent seeing (0.45 arcsec), but with contrasting turbulence profiles.
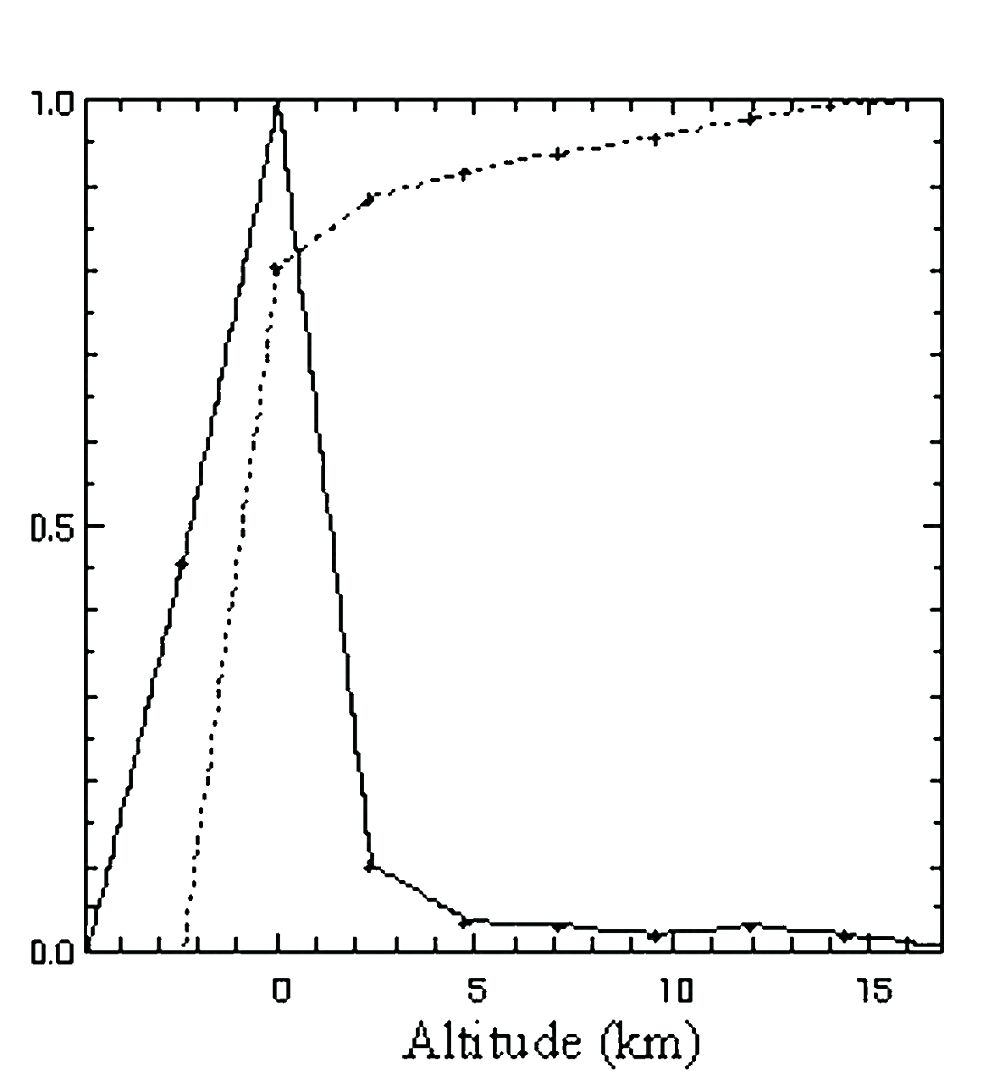
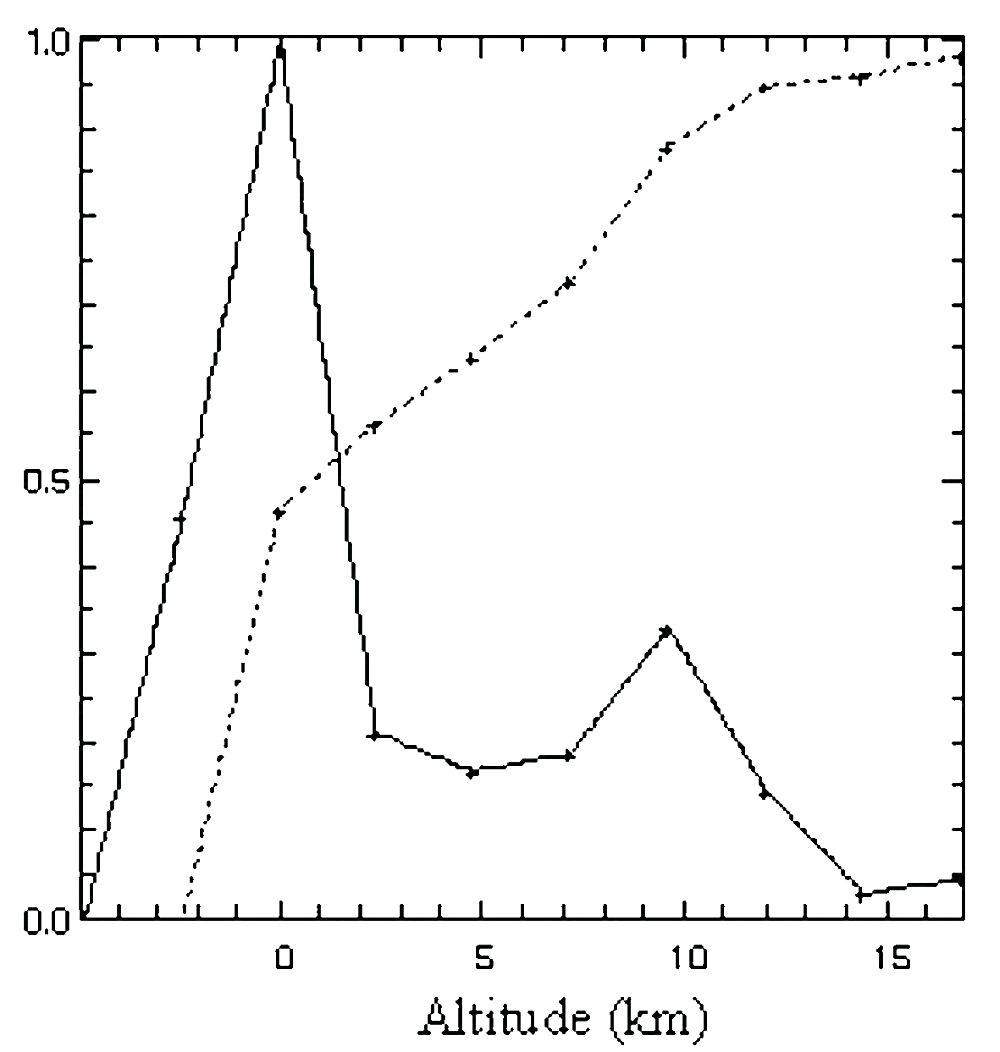
The conditions on April 15th were dominated by ground-level turbulence, whereas
significant turbulence at higher altitudes was present on the 16th. Hence
although the overall seeing was the same for the two nights the conditions
for AO were different. The isoplanatic angle was very large on April 15th,
but was reduced on the 16th by the presence of the high altitude turbulence.
¤
|
|
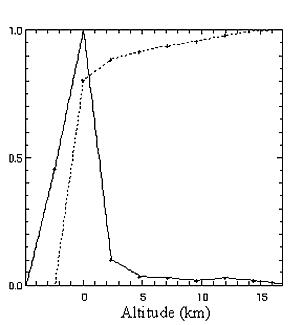
| Figure 1. Normalised profiles of the
strength of optical turbulence versus altitude for April 15 21:38 UT (left)
[ JPEG | TIFF
] and April 16 20:45 UT (right), 2003 [ JPEG
| TIFF ].
|
|
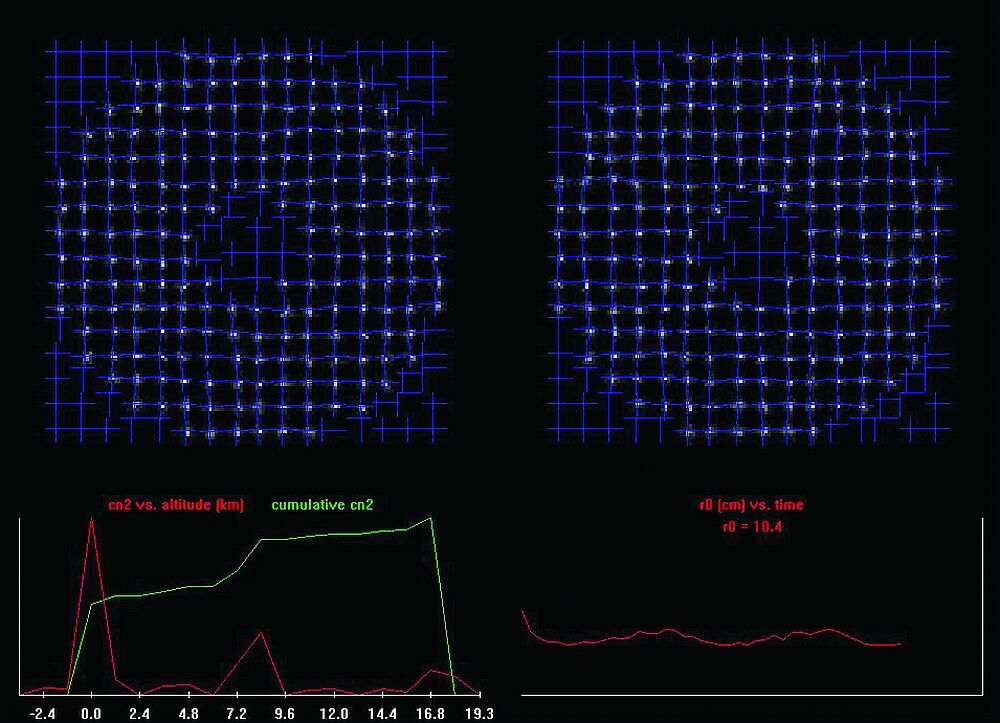
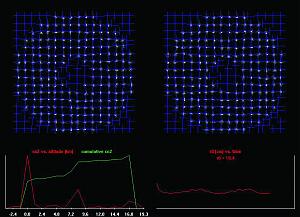
| Figure 2. Snapshot of the WHT SLODAR system graphical
user interface, showing the Shack-Hartmann spot patterns for a binary star,
and real-time plots of the turbulence-altitude profile and the integrated
turbulence strength versus time. [ JPEG | TIFF ]
|
Email contact: Richard
Wilson (
r.w.wilson@durham.ac.uk)