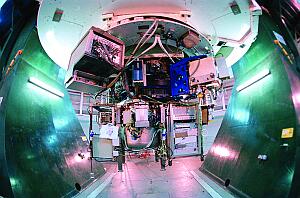
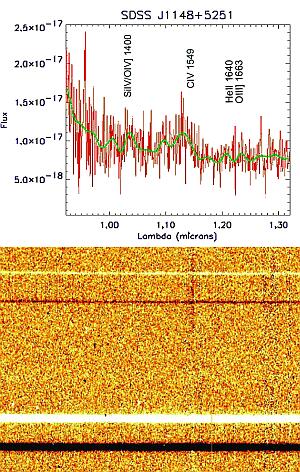
Left: Picture of the near-infrared imager and spectrograph LIRIS mounted on the Cassegrain focus of the William Herschel Telescope. Right: LIRIS two-dimensional spectrum of the most distant QSO at z=6.41 (top row). The extracted spectrum is shown in the top panel. A fit to the spectrum is also shown, where several broad emission lines are identified. The most intense feature is the CIV line, detected with a S/N ratio of 10. The spectrum is the co-addition of 5 frames of 850s exposure time each, giving an approximate total time of 70 min. (see article by J. A. Acosta Pulido et al.). [ JPEG 1 | TIFF 1 | JPEG 2 | TIFF 2 ]
|


