Linearity
The plot below shows the ADU per second and per pixel (normalized) as a
function of the median
value of counts per pixel in the detector. Non-linearity is ~2% over
the range 0-12000 ADU (in the post-pre). This implies an uncertainty of
about 0.02mag in your data if you are observing within that range of
counts.
Currently no linearity correction is applied to the INGRID data.
Therefore, select carefully your exposure time so that the level of
counts of the sky and your sources is below ~12000 ADU.
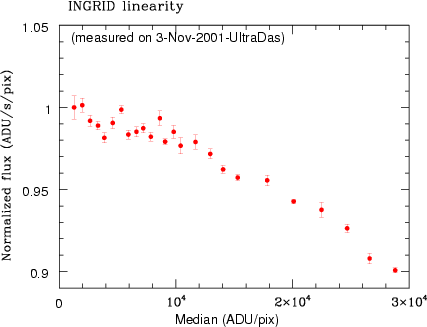
NOTE: Each point in the figure above was obtained by
averaging a set of
seven dome flats, obtained via the 'multrun' command, each set having a
fixed exposure time. Two series of such sets were taken so that the
exposure time of each multrun was increasing through the first,
decreasing through the second. Moreover, the two series were mixed up
(1s,16s,3s,14s ... 4s,13s,2s,15s) in order to average out any possible
influences of the lamp's intensity variations on the global trend of
the
curve. However, each single data point could still be affected by these
variations, and the peaks in the normalized flux at low counts might be
due to this.
The linearity has not changed since November 2001 (last measurement
done in November 2005).


