 | |||
|

| Home > Astronomy > AutoFib2 > Throughput |
|
| |||
|
| Home > Astronomy > AutoFib2 > Throughput |
ThroughputAF2+Wyffos Throughput The throughput of AF2/WYFFOS was measured during February
and May 2013, for the following grating / CCD combinations:
R300B /
Red+4;
R316R /
Red+4 (observation of a B2 IV star);
and R316R /
WHTWFC (observation of an sd0 star).
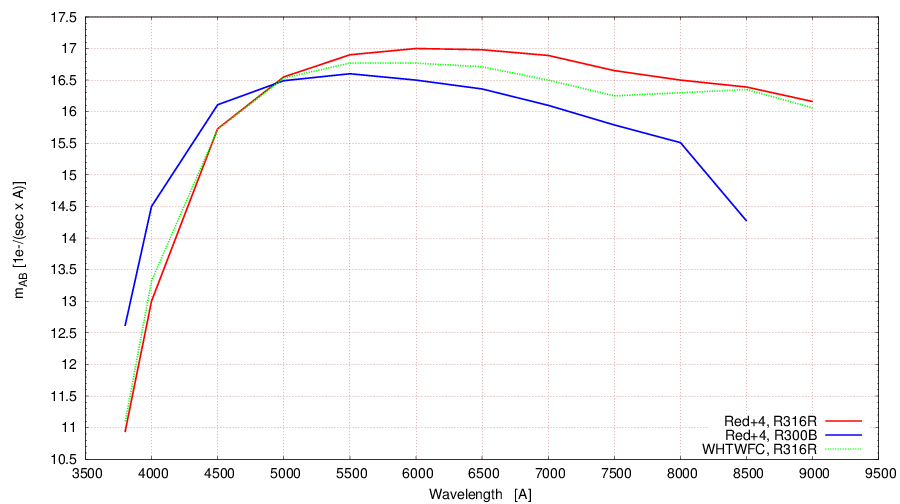
The table and figure below show, as a function of wavelength, the measured
mAB zeropoints, i.e. the AB magnitude of a star giving
1 electron per second per Angstrom when observed at zenith.
The mAB zeropoints have been normalized to the median fibre throughput.
Aperture correction
The aperture correction depends on the seeing, and on the accuracy with which the stellar image is centred on the fibre aperture. For Moffat-profile seeing, the aperture correction can be calculated from the plot on the AF2 target-acquisition page. For the measurements with the Red+4 detector, the accuracy of centring the star on the fibre was ensured to be < 0.2 arcsec by making a spirally-rastered series of observations with step 0.4 arcsec, and using the observation with the highest throughput (also coincident with the peak in the distribution of intensities, i.e. not due to a short-term seeing fluctutation). The Moffat-profile plot shows that in seeing of 1.0 arcsec, with a centring error of 0.2 arcsec, only a fraction 0.03 of the light will be missed by the 1.6-arcsec fibre aperture. For the measurements with the WHTWFC, the accuracy of centring is probably ~ 0.4 arcsec, since the highest-flux image was selected from a cross-pattern series of observations with step 0.8 arcsec. This corresponds to a loss of up to ~ 0.14 of the light.
Other errors in measured zeropoint
Comparison of observed and expected AF2/WYFFOS throughputs
The predictions of counts made by ING's exposure-time calculator, SIGNAL, are based on the on-sky measured zeropoints reported on this page (not on a priori expectations about the throughput of individual components). Comparison between Red+4 and WHTWFC zeropoints
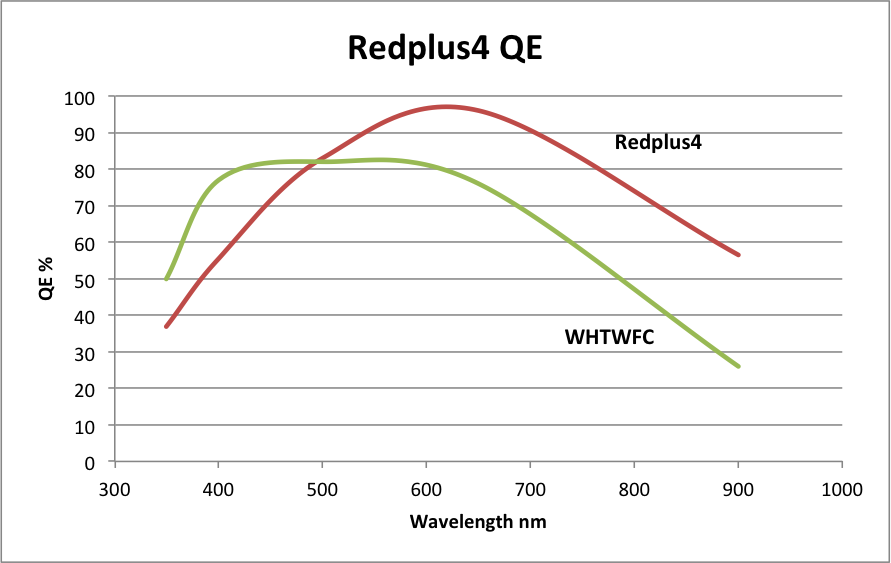
(1) At wavelengths blueward of 5000 Å, the WHTWFC (green curve) should be ~0.1 mag more sensitive than Red+4 (red) at 4500 Å and ~0.3 at 3800-4000 Å. In the latter wavelength region, this is clearly not the case. However, as pointed out earlier, the errors in measuring zeropoint are likely to be higher in the far blue, and different fibres were used for the measurements (#30 for Red+4, #02 for WHTWFC), so some fibre-specific chromatic anomaly could be responsible for the discrepancy. Pending further on-sky investigation, we advise observers that at wavelengths bluer than 4500 A, the WHTWFC probably will have a small QE advantage over Red+4. (2) At wavelengths >7500 Å, the curve for the WHTWFC detector (green) in Fig. 1 rises, rather than falling, the latter being expected from the wavelength dependence of grating efficiency and CCD QE. This behavior was also seen when the throughput of WHTWFC was last measured, in 2004. The cause is unknown.
Zeropoints for other gratings
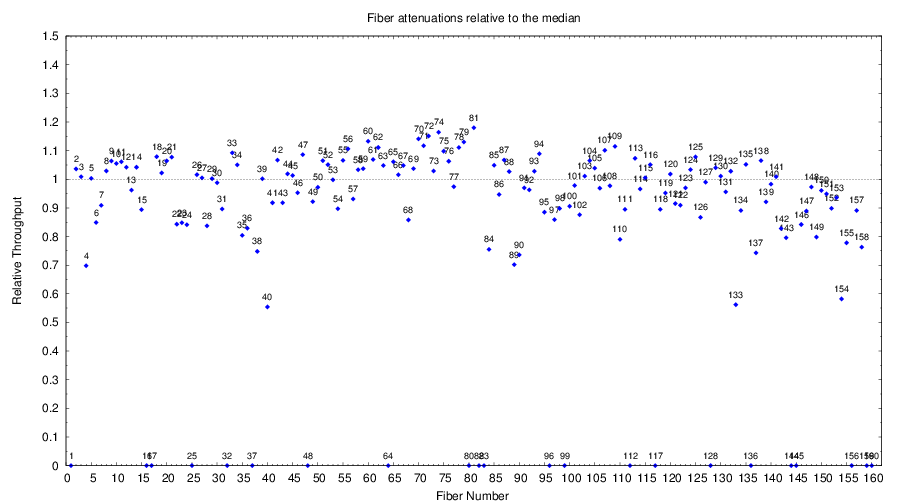
Relative throughput of fibresThe relative throughput of the science fibres was measured in February 2013 with the WHTWFC detector, and is plotted in Figure 2 against fibre number. Fibres with zero throughput are disabled, i.e. cannot be configured for observing.
The measurements were obtained with the fibres configured in a circle, illuminated by sky, and are based on the mean observed intensity in the wavelength range ~4200Å to 9000 Å. The list of relative throughputs plotted in Fig. 2 can be downloaded from here. More information about the fibres can be found on the AF2 fibres page. |
| Top | Back |
|
