 | |||
|
| Home > Astronomy > ACAM > ACAM CuAr arc maps |
ACAM CuAr arc maps
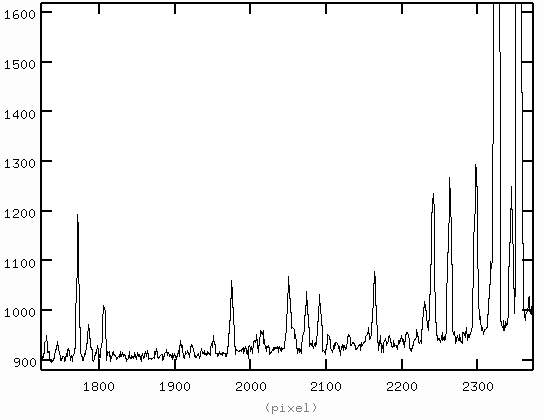
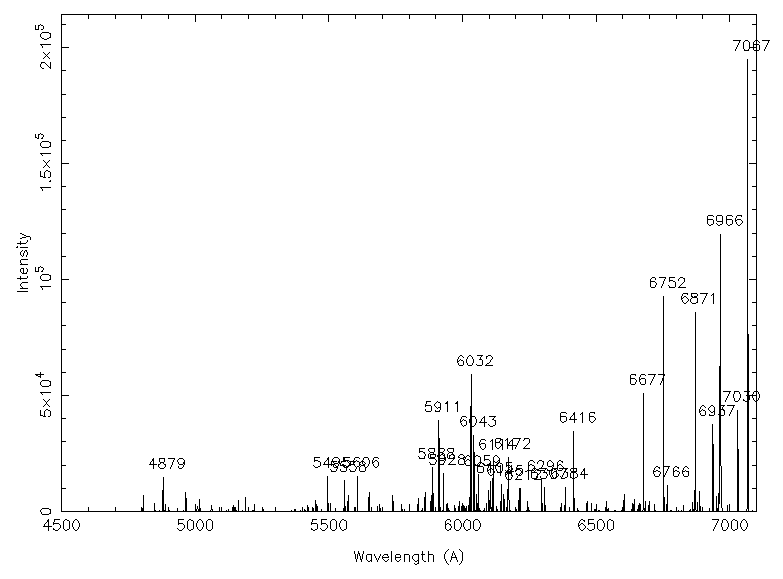
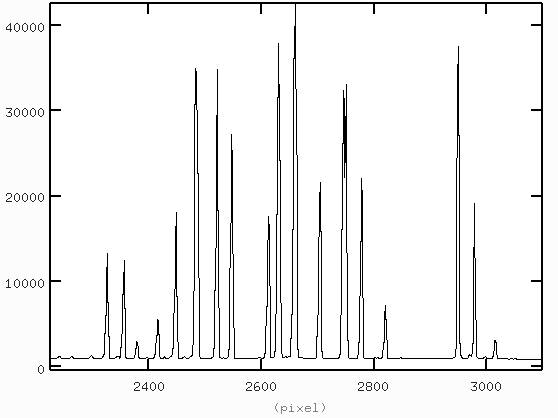
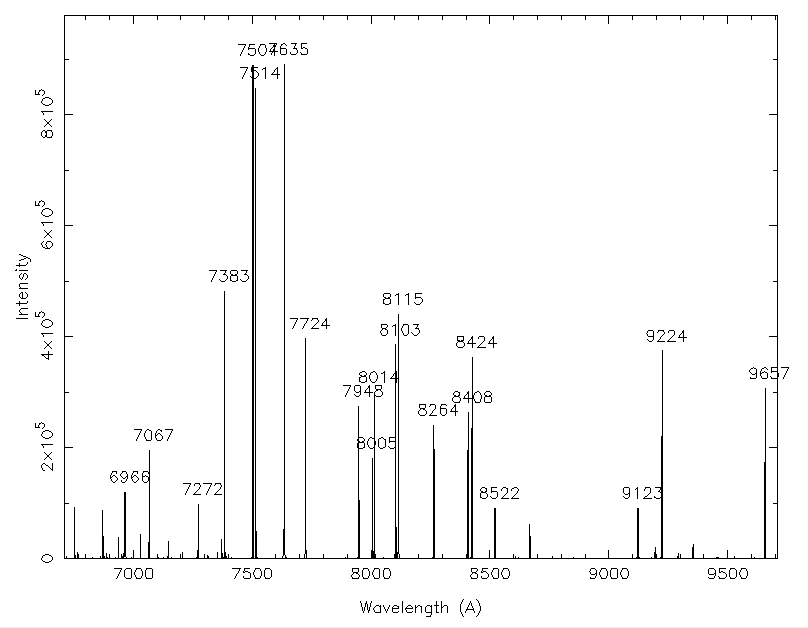
The plots below aid identification of the lines
seen in CuAr arc exposures (the annotated wavelengths are approximate).
Arc maps for CuNe are also available. Additional line identifications can be found in the arc-lamp maps for the ISIS blue and red arms (La Palma technical notes 125 and 126). (1) Blue end of ACAM spectrum, ~ 4500 - 7000 A:
Expected arc lines (data obtained with a different ING instrument):
(2) Red end of ACAM spectrum, ~ 6700 - 9700 A:
Expected arc lines:
|
| Top | Back |
|


