FU Orionis objects are a class of young stars with powerful bursts in luminosity that show evidence of accretion and ejection activity. It is generally accepted that they are surrounded by a Keplerian circumstellar disk and an infalling envelope. The outburst occurs because of a sudden increase in the accretion rate through the disk. In this scenario, all young stars experience FU Ori phases during their evolution. Despite the evidence of winds/outflows and accretion activity in these objects, a detailed study of their physical properties has been difficult to carry out with high-resolution instruments manly due to the faintness and the distance to these objects.
Using the integral field spectrograph OASIS, at the William Herschel Telescope, combined with the adaptive optics module NAOMI, astronomers obtained optical observations of the FU Ori star V1515 Cyg with an angular resolution of 0.7 arcseconds (Gaussian core FWHM). From the analysis of the data they find evidence for the existence of a surrounding disk in V1515, being this one of the few spatial inferences of a disk observed in an FU Ori object.
They applied a spectro-astrometry technique to both spatial directions. A two-dimensional circular Gaussian was fitted to each image of the data cube, with a Levenberg-Marquardt algorithm. The wavelength-dependent Gaussian centers and Gaussian full width at half maximum (FWHM) are the spectro-astrometric signal. Figure 1 shows, for one of the individual exposures, the detected spectro-astrometric signal in the spatial directions for the spectral region around the Hα 6562Å line. A small spectro-astrometric signal is detected in the horizontal direction. However, considering the error bars, the signal in the vertical direction is clearly detected at blueshifted velocities of ∼-100 km s-1.
 |
For the first individual exposure, Gaussian centers of the spectro- astrometric signal as a function of the velocity in both the W-E (east for ΔX > 0) and S-N (north for ΔY > 0) directions, in top and middle panels, respectively. Bottom panel shows the differential FWHM. The Hα line profile is overplotted in blue showing a clear P Cygni profile
[ GIF ].
|
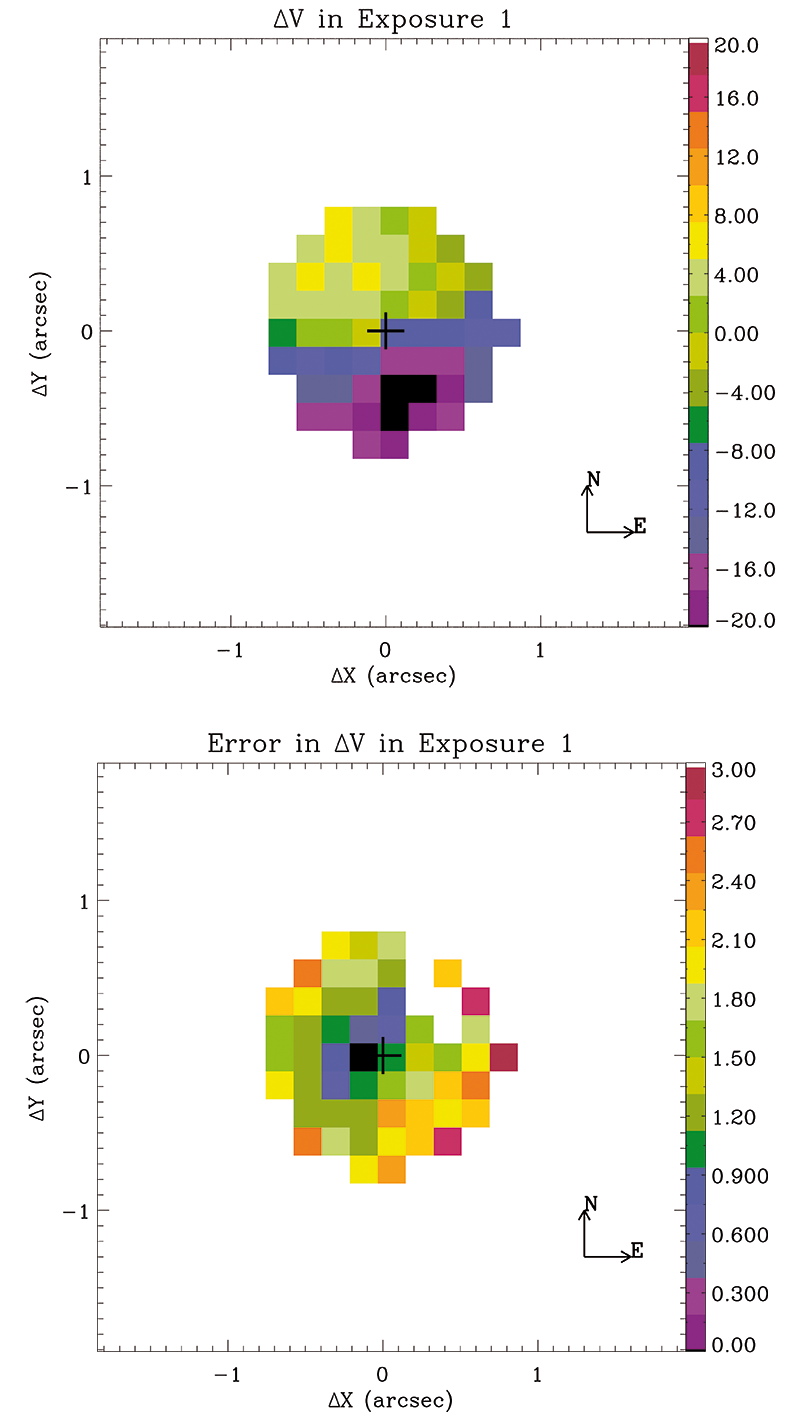
In order to ruled out the possibility of a bias due to a deficient wavelength calibration, a model fitting between each spectrum in the field and the one at the stellar position was carried out. The top panel in Figure 2 shows the spatially distribution of the measured shift for the same exposures as in Figure 1. A clear structure is seen in the center of the field with an approximate size of ∼2 arcseconds in both spatial directions.
The astronomers identify two clear distinct regions, one showing redshifted velocities and the other blueshifted, almost symmetrical to the previous one.
This structure, similar to 12CO observations in several T Tauri stars suggests scattering coming from a disk surrounding the star.
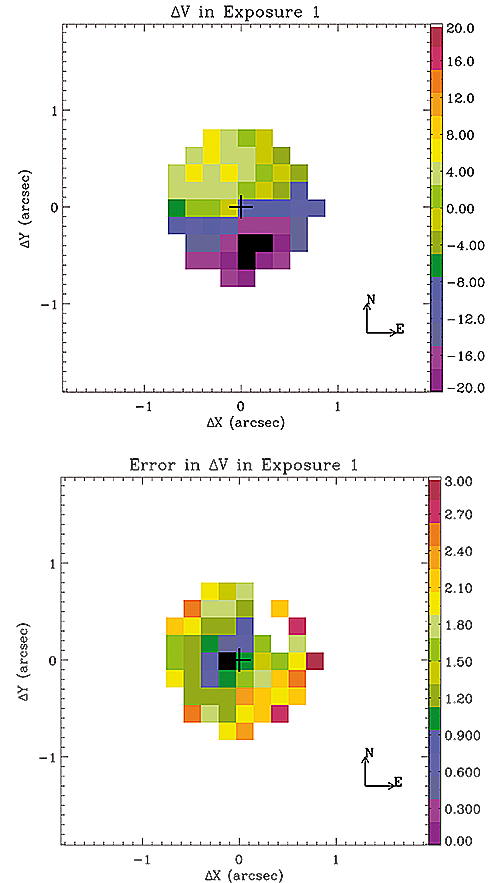 |
Top: shift in velocity obtained from a cross-correlation of the P Cygni profile between the spectrum at the position of the star and each individual spectra in the field, for exposure 1. Color scale is km s -1. The continuum emission center is marked as a black cross. The physical orientation is also given. Bottom: error in the shift also in km s -1 [ PNG ].
|
More information:
V. Agra-Amboage and P. J. V. Garcia, 2014, "Spectro-astrometry of V1515 Cygni",
A&A,
565, A92.
Paper.