We describe results from our study of a sample of spiral galaxies of a
wide range of Hubble types on the basis of near-IR imaging obtained with
INGRID on the WHT. We focus on the determination of bar torques, or bar strengths,
from our images, and show that this bar strength only very weakly correlates
with de Vaucouleurs bar type, or with bar axis ratio.
1. INGRID on the WHT
INGRID, the near-IR (NIR) camera for the WHT, has been in routine operation
at the Cassegrain focus for almost two years now. In the three semesters
from August 2000 until January 2002, it has been in scheduled use for 37,
35, and 35 nights (including NAOMI science runs, excluding commissioning and
service), or 20% of the time. This makes INGRID the second-most used instrument
on the WHT, after ISIS. The scientific areas that have been attacked with
INGRID span an enormous range, from observational cosmology to brown dwarfs
and giant planets. INGRID’s main attraction is the relatively large field-of-view,
of just over 4 arcmin, coupled with a pixel size of 0.24 arcsec which samples
all except the very best seeing conditions. Here, we present results obtained
from a number of PATT-supported observing runs, aimed at imaging nearby and
relatively face-on spiral galaxies.
2. Barred Galaxies
One of the main attractions of observing in the NIR is that one is much
less susceptible to the attenuation of emission by dust. Compared to the
visual (V-band), extinction by dust is a full order of magnitude less in
the NIR K-band, at 2.2 microns. Since at rest wavelength (i.e., in nearby
galaxies) the NIR light also traces a relatively old stellar population,
NIR imaging is the technique of choice to observe the “stellar backbone”
of galaxies: the old stellar population which, by assumption of a mass-to-light
(M/L) ratio, will give an estimate of the mass. We imaged a complete sample
of 57 galaxies with INGRID for this reason: to study the old stellar component,
not affected by dust extinction. In one of the lines of our overall project,
the INGRID Ks imaging will be compared with B and R broad- band images, as
well as with narrow-band Hα images which trace young, massive stars and current
star formation. This comparison can indicate how mass and star formation
are concentrated in spiral arms, and why they are concentrated to a different
degree.
In this short article, though, we will focus on bars in galaxies. About
75% of all disk galaxies have bars (
Sellwood
& Wilkinson, 1993;
Knapen,
1999), where stars move on elongated periodic orbits and thus support
a non-axisymmetric potential. Gas in bars shocks and loses angular momentum,
which implies that bars form a mechanism to transport material inward in
a rotationally supported galactic disk. This explains why bars are relevant
for questions related to the origin, evolution, and maintenance of stellar
and non-stellar activity in or around the nuclei of galaxies: massive black
holes, AGN or (circum)nuclear starbursts all need fuel to maintain their
activity and whereas enough gas is available in the disk at large, moving
this gas inwards implies making it lose a considerable amount of angular
momentum.
NIR imaging is the best way of finding and classifying bars. At optical
wavelengths, the bar may be masked by the combined effects of emission from
young stars, and extinction by dust. There are a number of well-known and
spectacular examples of bars which are unrecognisable in the visible, but
well-defined in the NIR (e.g.,
Block
& Wainscoat, 1991;
Block
et al., 1994). However, statistical studies (e.g.,
Mulchaey
& Regan, 1997;
Knapen,
Shlosman & Peletier, 2000;
Eskridge
et al., 2000) have shown that the overall bar fraction only goes up by
10–15% in the NIR as compared to classification from optical imaging. Still,
the NIR is much preferred for any detailed and/or quantitative studies of
bars, because the bar parameters can be measured much more cleanly there than
in the optical.
3. Determining Bar Strength
Of the main structural parameters of bars: length, axis ratio, luminosity
distribution, and strength, the latter has proved to be by far the most elusive
observationally. Theoretically, bar strength can be defined rather easily
as some measure of the ratio of non-axisymmetric, or tangential, over axisymmetric
gravitational force. Observationally, bar “strength” has often been measured
as bar ellipticity, or axis ratio, but this is strictly speaking incorrect.
This is easy to illustrate by imagining a very elliptical bar in a galaxy
which also has a massive bulge. In that case, the net gravitational pull
felt by a particle (be it gaseous or stellar) in the bar will be that caused
by the bar, but offset significantly by the axisymmetric gravitational pull
of the bulge. Thus, the net bar strength in that case can be much less than
in the case of a less elliptical bar in a bulge-less galaxy.
A quantitative observational measure of bar strength has recently been
developed by
Buta
& Block (2001), based on an old of idea of
Combes
& Sanders (1981). Buta & Block calculate the maximum, Q
b,
of the ratio of the tangential force to the mean axisymmetric radial force.
Technically, this is done by a Fourier analysis of deprojected images, under
the assumption of a constant mass-to-light ratio. This means that the observational
input data must be NIR images with a high signal-to-noise ratio, which in
turn implies a preference for bright, thus nearby, galaxies. This is where
INGRID is ideal: the 4.2-m WHT mirror ensures a high S/N ratio, whereas the
field of view of 4.2 arcmin facilitates the imaging of disks of nearby galaxies.
We thus derived bar strengths, Q
b, for those galaxies in
our sample of 57 galaxies where this could be determined (45 of them, the
images of the others are not of high enough S/N ratio).
The galaxies in our sample were selected to have an angular diameter of
more than 4.2 arcmin and an inclination of less than 50 degrees. Our sample
covers the complete range in Hubble type for spiral galaxies, as well as
in Elmegreen spiral arm class (
Elmegreen
& Elmegreen, 1987), from flocculent to grand-design. As an example,
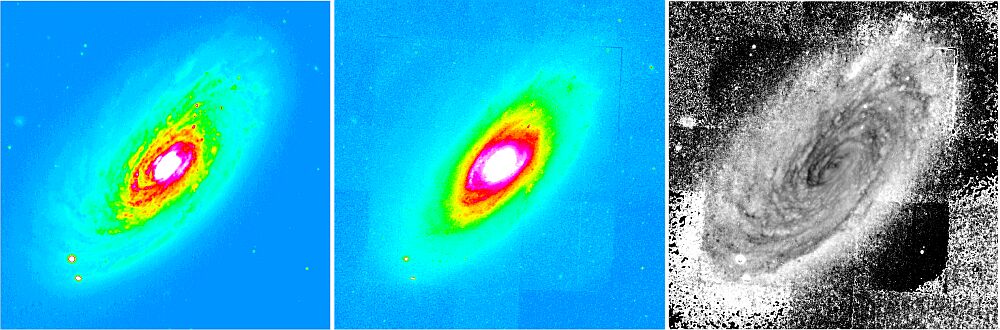
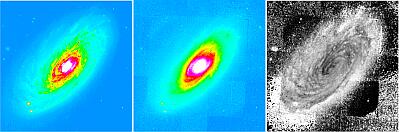
we show, in Figure 1, V and Ks-band images of the SA(rs)b galaxy Messier 88
(NGC 4501), where the V-band image was obtained with ING’s 1-m JKT. This Ks-band
image is one of our deepest, with a total on-source integration time of over
one hour. The V–Ks colour index image clearly shows the location of the star-forming
spiral arms (as lighter shades) and the dust lanes which accompany them (darker).
|
Figure 1. V, Ks, and V–Ks colour index images
of the SA(rs)b galaxy Messier 88 (NGC 4501), as obtained with INGRID on the
WHT and with the JKT. The field of view of the images is ~7 arcmin, but only
the central 4 arcmin is shown here. [ JPEG |
TIFF ]
|
4. Results
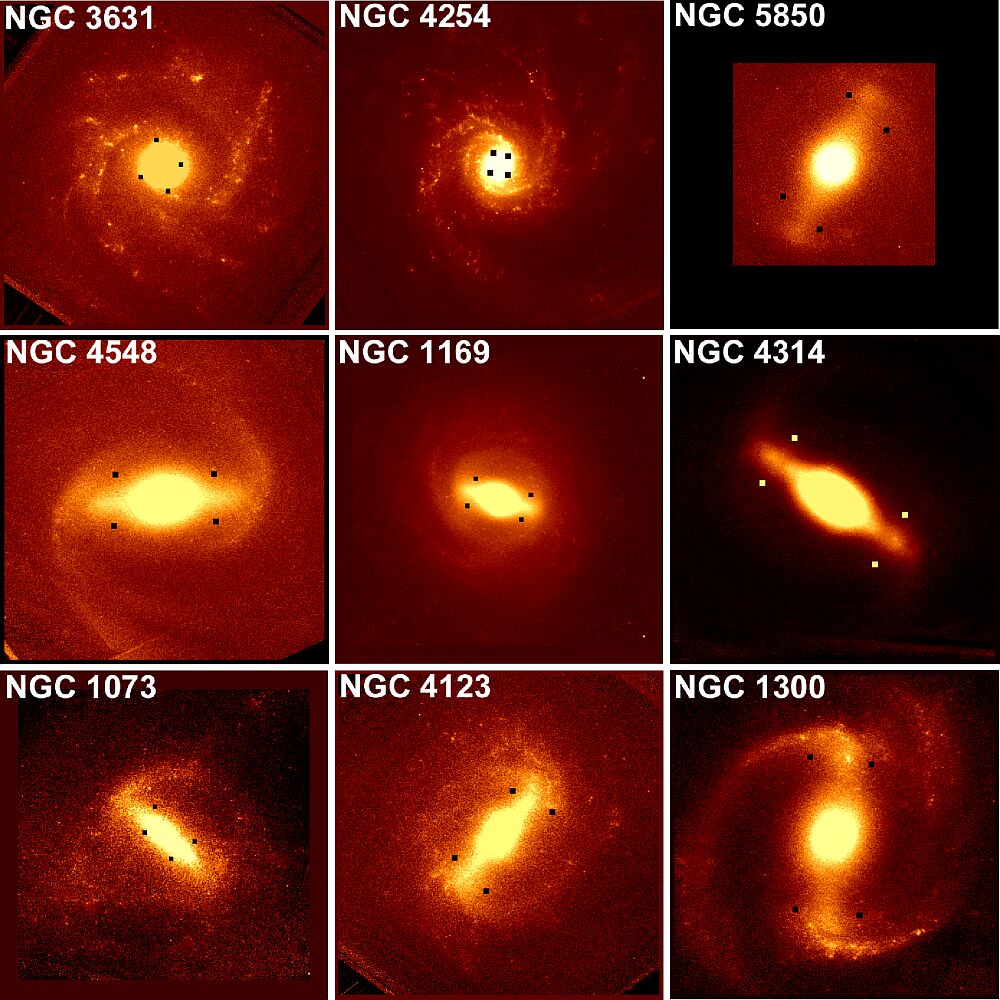
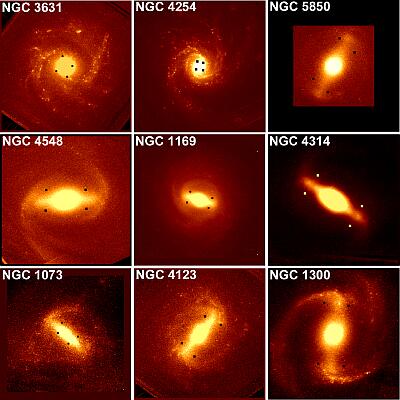
In Figure 2 we show nine of our sample galaxies, ranked in terms of increasing
bar strength or torque. The locations where the ratio of the tangential force
to the mean axisymmetric radial force reaches a maximum are indicated in
each galaxy image by four filled black or yellow dots. Figure 3 shows a montage
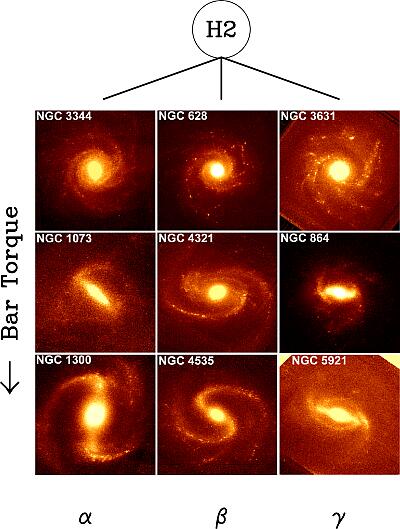
of Ks images of 9 two-armed spiral galaxies in our sample, ranked vertically
in terms of bar torque, and horizontally in terms of pitch angle class,
where class a contains the most tightly wound spirals.
|
Figure 2. Deprojected Ks images of nine galaxies
observed with the 4.2-m WHT, ranked in terms of increasing bar strength, or
torque. The four filled black or yellow dots indicate the locations where
the ratio of the tangential force to the mean axisymmetric radial force reaches
a maximum. From Block
et al. (2001). [ JPEG | TIFF ]
|
|
Figure 3. Montage of 9 Ks images of two-armed
spirals, which have been ranked vertically in terms of bar torque, where
the strongest bars are seen in the lower panels, and horizontally in terms
of pitch angle class, where class a contains the most tightly wound spirals.
From Block
et al. (2001). [ JPEG | TIFF ]
|
Combining our results on the bar strength Q
b with those
obtained by
Buta
& Block (2001) for 30 galaxies, we now have a sample of 75 galaxies
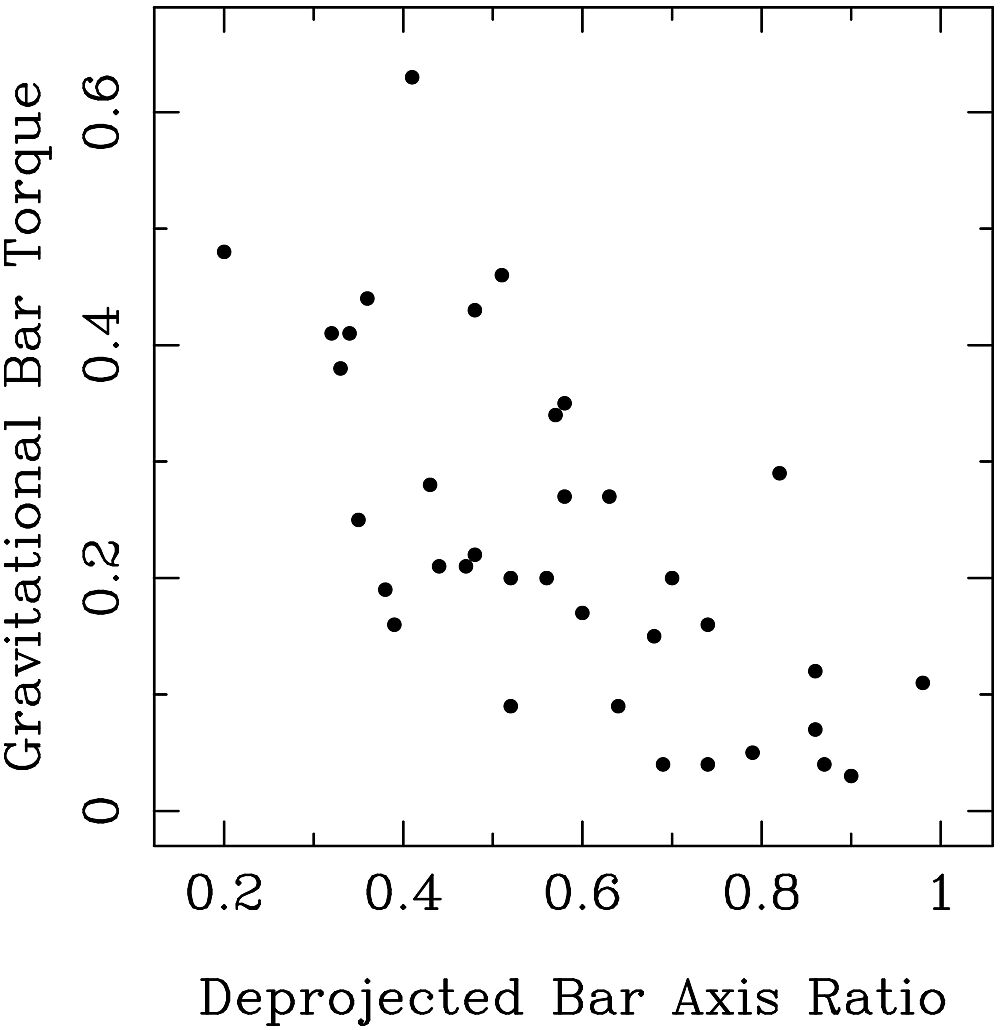
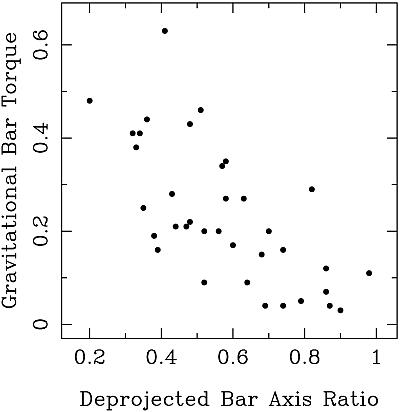
with bar strengths determined from NIR imaging. In Figure 4, we plot the
bar strength Q
b against the deprojected bar axis ratio, often
used as a bar “strength” indicator, for those galaxies where the latter number
has been published by Martin (1995). Whereas there is a general trend, as
expected, where the most elongated bars (high ellipticity or axis ratio) also
have the highest bar torques or strengths, the spread in Q
b
for each axis ratio is very large, and in fact large enough as to invalidate
any claims that bar ellipticity is a reliable bar strength estimator. For
example, bars with moderate ellipticity (axis ratios of 0.4–0.5) span the
entire range of bar strengths Q
b and their ellipticities
are thus completely useless to discriminate strong from weak bars. It is
only at the very extreme ends of the bar axis ratio range that such a discrimination
might have a chance of success.
Laurikainen,
Salo & Rautiainen (2002) derive Q
b using a slightly
different method, and compare their values with bar ellipticities. They find
a better correlation between Q
b and bar axis ratio than we
do, possibly due to the fact that the latter were derived from NIR images,
whereas
Martin
(1995) used blue light photographs.
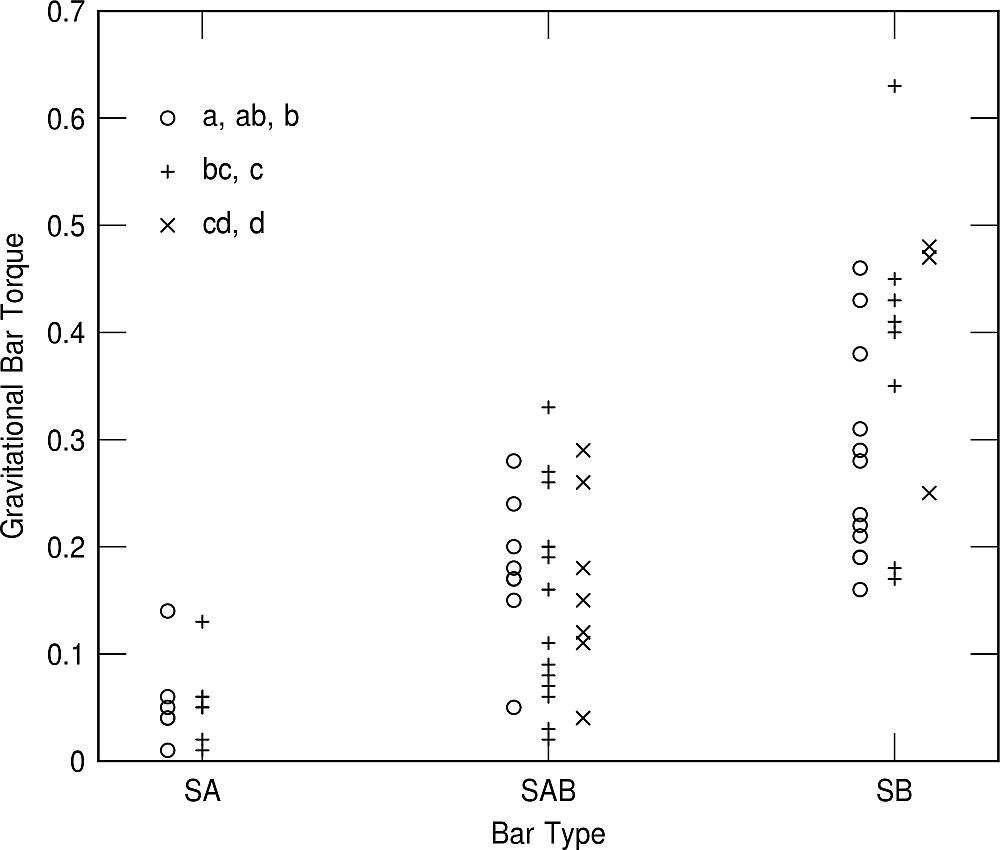
In Figure 5, we plot Q
b for each galaxy against its classification
from
de
Vaucouleurs (1963), who classified galaxies as un-barred (SA), barred
(SB) or intermediate (SAB, often referred to as weakly barred though this
may not be correct in all cases). A clear trend is seen where the SB galaxies
have higher bar strengths Q
b than SA or SAB galaxies, but more
interesting is the considerable overlap in Q
b values between
the SA, SAB and SB classes. This implies that many of the galaxies classed
as SAB in fact have stronger bars than many classed SB, and even that a considerable
number of SAB galaxies have weaker bars than others classed as un-barred!
In addition, Figure 5 shows clearly that the effect of overlapping bar strength
is not due to either early- or late-type galaxies, but is present equally
for all sub-types. Massive bulges, which will dilute bar strength, are thus
not the cause of the observed effect. Apparently, the relative bar strength
comes from a complex mixture of bar amplitude, radial profile and relative
length, combined with the bulge strength. The resulting spread of Q
b
for each Hubble subtype is due to the different ways in which these quantities
vary along the Hubble sequence. How exactly this affects the bar parameters,
and the influence the bar has on its surroundings, is not clear, and is the
subject of our further exploration, partly aided by INGRID imaging.
|

|
Figure 4. Bar strength plotted as
a function of deprojected bar ellipticity, or bar axis ratio. From Block
et al. (2001).
|
Figure 5. Bar strength plotted as
a function of Hubble type for our sample galaxies. From Block
et al. (2001).
|
5. Summary
In this short paper, we illustrate the power of the INGRID NIR camera
on the WHT in obtaining deep, wide-field, imaging of nearby spiral galaxies.
We describe results from our study of bar torques, or bar strengths, in a
large sample of galaxies which we imaged with INGRID, and show that this
bar strengths only very weakly correlates with de Vaucouleurs bar type, or
with bar axis ratio.
References:
- Block, D. L. & Wainscoat, R. J., 1991, Nature, 353,
48. [ Citation in text | ADS
]
- Block, D. L., Bertin, G., Stockton, A., Grosbol, P., Moorwood, A. F. M.,
Peletier, R. F., 1994, A&A, 288, 365. [ Citation in text | ADS
]
- Block, D. L., Puerari, I., Knapen, J. H., Elmegreen, D. M., Buta, R.,
Stedman, S., Elmegreen, D. M., 2001, A&A, 375, 361. [
First citation in text | Second
citation in text | ADS
]
- Buta, R. & Block, D. L., 2001, ApJ, 550, 243. [ First citation in text | Second citation
in text | ADS
]
- Combes, F. & Sanders, R. H., 1981, A&A, 96, 164.
[ Citation in text | ADS
]
- de Vaucouleurs, G., 1963, ApJS, 8, 31. [ Citation in text | ADS
]
- Elmegreen, D. M. & Elmegreen, B. G., 1987, ApJ, 314,
3. [ Citation in text | ADS
]
- Eskridge, P. B. et al., 2000, AJ, 119, 536. [ Citation in text | ADS
]
- Knapen, J. H., 1999, in The Evolution of Galaxies on Cosmological Timescales,
J. E. Beckman & T. J. Mahoney, Eds., ASP Conf. Ser., 187,
72. [ Citation in text | ADS
]
- Knapen, J. H., Shlosman, I. & Peletier, R. F., 2000, ApJ,
529, 93. [ Citation in text | ADS
]
- Laurikainen, E., Salo, H. & Rautiainen, P., 2002, MNRAS, in
press (astro-ph/0111376).
[ Citation in text ]
- Martin, P., 1995, AJ, 109, 2428. [ Citation
in text | ADS
]
- Mulchaey, J. S., & Regan, M. W., 1997, ApJ, 482, L135.
[ Citation in text | ADS
]
- Sellwood, J. A. & Wilkinson, A., 1993, Rep. Prog. Phys.,
56, 173. [ Citation in text | ADS
]
Email contact: Johan
Knapen (knapen@star.herts.ac.uk)
 |
Contact:
(Public Relations Officer)
Last modified: 13 December 2010
|
|
Legal notice |
Privacy notice |
Cookies policy