 | |||
|

| Home > Public Information > Scientific Highlights > 2007 > The Axisymmetric Wind of the Post-Red Supergiant IRC +10420 |
The Axisymmetric Wind of the Post-Red Supergiant IRC +10420 | ||||
|
WHT+NAOMI+OASIS
IRC +10420 is an extremely luminous star that inhabits the so-called yellow void on the HR diagram between the red and blue supergiants. There is considerable evidence that the star is evolving rapidly away from the red supergiant (RSG) phase toward
the luminous blue variable (LBV) or Wolf-Rayet (W-R) phases. As such, this object represents a potential link between the key post-main-sequence mass-losing stages and is therefore considered extremely important for the study of massive stellar evolution.
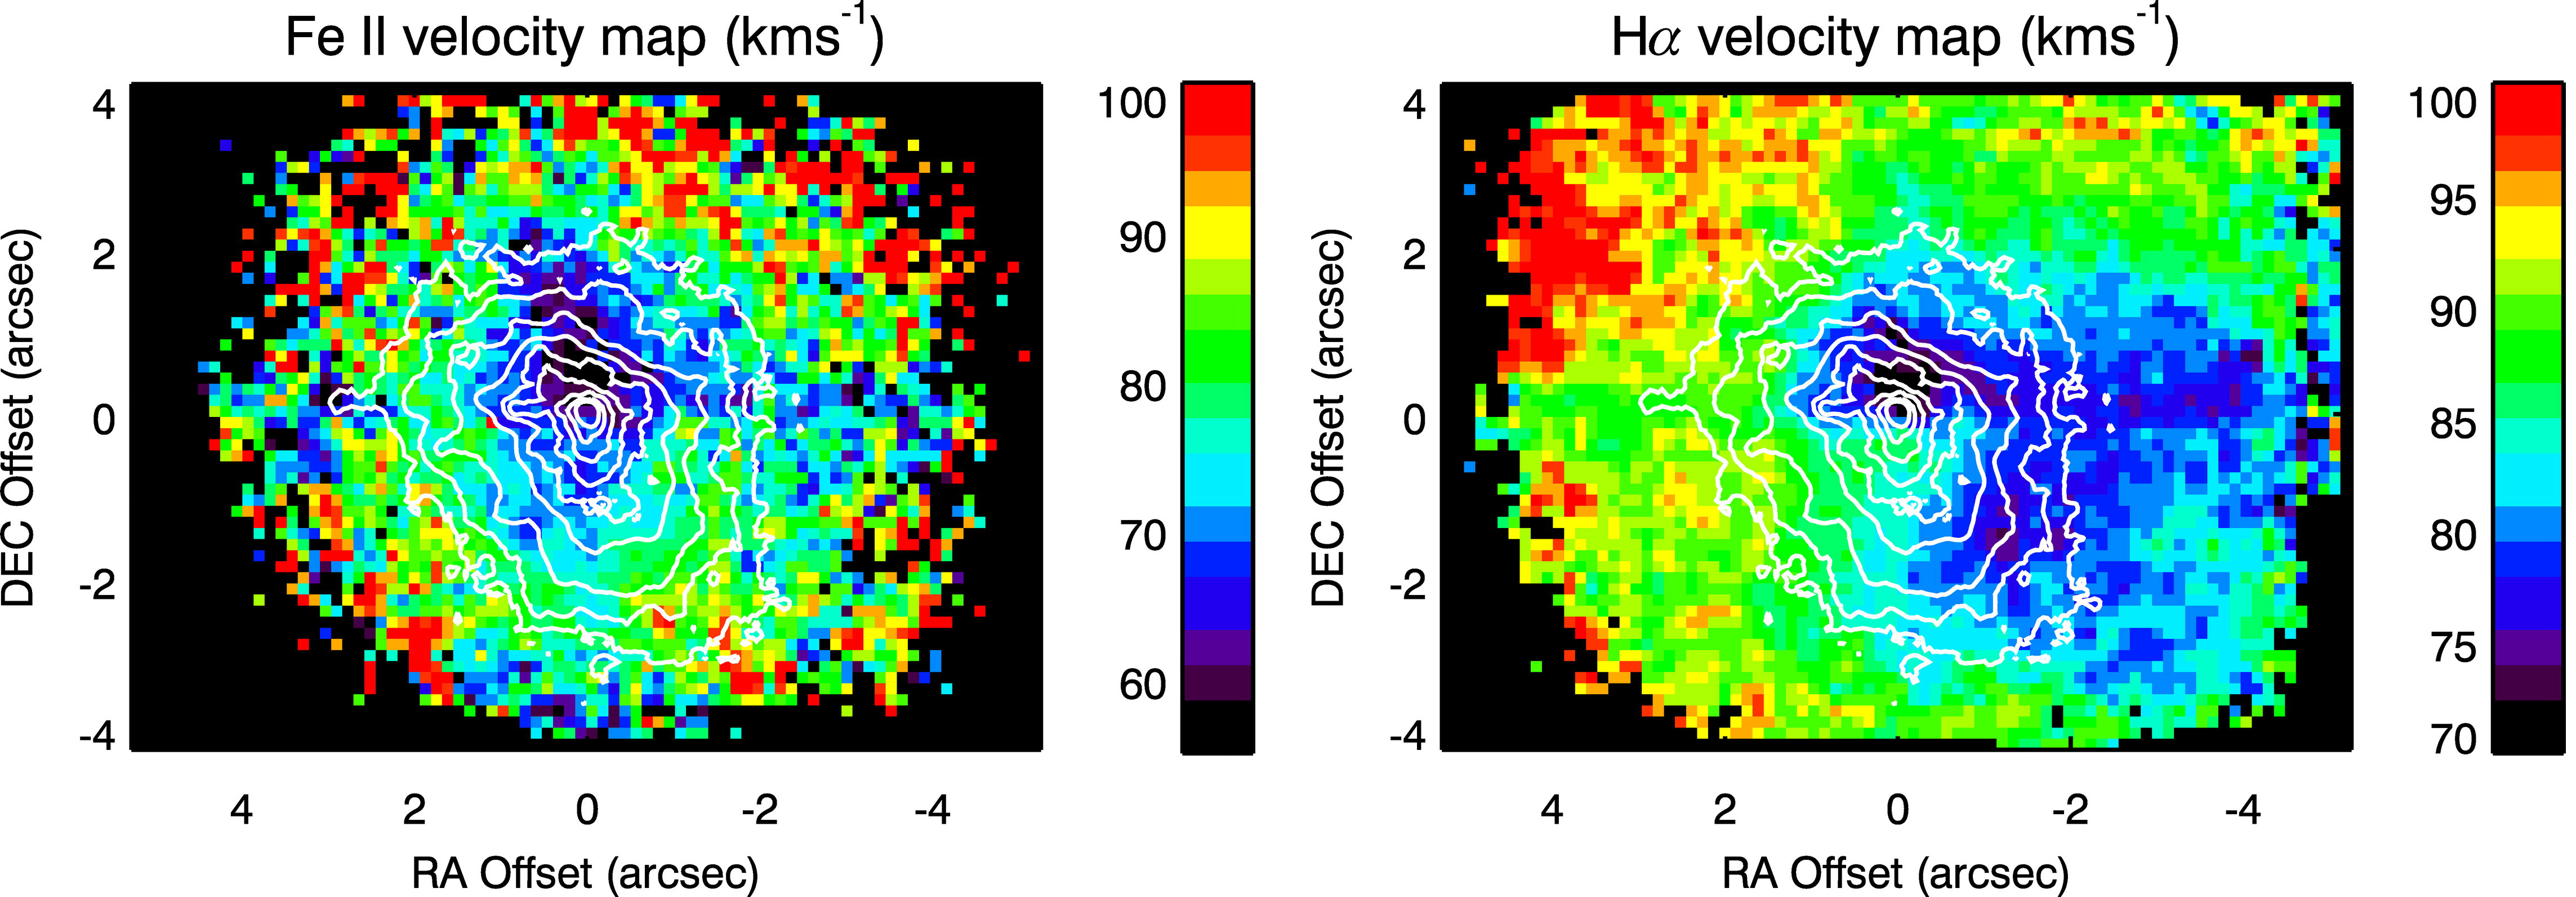
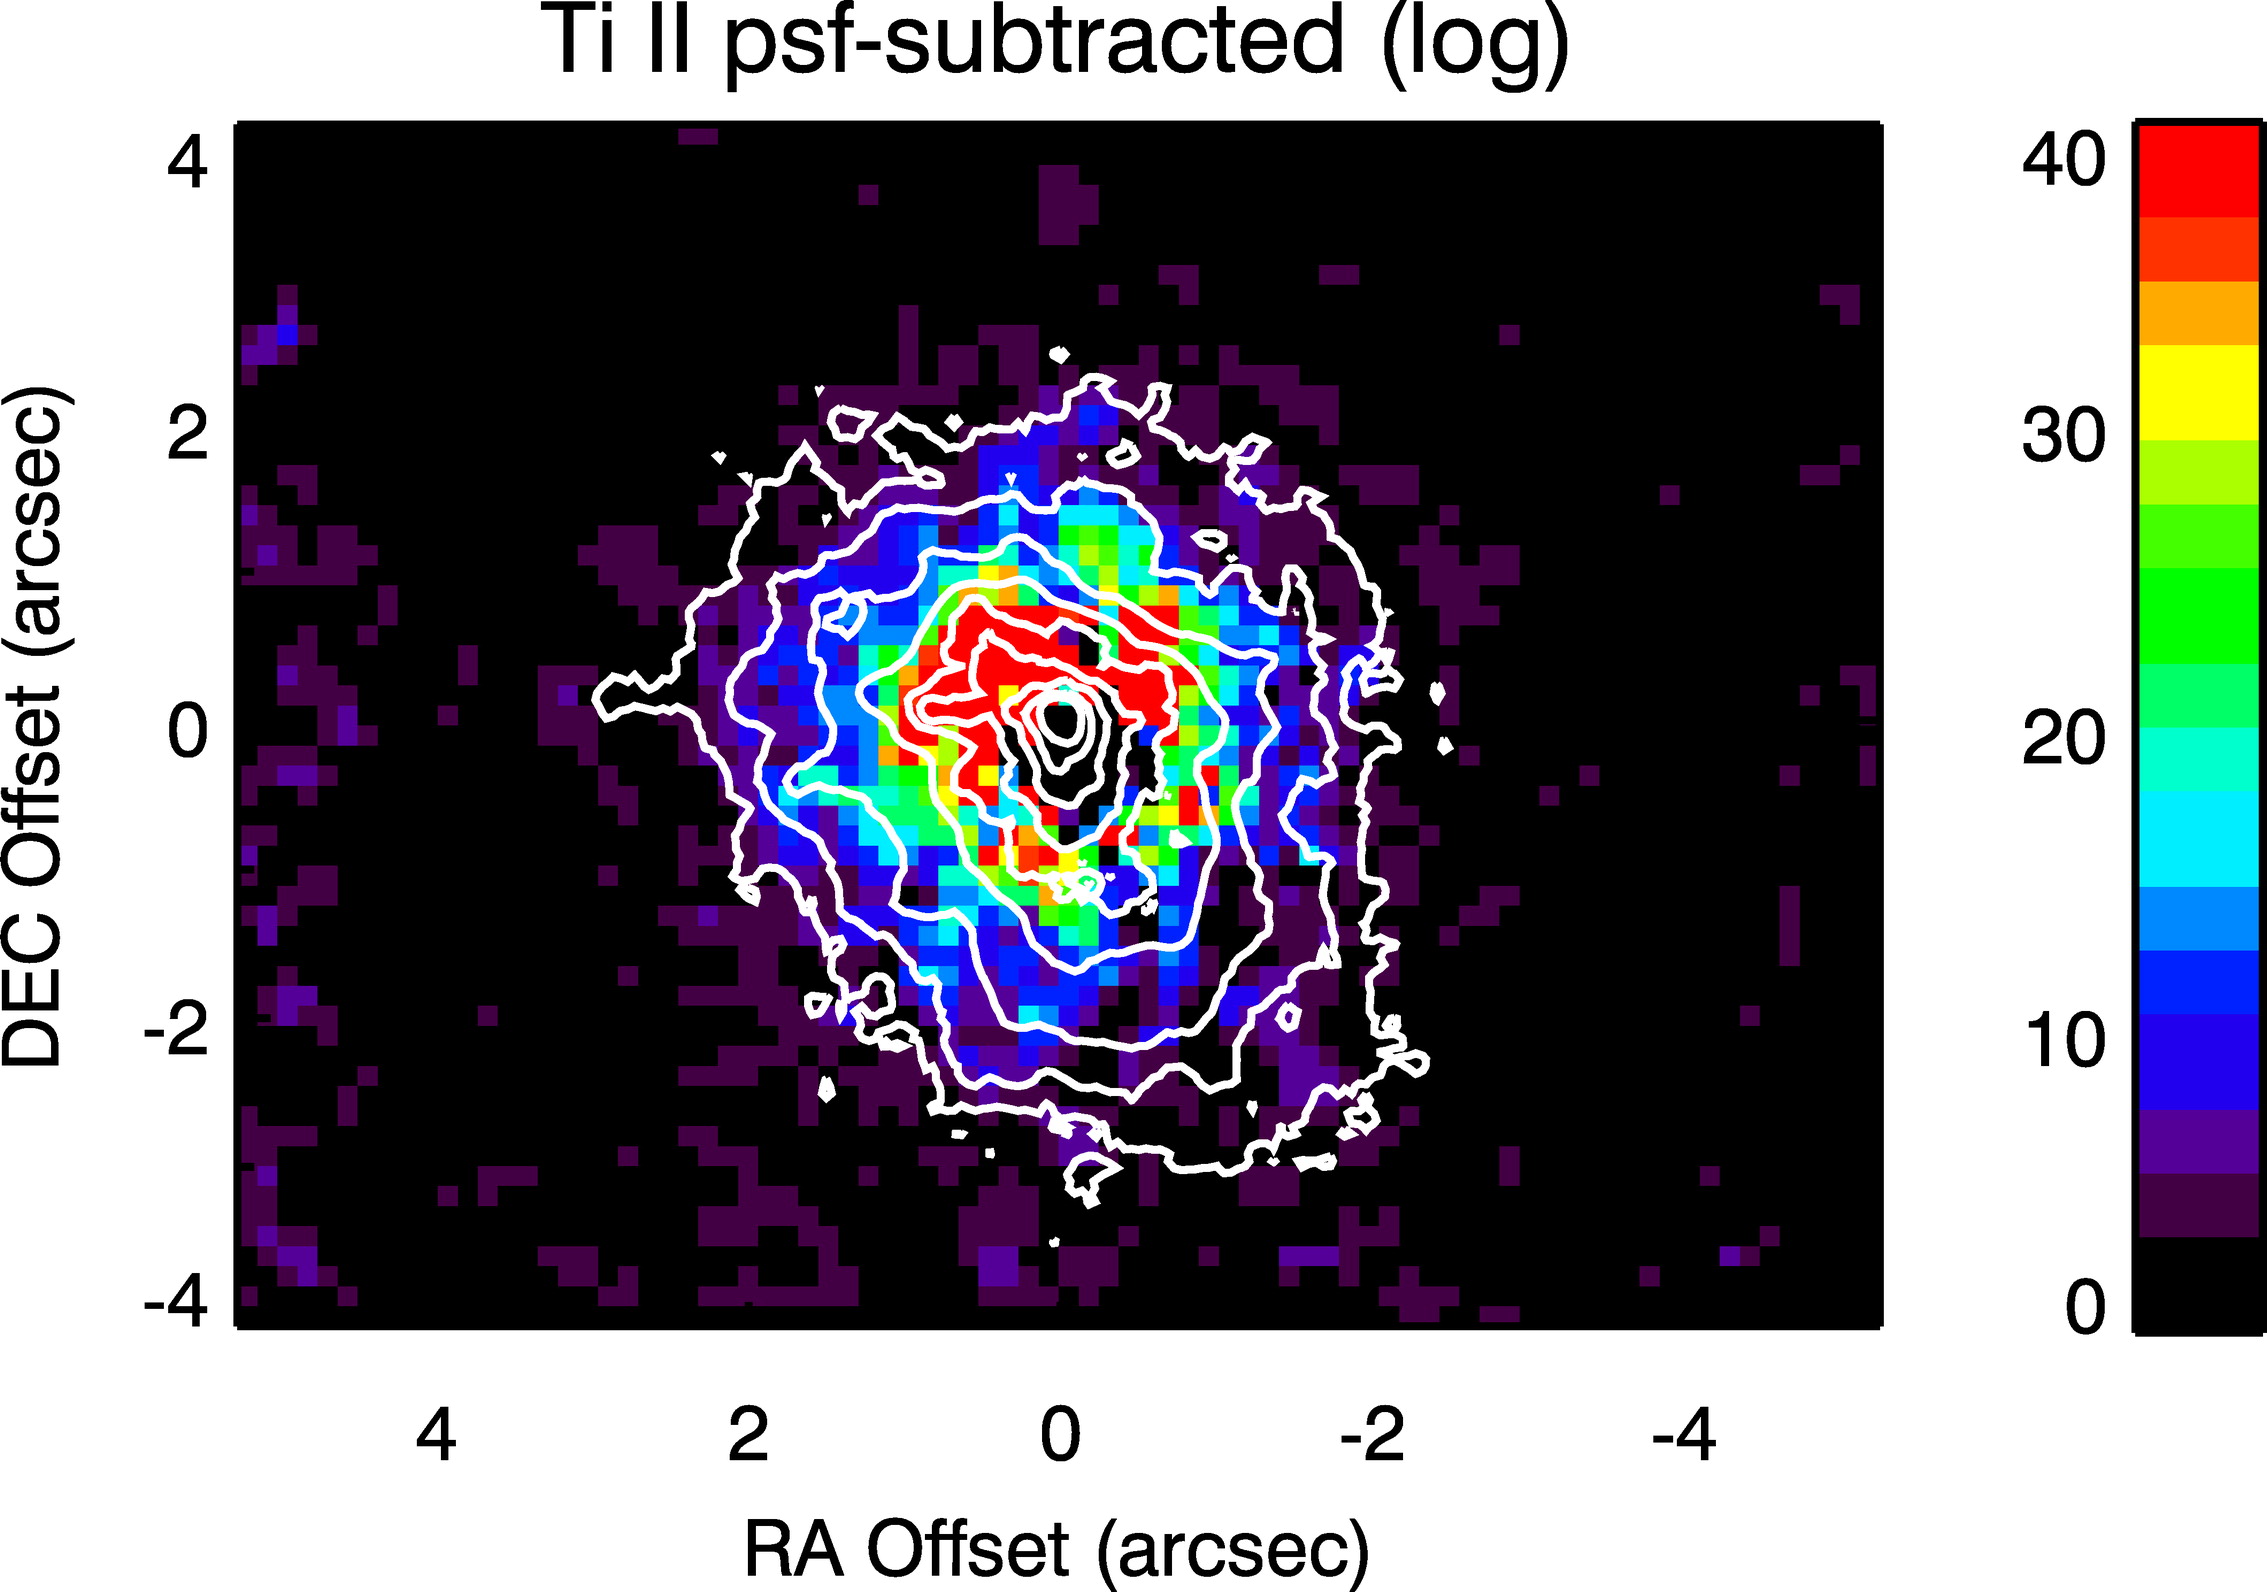
The star has been observed to gradually increase in temperature from ~6000 to ~9200 K in the last 30 years and the material the star has recently ejected may be the precursor to a LBV/W-R nebula. These nebulae are often axisymmetric, but it is unclear how these nebulae are formed. Hydrodynamical studies have shown that axisymmetric morphologies can arise from either an axisymmetric wind in the LBV/W-R phase, or a spherically symmetric wind plowing into a slower axisymmetric wind ejected in the RSG phase. As wind axisymmetry may be linked to rotation, which itself plays an important role in the evolution of a massive star, and as IRC +10420 appears to be somewhere between the LBV/W-R and RSG phases, determining the true geometry of the star's present-day wind may provide insight into the formation mechanism of the bipolar nebulae of massive stars. Further, it may also provide clues as to the role of rotation in its subsequent evolution and the connection to other classes of massive star. The geometry of IRC +10420's wind has been the topic of much discussion over the last ~20 years, yet a common consensus remains elusive due to the weight of apparently contradictory evidence. The confusion was apparently complete when astronomers using HST long-slit spectroscopy, utilized the star's reflection nebula as a tool with which to view the Hα emission from different angles. With the slit aligned along the long axis of the nebula, they showed that the velocities of the two peaks in their Hα profile were uniform. This was inconsistent with a circumstellar disk or a bipolar outflow, and concluded that the star showed no evidence of axisymmetry in the present-day wind. However, they only observed two slit positions, each roughly parallel to the long axis of the nebula and separated by 0.5". With integral-field spectroscopy using NAOMI+OASIS on the WHT, another team of astronomers improved the data on with spatially resolved spectroscopy across the whole of the inner nebula. To investigate the present-day mass-loss geometry of the star, they studied the appearance of the line emission from the inner wind as viewed when reflected off the surrounding nebula and they found that, contrary to previous work, there is strong evidence for wind axisymmetry, based on the equivalent width and velocity variations of Hα and Fe II 6516Å lines. They attribute this behavior to the appearance of the complex line profiles when viewed from different angles and they also speculate that the Ti II emission originates in the outer nebula in a region analogous to the Sr filament of η Carinae, based on the morphology of the line emission. Finally, they suggest that the present-day axisymmetric wind of IRC +10420, combined with its continued blueward evolution, is evidence that the star is evolving toward the B[e] supergiant phase.
References:
|
| Top | Back |
|
