Chapter 1. Scientific Highlights
ING Banner
Home > Public Information > ING Annual Reports > 2002-2003 > Chapter 1. Scientific Highlights


ING Annual Report 2002-2003

Previous: Introduction | Up: Table of Contents | Next: Chapter 2. Operation, Maintenance and Enhancements

Other available formats: PDF

Chapter 1

SCIENTIFIC HIGHLIGHTS


NAOMI FOCUSES ON A NEAR EARTH ASTEROID

WHT+NAOMI

The adaptive optics system NAOMI on the WHT was used to take a remarkable image of a Near-Earth Asteroid (NEA). On the night 
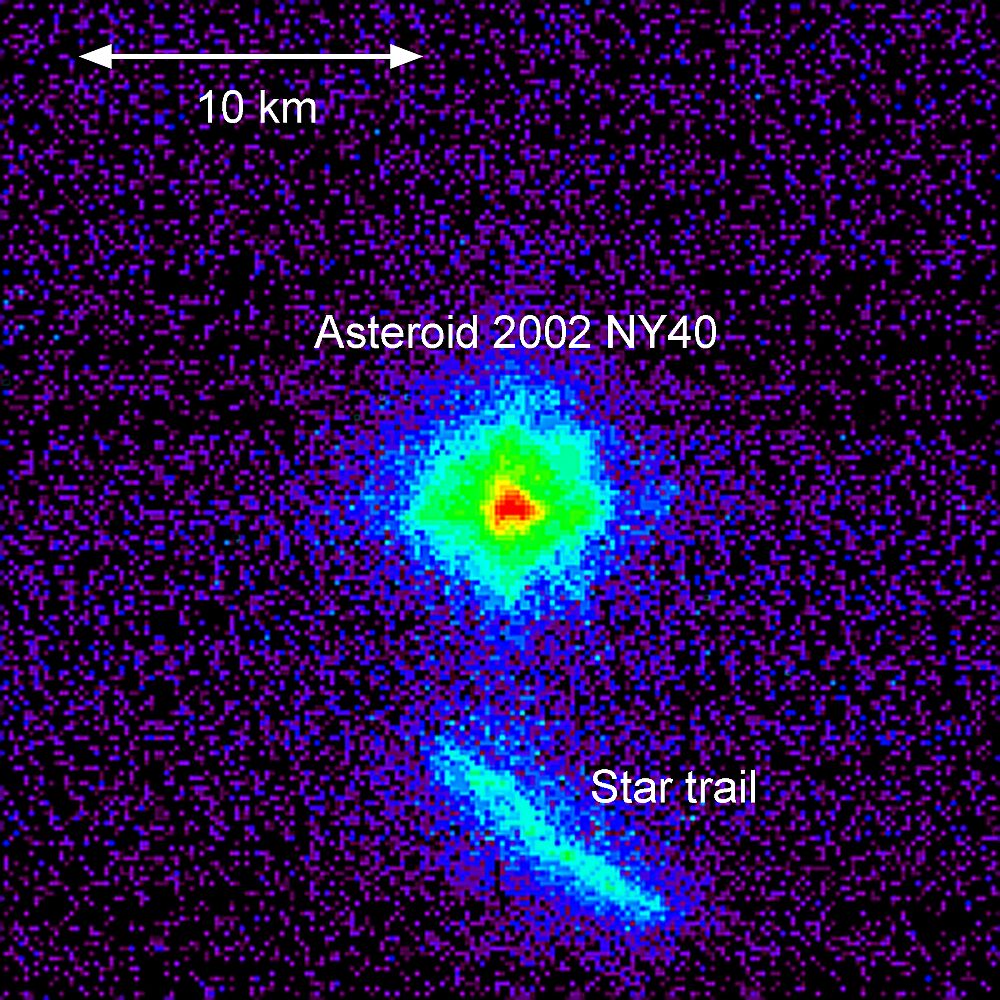
of August 17 to 18 NAOMI imaged the NEA 2002 NY40 just before its closest approach to the Earth. These are the first images of a NEA obtained with an Adaptive Optics system.

The asteroid was observed when it was only 750,000 kilometres away, twice the distance to the Moon, and moving rapidly across the sky at 65,000 kilometres per hour. Despite the technical difficulties this rapid movement caused, the astronomers using the WHT obtained very high quality images in the near-infrared with a resolution of 0.11 arcseconds. This resolution is close to the theoretical limit of the telescope, and sets an upper limit of 400 meters to the size of the asteroid.

Near-Earth asteroids are those that periodically approach or cross the orbit of our planet, and there is a very small probability that one could collide with the Earth. Measuring the size of asteroids helps astronomers understand their nature and how they were formed, as well as the potential threat they pose. Variations in the brightness of 2002 NY40 suggest that it is highly elongated and is tumbling. Further monitoring of these variations will tell the astronomers whether the asteroid was viewed end-on or side-on, thus allowing them to determine the size and shape more precisely.

NAOMI was built by a team from the University of Durham and the UK Astronomy Technology Centre in Edinburgh. In good conditions, it can deliver images as sharp as those from the Hubble Space Telescope.

Figure 1
Figure 1. H-band (1.63 microns) NAOMI image of asteroid 2002 NY40 taken on the night of August 17, 2002. [ JPEG | TIFF ]

CANNIBALISTIC STARS HOLD CLUE TO BIG BANG

WHT+UES

The lithium content of halo stars near the main-sequence turnoff is of great importance for several reasons. The near constancy of the Li abundances, which are broadly independent of metallicity or effective temperature, means that these were hardly altered from the primordial value. That discovery prompted numerous studies over the ensuing two decades, with the aim of using the inferred primordial abundance as a constraint on the baryon density of the universe, ΩB.

Lithium is also important because it is a sensitive probe of mixing below the stellar surface. Since Li is destroyed in stars at relatively low temperatures, it survives in halo main-sequence turnoff stars only in a thin surface layer making up a few percent of the stellar mass.

Although the majority of halo main-sequence turnoff stars have almost identical Li abundances, about 7% have very low (thus far undetected) Li abundances. It has been unclear why these small numbers of stars should differ so significantly from the Li-normal stars. Their evolutionary states and the presence (or lack) of abundance anomalies for other elements had thus far failed to provide unambiguous evidence of their origin.

Astronomers analysed the Li abundances of 18 halo main-sequence turnoff stars. They found that four of them were ultra-Li-deficient objects. During detailed spectral analysis of other elements using UES on the WHT, they recognised that three of the Li-depleted stars, but none of the Li-normal stars, exhibited unusually broad absorption lines. They believe that this is due to rotational broadening.

In principle, most 14-billion-year-old stars do not spin very fast at all but these ones had up to 16 times as much spin energy as the Sun. The extra energy could come from only one source: another star.

When these stars formed out of the primordial gas cloud, not just one but two stars formed very near one another. As they grew older, the smaller one captured the outer layers of the larger one. Very little now remains of what was the larger star; it has been cannibalised by its companion. The material captured by the companion carried orbital energy that was converted into spin energy. The scientists believe that the lithium was destroyed in nuclear reactions shortly before the star-eating episode occurred.

It was the discovery of the excessive spin energy that revealed the history of the objects and it explains one of the mysteries surrounding the Big Bang. Astronomers conclude that such objects must be avoided in studies of the primordial Li abundance and in investigations into the way normal single stars process their initial Li.

FLARES ILLUMINATE THE SECRET LIFE OF A QUIESCENT BLACK HOLE

WHT+ISIS, JKT+CCD

Quiescent black hole X-ray transients provide the best evidence we have for the existence of stellar mass black holes within our own Galaxy. These X-ray binaries contain a relatively low-mass star accreting onto a likely black hole via Roche lobe overflow and an accretion disc. The gas becomes so hot that it glows with X-rays.

In their quiescent state the accretion flow becomes extremely faint and so the companion star can be directly observed. It is the companion, and in particular its radial velocity variations, that provides the key to measuring the black hole mass. It is believed that less gas is falling onto the black hole or neutron star at these times, but quiescent systems with black holes appear even fainter than the ones with neutron stars. This might be because energy is disappearing past the black hole’s event horizon —the point of no return beyond which energy is irretrievably lost. But to be sure, astronomers need to know more about how the dribble of gas flows onto the black hole during the quiescent period.

To investigate this, a team of astronomers from UK and Spain used the William Herschel Telescope and the Jacobus Kapteyn Telescope to look at the visible light from the gas disc of a quiescent black-hole X-ray binary star (V404 Cygni). The glow from the disc varied by a large amount —during flares lasting for a few hours, gas all around the black hole was lit up, most likely by X-rays shining on it.

The strongest flares involved development of asymmetry in the line profile, with the red wing usually strongest independent of orbital phase. Based on the line profile changes during the flares, the researchers conclude that the most likely origin for the variability is variable photoionisation by the central source, although local flares within the disc cannot be ruled out.

So astronomers probing the intimate details of apparently quiescent stellar black holes have found that in reality they are dynamic, lively places, subject to flares that briefly illuminate the whole of the gas disc around the black hole. These observations are helping to build up a picture of precisely where X-rays are generated in the gas as it heats up to extreme temperatures and swirls around under incredible gravitational forces before cascading into the black hole itself.

Figure 2
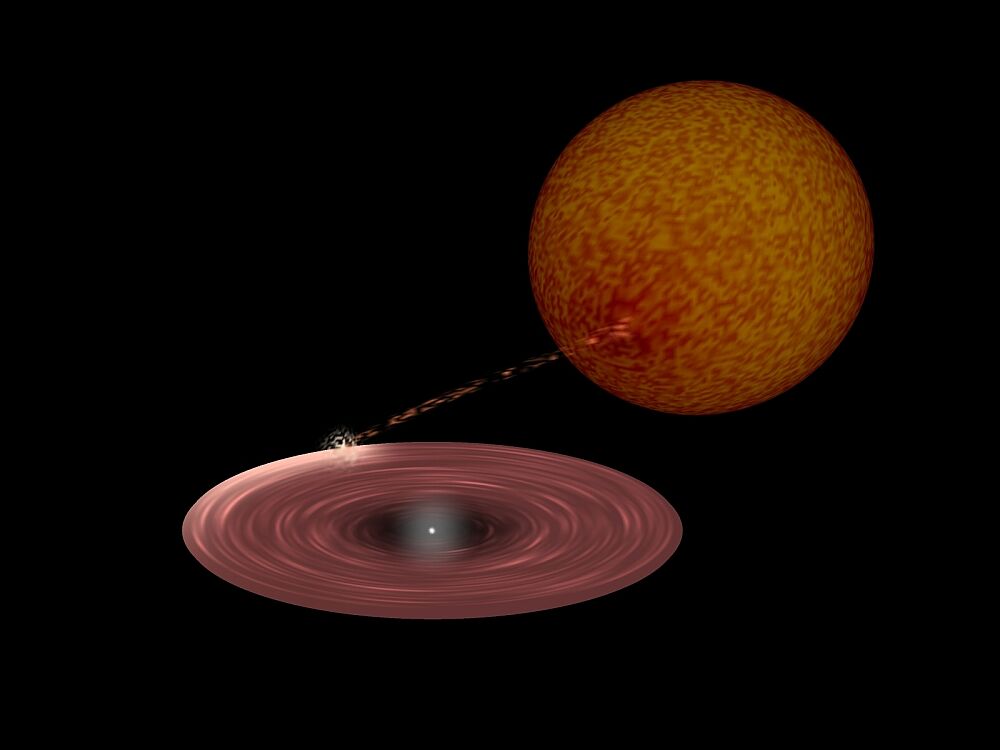
Figure 2. An impression of what a quiescent stellar black hole may look like. Gas is fed from the companion star into an accretion disc around the black hole. Some X-rays are produced as the hot gas falls into the black hole but these are much fainter than when an outburst occurs. In these quiescent black hole binary stars the companion star is actually brighter than the gas falling into the black hole. During the flares the X-rays fall upon the accretion disc and cause it to light up and become much brighter. [ JPEG | TIFF ]

DISCOVERY OF THE LEAST MASSIVE PLANETARY-MASS BODY OUTSIDE THE SOLAR SYSTEM

WHT+INGRID

Since the discovery of brown dwarfs (i.e., objects unable to burn hydrogen stably in their interiors and with masses below 72 MJup) both in the field and in young open clusters, many questions remain unanswered. A very important one is the minimum mass for the formation of very low mass objects in isolation, which would represent the bottom end of the Initial Mass Function (IMF) for free-floating objects. Very recent photometric and spectroscopic searches suggest that the IMF extends further below the deuterium burning mass threshold at around 13 MJup. This is usually referred as the “planetary-mass” domain. The least massive objects so far identified in young stellar clusters of Orion have masses around 5 – 10 MJup and cover the full range of the spectral type L.

A team of astronomers discovered a free-floating methane dwarf towards the direction of Orion. The researchers found evidence for its membership in the s Ori star cluster, which implies that this object is likely the least massive planetary-mass body imaged to date outside the solar system.

The candidate was selected from a JH near-infrared survey, in which the south western region of the young s Ori cluster was targeted down to 3s detection limit of JH~21 mag. An area of 55.4 arcmin2 was covered with the near-infrared camera INGRID mounted at the Cassegrain focus of the William Herschel Telescope. This camera is equipped with a 1024×1024 Hawaii detector, which provides a pixel size of 0.242" projected onto the sky. The total integration time was 3240s in each of the J and H filters. S Ori 70, as it is called by the discovery team,  showed a rather blue J–H colour of about –0.1 mag and J=20.28 mag.

Based on the object’s far-red, optical, and near-infrared photometry and spectroscopy, the astronomers conclude that it is a possible member of the s Ori association. and if it is a true member of s Ori, the comparison of the photometric and spectroscopic properties of S Ori 70 with state-of-the-art evolutionary models yields a mass of 3±2 Jupiter mass for ages between 1 and 8 Myr. The presence of such a low-mass object in the small search area would indicate a rising substellar initial mass function in the s Ori cluster, even for planetary masses.

This discovery indicates that objects only slightly heavier than Jupiter may exist free-floating in σ Ori. Their formation process is not yet established. Theory predicts that opacity-limited fragmentation of cool gravitationally collapsing gas clouds is capable of producing 7–10 MJup Population I objects in isolation. Moreover, this minimum Jeans mass, the critical mass above which gas collapses to form a star, seems to be insensitive to changes in the opacity of protostellar clouds (amount of dust, size of grains, cosmic-ray flux). These models, however, do not include rotation, magnetic fields, and further external accretion onto the cloud fragment, which might alter the final mass of the nascent object. S Ori 70 is probably less massive than the minimum Jeans mass of 7–10 MJup and thus prompts us to refine the collapse-and-fragmentation models and/or to rethink possible formation mechanisms for such low-mass objects. Recently, several formation scenarios have been suggested that include tidal interactions and ejection of low-mass objects from multiple systems before brown dwarfs and planetary-mass objects can accrete enough gas to become stars. Others suggest that brown dwarfs are formed in the same way as more massive hydrogen burning stars, that is, by the process of supersonic turbulent fragmentation.

Figure 3
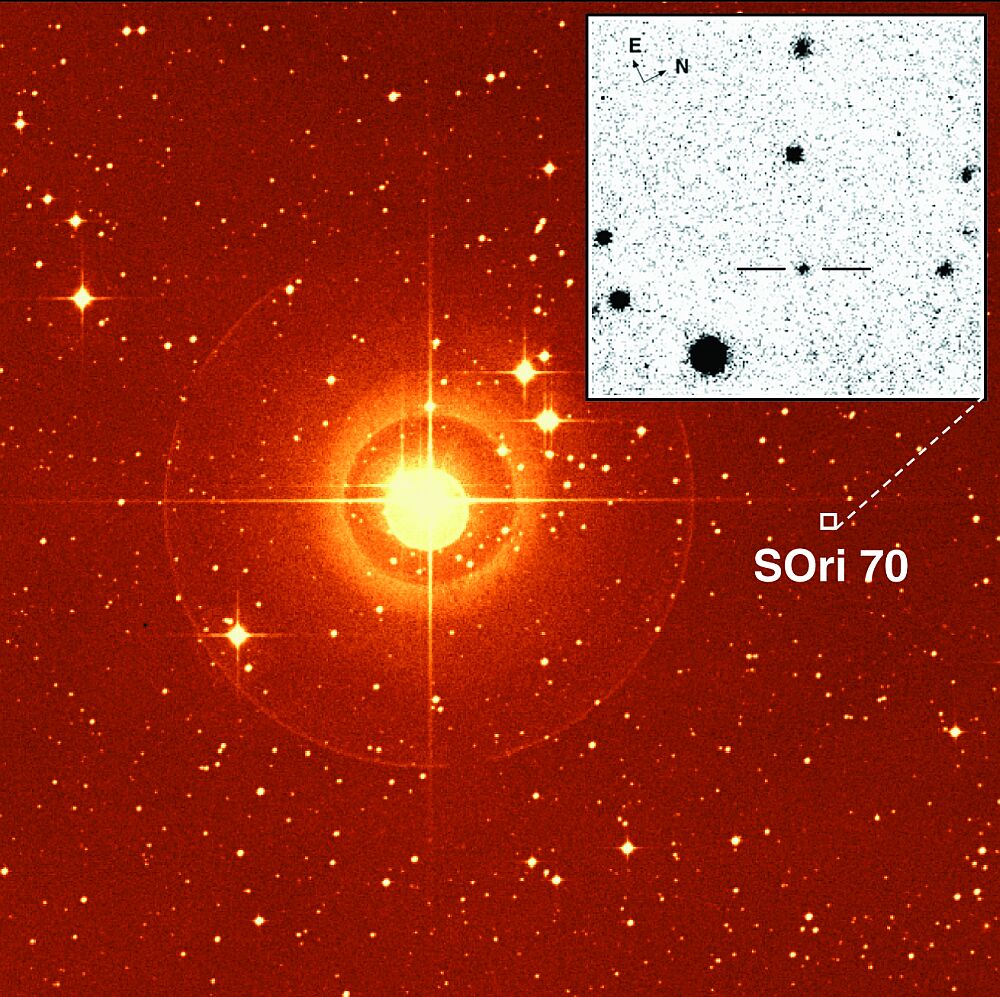
Figure 3. An image of the s Ori region. The multiple star s Ori, which is visible with the naked eye, is at the centre. A box indicates the position of the planet candidate, which is only 8.7 arcminutes from the star. The image was taken from the Digital Sky Survey and has a size of 23 × 22 square arcminutes. The inset shows the infrared image obtained using INGRID at the William Herschel Telescope. [ JPEG | TIFF ]

QUASAR REDSHIFTS FROM S-CAM OBSERVATIONS: DIRECT COLOUR DETERMINATION OF ~12 GYR-OLD PHOTONS

WHT+SCAM

Large ground and space telescopes combined with solid state detectors have revolutionised optical astronomy over the past two decades, yet deriving physical diagnostics of stars and galaxies still requires the somewhat indirect methods of filter photometry or dispersive spectroscopy to measure spectral features, energy distributions, and redshifts. The recent development of high-efficiency superconducting detectors has introduced the possibility of measuring individual optical photon energies directly. Many extensive observational programmes which aim at determining the large-scale structure of the universe, and galaxy formation and evolution, demand high-efficiency extragalactic spectroscopy.

For the first time astronomers obtained optical measurements of spectral energy distributions of quasars using an imaging detector with intrinsic energy resolution. They also showed that they can determine their redshifts directly with excellent precision.

They observed 11 quasars in the redshift range z=2.2–4.1, the sample comprising relatively bright high-redshift Lyman-limit quasars from the published literature, supplemented by three lower redshift objects, two of which were discovered in objective prism-type surveys.

Observations used the ESA superconducting tunnel junction (STJ) camera, S-CAM2, on the William Herschel Telescope. The camera is a 6×6 array of 25×25µm2 (0.6×0.6arcsec2) tantalum junctions, providing individual photon arrival time accuracies to about 5µs, a resolving power of ℜ≈8 at λ=500 nm, and high sensitivity from 310nm (the atmospheric cutoff) to about 720nm (currently set by long-wavelength filters to reduce the thermal noise photons).

They determined each quasar redshift by comparing the calibrated energy distribution with a single rest-frame composite quasar spectrum. Only one differed significantly from the literature value. It was discovered in a thin prism survey, classified as a possible quasar, and tentatively assigned a redshift of z≈2.30, but with an uncertain line identification. Although the quality of the S-CAM2 fit was acceptable, the investigators obtained z=2.976. Subsequently they determined a spectroscopic redshift z=3.04, which agrees with the S-CAM2 estimate to about 2%, and confirming that the literature value was incorrect and presenting a very good example of the kind of observations SCAM2 may carry out in the future.

Figure 4
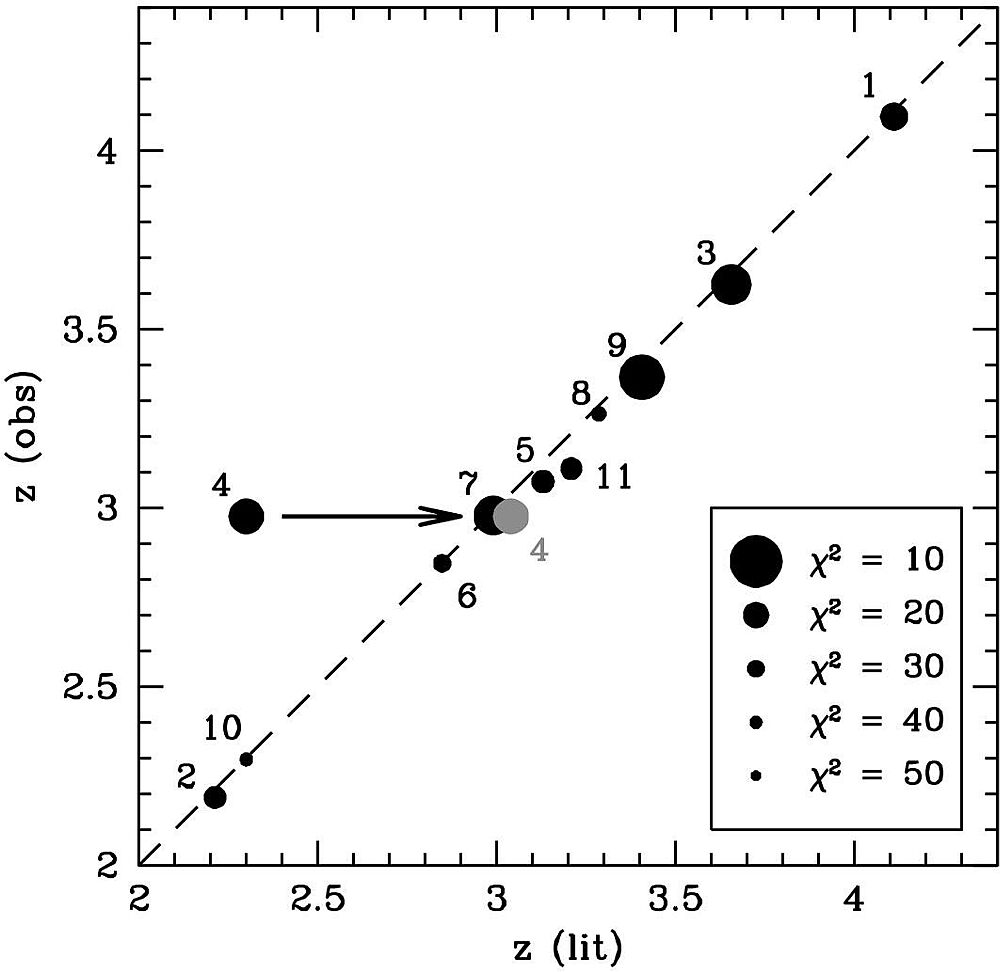
Figure 4. Observed versus literature redshifts. Symbol sizes correspond to χ2 smaller symbols indicate a poorer fit. QSO 0127+059 has an incorrect literature redshift of 2.30; follow-up spectroscopy has yielded z=3.04, moving the point to the position shown in grey. The dashed line shows the 1:1 correlation. [ JPEG | TIFF ]

THE BEST CANDIDATE TO UNDERGO A SUPERNOVA EXPLOSION

WHT+UES

The Utrecht Echelle Spectrograph (UES) on the William Herschel Telescope has allowed astronomers to monitor the star Rho Cassiopeiae (ρ Cas or HD 224014) in detail from 1993 to 2002. The observations were aimed at investigating the processes occurring when yellow hypergiants approach and bounce against the so-called Yellow Evolutionary Void, an uncommon combination of stellar brightness and temperature, and the results revealed almost regular variations of temperature within a few hundred degrees. However, what happened with ρ Cas during the summer of 2000 went beyond anybody’s expectations.

The star suddenly cooled down from 7000 to 4000 degrees within a few months. Astronomers discovered molecular absorption bands of titanium-oxide (TiO) formed in the slowly expanding atmosphere, suggesting that they had witnessed the formation of a cool and extended shell which was detached from the star by a shock wave carrying a mass equal to 10% of our Sun or 10,000 times the mass of the Earth. This is the highest amount of ejected material astronomers have ever witnessed in a single stellar eruption. 

ρ Cas experienced periods of excessive mass loss in 1893 and around 1945, that appeared to be associated with a decrease in effective temperature and the formation of a dense envelope. The results suggest that ρ Cas goes through these events approximately every 50 years.

The recurrent eruptions of ρ Cas recorded over the past century are the hallmark of the exceptional atmospheric physics manifested by the yellow hypergiants. These cool luminous stars are thought to be post-red supergiants, rapidly evolving toward the blue supergiant phase. They are rare enigmatic objects, and continuous high-resolution spectroscopic investigations are limited to a small sample of bright stars (only seven of them are known in our Galaxy), often showing dissimilar spectra, but with very peculiar spectral properties.

Yellow hypergiants are the candidates “par excellence” among the cool luminous stars to investigate the physical causes for the luminosity limit of evolved stars. They are peculiar stars because they display an uncommon combination of brightness and temperature, which places them in a so-called Yellow Evolutionary Void. When approaching the Void these stars may show signs of peculiar instability. Theoretically, they cannot cross the Void unless they have lost sufficient mass. During this process these stars end up in a supernova explosion: their ultimate and violent fate. The process of approaching the Void however, has not yet been studied observationally in sufficient detail as these events are very rare.

Since the event in the year 2000, ρ Cas’ atmosphere has been pulsating in a strange manner. Its outer layer now seems to be collapsing again, an event that looks similar to one that preceded the last outburst. The researchers think ρ Cas, at a distance of 10,000 light-years away from the Earth, could end up in a supernova explosion at any time as it has almost consumed the nuclear fuel at its core. It is perhaps the best candidate for a supernova in our Galaxy and the monitoring of this and other unstable evolved stars may help astronomers to shed some light on the very complicated evolutionary episodes that precede supernova explosions.

Figure 5
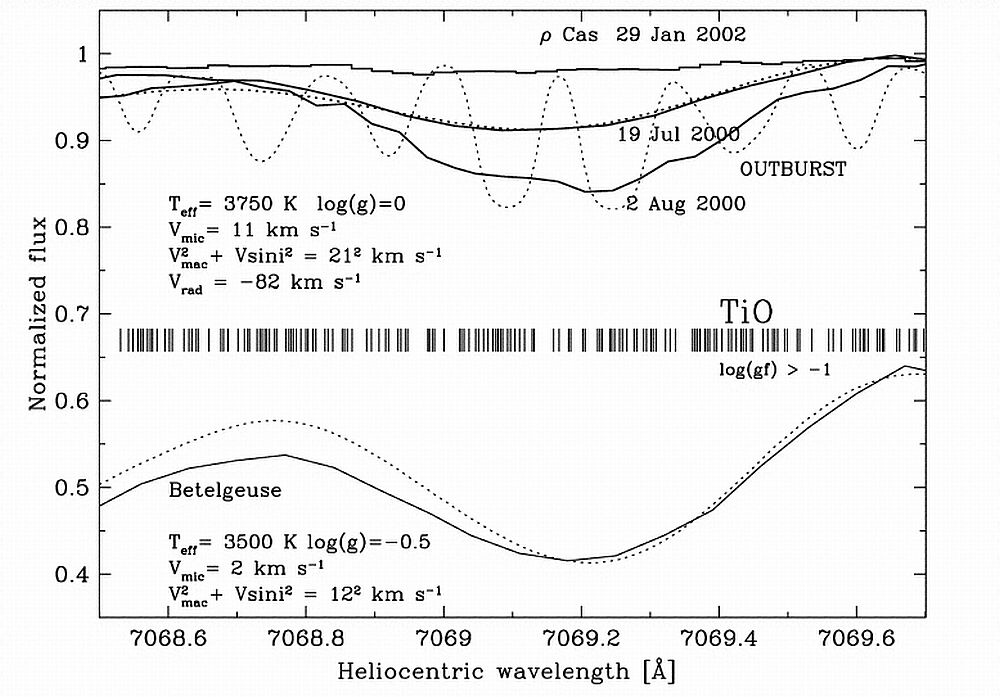
Figure 5. TiO band at 7069.2 Å, observed during the outburst of  r Cas on 2000 July 19 in the top panel, best fitted (dotted line) for a model atmosphere with Teff = 3750 K and log g=0 in the bottom panel. The spectrum of 2002 January with higher Teff does not show the TiO bands. A microturbulence velocity of 11 kms-1 and macrobroadening of 21 kms-1 are required to broaden the synthetic spectrum (dotted line) of  r Cas to the observed shape of the TiO band. The best fit yields a radial velocity of -82kms-1, or an expansion velocity of 35 kms-1. The strongest TiO lines for the synthesis, with log g values greater than -1, are marked (vertical lines). The synthetic spectrum for Betelgeuse (lower dotted line) and the fit parameters are also shown. [ JPEG | TIFF ]

ENHANCED OPTICAL EMISSION DURING CRAB PULSAR’S GIANT RADIO PULSES


WHT+TRIFFID

A correlation between optical and giant radio pulse emission from the Crab pulsar was detected for the first time. Optical pulses coincident with the giant radio pulses were on average 3% brighter than those coincident with normal radio pulses. Combined with the lack of any other pulse profile changes, this result showed the astronomers that both the giant radio pulses and the increased optical emission are linked to an increase in the electron-positron plasma density.

Despite more than 30 years of observation, the emission mechanism of pulsars is still a matter of debate. A broad consensus does exist: that the luminosity is powered by the rotation of the pulsar, that the pulsed radio signal comes from a coherent process, and that the optical–to–X-ray emission is incoherent synchrotron radiation, whereas the g-ray emission is curvature radiation. What is not agreed on is the mechanism that accelerates the electrons to the energy required for synchrotron and curvature radiation, where this acceleration takes place, how coherency is maintained, and the stability of the electron-positron plasma outflow from the neutron star’s surface. From the radiopulse profile at 1380 MHz and the optical profile for the Crab pulsar, two primary features can be identified: a main pulse and an interpulse. At lower energies, a radio precursor can be seen, and at higher energies in the optical, X-ray, and g-ray regions, bridge emission can be seen between the main pulse and the interpulse. One suggestion is that the precursor represents emission from the pulsar polar cap region near the neutron star surface, similar to the radio emission from most pulsars, and that the other features come from higher in the magnetosphere. This picture is made more complex by the existence of giant radio pulses (GRPs) that occur at random intervals, in phase with either the main pulse or the interpulse, and that have energies about 1000 times as high as the mean energy. In the optical and infrared energy regions, the pulse profile is constant at the 1% level.

Any observed variation in the emitted flux, pulse morphology, or phase relations at higher energies coincident with a GRP would provide explicit constraints on pulsar (coherent/incoherent) emission physics and geometry. To investigate whether there is a link between the radio and optical emission from the Crab pulsar, simultaneous observations were carried out with the Westerbork Synthesis Radio Telescope (WSRT) and with the Transputer Instrument for Fast Image Detection (TRIFFID) optical photometer mounted on the William Herschel Telescope.

A total of 10,034 optical data sets of 41 periods each were collected. An average pulse profile was formed by folding the optical photons at the Crab’s period and then averaging over all data sets (but not including the period associated with a GRP). By comparing the pulse profile formed by averaging only the optical pulses coincident with a GRP astronomers found that the giant optical pulses are on average 3% brighter than normal optical pulses. They also analysed other pulse parameters: arrival time, pulse shape, and interpulse height. None of these parameters showed any statistically significant variation with the presence of a GRP.

The fact that only the optical pulse, which is coincident with a GRP, shows enhanced intensity suggests that the coherent (radio) and incoherent (optical) emissions produced in the Crab pulsar’s magnetosphere are linked. A consistent explanation is that the optical emission is a reflection of increased plasma density that causes the GRP event. Whatever triggers the GRP phenomenon, it releases energy uniformly throughout most of the electromagnetic spectrum, as implied by the similar energies of radio and enhanced optical pulses. Changes in the pair production rate at the level of a few percent could explain the optical variations. However, an additional mechanism would be needed to account for the radio GRPs, which are orders of magnitude stronger than the average pulse level. It has been suggested that this could be achieved by local density enhancements to the plasma stream, which increase the coherent emission (∝n2) with little effect on the (high-energy) incoherent radiation (∝n). These changes must occur on tiny time scales (<10µs) to explain the observed change in optical flux. Whatever the mechanism, these observations demonstrate a clear link at the individual pulse level between the coherent and incoherent emission regimes in the Crab pulsar.

Figure 6
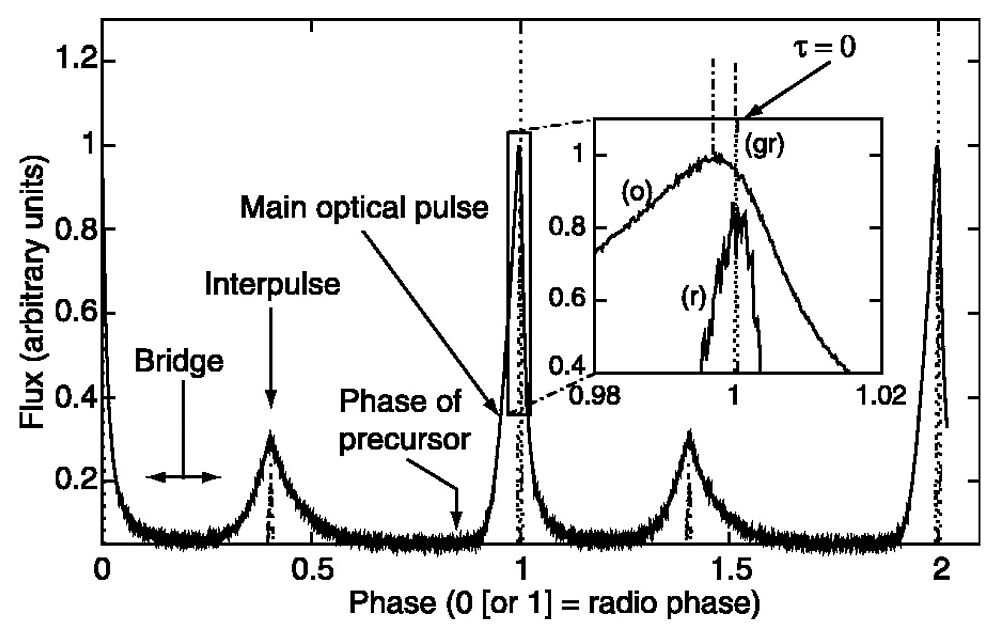
Figure 6. The Crab pulse profile showing the optical light curve (o), the average radio light curve at 1380 MHz (r), and a single giant pulse at 1357.5 MHz (gr). τ, time. Two periods are shown for clarity. Various pulse parameters have been identified. Also shown is the location of the precursor observed at lower frequencies and the bridge emission seen particularly at higher frequencies. On this scale, the GRP width corresponds to 0.00035 units of phase (12µs), the radio pulse to 0.009 (300µs), and the optical pulse to 0.045 (1500µs). The avalanche photodiode (APD) band pass for these observations was from 6000 to 7500 Å. Phase 0 corresponds to the arrival at the solar system barycenter of the peak radio pulse. The optical light curve for this plot was divided into 5000 phase bins. [ JPEG | TIFF ]

ONE RING TO ENCOMPASS THEM ALL

INT+WFC, WFS Archive

A vast, but previously unknown structure was discovered around our own Milky Way galaxy by an international team of astronomers. Their observations suggest that there is a giant ring of several hundred million stars surrounding the main disk of the Milky Way. Despite its size, the ring has not been clearly seen before since the stars are spread around the whole sky, and are far fewer in number than the tens of billions of stars making up the rest of the Galaxy.

Figure 7
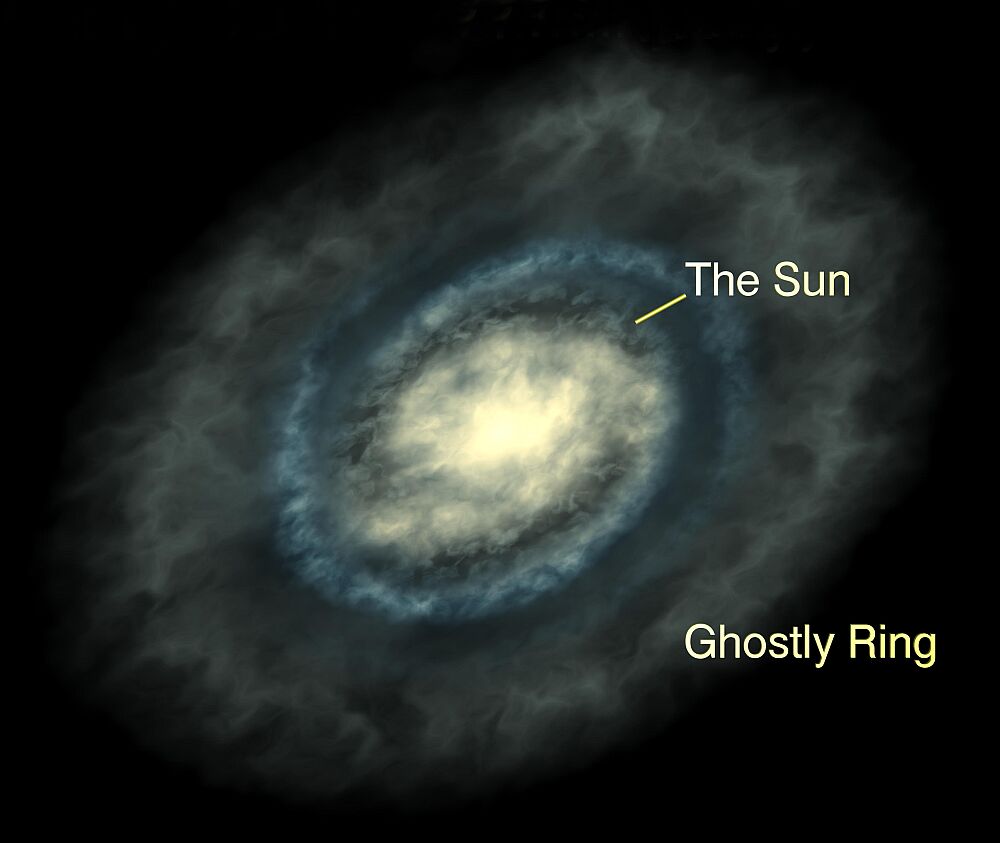
Figure 7. This schematic figure illustrates the geometry of the newly discovered ring, in relation to the spiral structure of the Milky-Way. It has long been supposed that the disk of the Milky Way galaxy slowly declines in brightness, vanishing into darkness at its edge 50,000 light years from its centre. This startling new discovery shows the outer regions of the disk are considerably more complicated than previously thought, and sheds new light on the evolutionary history of our Galaxy. [ JPEG | TIFF ]

Although known to be warped, probably from encounters with its orbiting satellite galaxies, the disk of the Milky Way was otherwise thought to be a relatively simple structure. The disk is roughly 100,000 light years across, with the Sun embedded in it and offset some 30,000 light years from the centre. From this vantage point, the nearest edge of the ring is about 30,000 light years away, in the direction of the constellation Monoceros, opposite the centre of the Galaxy. This region of sky is where traces of the ring were first discovered.

Further detailed surveys in the constellation Andromeda showed that stars belonging to the ring are visible 100 degrees away from the original discovery site and that these stars closely mimic the vertical distribution of the Milky-Way’s so-called thick disk. Additional survey areas also serendipitously yielded evidence of the ring’s presence, allowing to get the first hints of the immense size of the structure.

The data, taken with the Isaac Newton Telescope Wide Field Camera, show a population narrowly aligned along the line of sight, but with a galactocentric distance that changes from ~15 to ~20kpc. This population of stars was identified from the colour–magnitude diagrams of selected regions in the sky. Despite being narrowly concentrated along the line of sight, the structure is fairly extended vertically out of the plane of the disc, with a vertical scale height of 0.75±0.04kpc. The structure is seen both below the Galactic plane and above it, covering a vertical range of more than 50°. The fields at Galactic latitude larger than |b|~30° did not show up a similar feature in the colour–magnitude diagram. It seems roughly to encircle the disk, but is considerably thicker, probably shaped like a giant doughnut. The structure appears to be confined close to the Galactic plane. Assuming that the ring is smooth and axisymmetric, the total stellar mass in the structure may amount to ~2×10⁸ up to ~109 solar masses. 

Owing to our location within the disc of the Milky Way, studies of the global structure of this Galactic component are hampered by projection problems, crowding, dust, and the presence of intervening populations (such as the bulge). Nowhere is this so problematic as in the study of the very outer edge of the disc. The advent of the recent wide-area infrared surveys (e.g. 2MASS and DENIS) have alleviated the extinction problem, but the other problems remain, with the distance ambiguity being particularly limiting.

The INT WFS devotes a large fraction of observing time to deep and wide-field surveys. Many fields have now been observed since 1998. In examining INT WFC survey fields, the discovery team of astronomers has been able to detect the presence of this unexpected feature in several  distant fields. However, the resulting coverage at the present time is patchy, with most time having been spent in large extragalactic surveys towards the Galactic polar caps. In Figure 8 an example of one of these fields is displayed, the Elais field N1, located at l=85°, b=+44°, which shows the normal Galactic stellar population sequences. The Galactic disc dwarfs contribute to the well-populated red vertical structure at (g–r)0~1.4, whereas the progressive main-sequence turn-offs of the thick disc and halo give rise to the blue vertical structure at (g–r)0~0.5. Eventually, at magnitudes fainter than g0~22, the halo sequence curves round to the red because of the rapidly falling density at large Galactocentric distance. The right-hand panel shows the same data as the left-hand panel, but with the ridge-line of the structure of interest superposed.

Figure 9 displays the colour-magnitude diagram of the INT WFC field WFS-0801 (located at l=180°, b=+30°); a population that follows a track similar to a narrow main sequence is seen in addition to the usual Galactic components. This sequence is shown more clearly in the right-hand panel of Figure 10, in which the Elais-N1 field has been used as a background to subtract the normal Galactic components.

It is clear that this structure cannot be related to the normal thin disc, as it lies several magnitudes below the expected thin disc sequence. The rapid decline in the density of the feature away from the Galactic plane also rules out a direct connection to the halo. This leaves the thick disc as the only normal Galactic option. However, its nature remains a puzzle, and it is difficult to ascertain whether it is a Galactic ring, an inhomogeneous mess arising from ancient warps and disturbances, or part of a disrupted satellite stream.

Ultimately, detailed studies of this kind of the structure of the Milky Way and other galaxies, reveal how they came into being and have evolved over the lifetime of the universe. If this manifestly old population turns out to be the outer stellar disc, it will pose a very interesting challenge to galaxy formation models that predict inside-out assembly. Alternatively, if it transpires that the structure is due to a disrupted satellite whose orbit has been circularised and accreted along with its cargo of dark matter on to the disc, it will provide a unique first-hand opportunity to understand the effect of massive accretions on to the inner regions of galaxies.

Figure 8 Figure 9 Figure 10
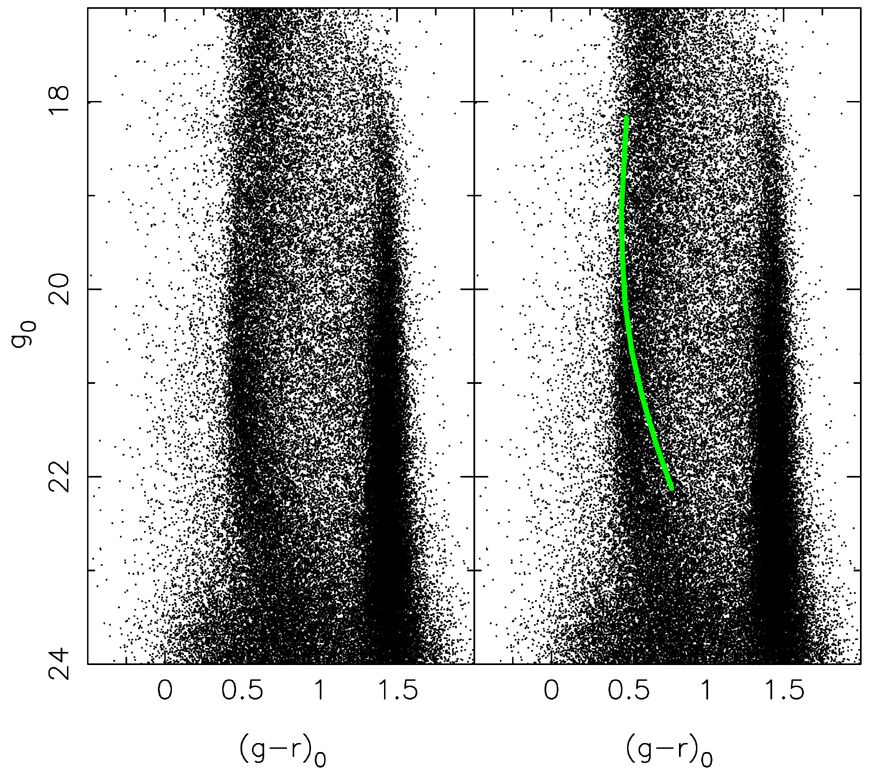
Figure 8 (left). The colour-magnitude diagram of the Elais field N1 (l= 85°, b=+44°), which it is used as a control field. This comparison region shows the usual Galactic components. 
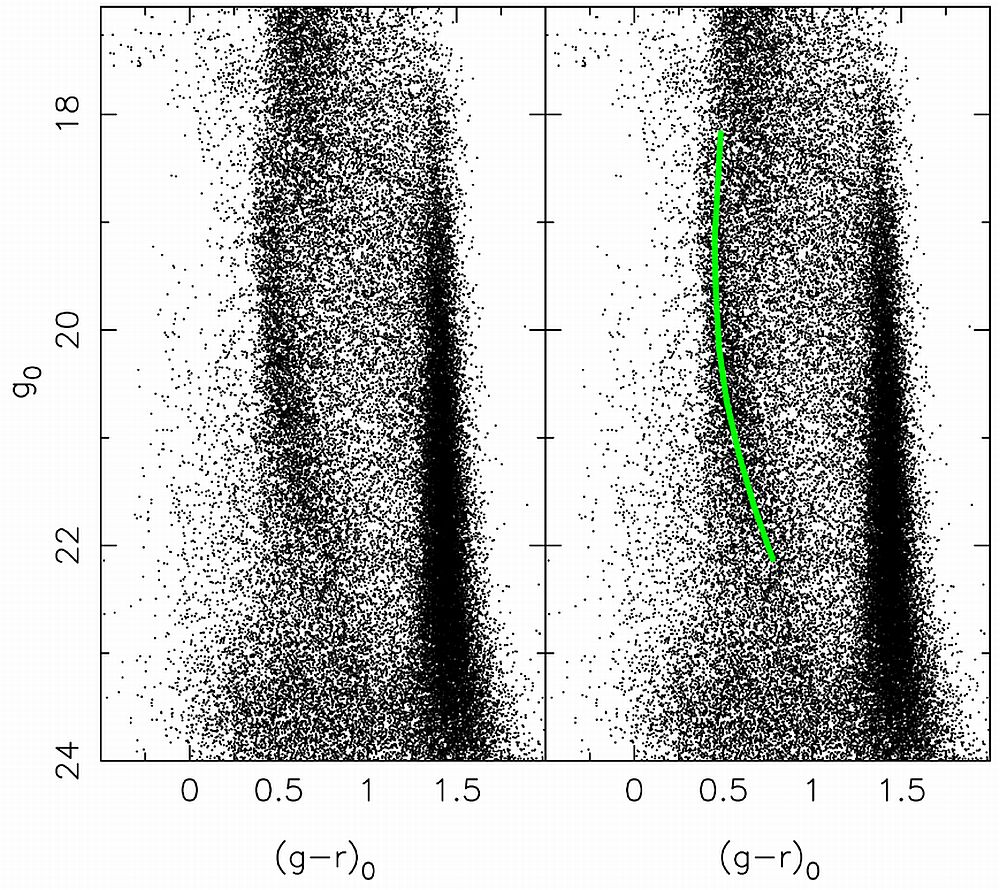
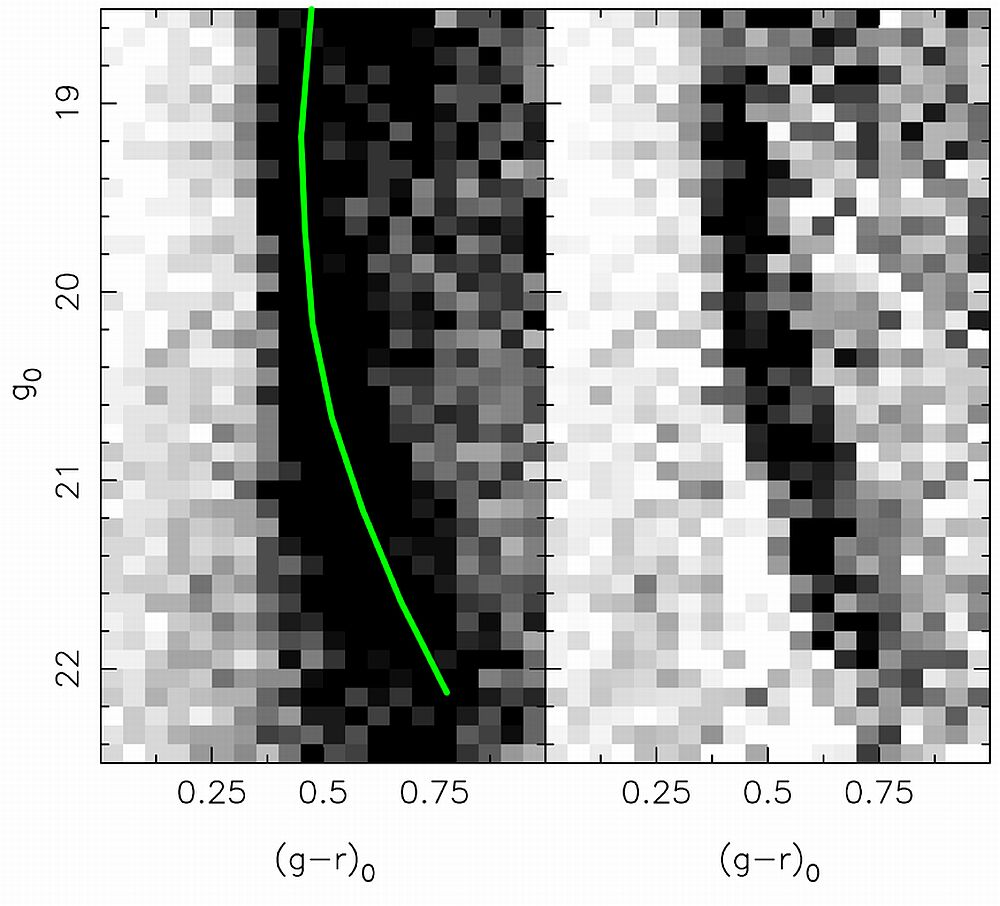
[ JPEG | TIFF ]

Figure 9 (middle). The colour-magnitude diagram of a field WFS-0801 at l=150°, b=+20°. An additional colour-magnitude feature is present here over the expected disc, thick disc and halo components, and is seen as a narrow colour-magnitude diagram structure, similar to a main sequence with turn-off at (g–r)0~0.5,  g0~19.5 (in the Vega system). The right-hand panel shows this ridge-line overlaid on the colour-magnitude diagram. The similarity in the turn-off colour of this feature and that of the Galactic thick disc and halo shows that its stellar population is of comparable age to those ancient Galactic components. [ JPEG | TIFF ]

Figure 10 (right). The left-hand panel shows the Hess diagram of the INT WFS-0801 field  and the right-hand panel displays the result of subtracting the Elais-N1 comparison region from the data in the left-hand panel. The excess population stands out very clearly. This excess is detected at signal-to-noise ratio >30. [ JPEG | TIFF ]


A DEARTH OF DARK MATTER IN ORDINARY ELLIPTICAL GALAXIES

WHT+PN.S

Over the past 25 years, astronomers have progressed from being surprised by the existence of dark matter to understanding that most of the universe is dominated by exotic nonluminous material. In the prevailing paradigm, the gravitational influence of cold dark matter (CDM) is crucial to the formation of structure, seeding the collapse and aggregation of luminous systems. An inherent consequence of CDM’s role in these processes is that galaxies have massive, extended CDM halos. Indeed, such halos are evident around spiral galaxies, in which the rotational speeds in the extended cold-gas disks do not decrease outside the visible stars —a gravitational signature of dark matter.

The evidence for dark matter in elliptical galaxies is still circumstantial. Assessments of the total masses of individual elliptical systems have generally been confined to the very brightest systems, for which the gravitational potential can be measured using X-ray emission or strong gravitational lensing, and to nearby dwarfs, for which the kinematics of individual stars offer a probe of the mass distribution. More “ordinary” elliptical galaxies are more difficult to study because in general they lack a simple kinematical probe at the larger radii, where dark matter is expected to dominate. The velocity distribution of the diffuse stellar light is the natural candidate, but studies have been limited by the faintness of galaxies’ outer parts to radii that are 2Reff, where Reff  is the galaxy’s effective radius, which encloses half of its projected light.

A powerful alternative is offered by Planetary Nebulae (PNe), which are detectable even in distant galaxies through their characteristic strong emission lines. Once found, their line-of-sight velocities can be readily determined by the Doppler shift in these emission lines. These objects have been used in the past as tracers of the stellar kinematics of galaxies, but the procedure of locating them with narrow-band imaging surveys and then blindly obtaining spectra at the identified positions has proven difficult to implement efficiently on a large scale.

A specialised instrument, the Planetary Nebula Spectrograph (PN.S), was developed specifically to study the kinematics of PNe in elliptical galaxies. The PN.S uses counter-dispersed imaging (a type of slitless spectroscopy) over a wide field to detect and measure velocities for PNe simultaneously by using their [OIII] emissions at 500.7nm. Because it is optimized for this purpose, the PN.S is far more efficient for extragalactic PN studies than any other existing instrumentation.

Observations with the PN.S on the William Herschel Telescope allowed astronomers to extend stellar kinematic studies to the outer parts of three intermediate-luminosity elliptical galaxies: NGC821, NGC3379, and NGC4494. In each of these systems, they measured 100 PN velocities with uncertainties of 20 kms–1 out to radii of 4 to 6Reff. The line-of-sight velocities in the outer parts of all of these galaxies show a clear decline in dispersion with the radius. A decrease in random velocities with the radius has been indicated by small samples of PNs around NGC3379, but the more extensive data set presented here provides a more definitive measurement of this decline, and reveals that it also occurs in other similar galaxies. The new data are inconsistent with simple dark halo models and thus different from kinematical results for brighter ellipticals.

More unexpectedly, the velocity dispersion data are consistent with simple models containing no dark matter, showing the nearly Keplerian decline with the radius outside 2Reff that such models predict and suggesting that these systems are not embedded in massive dark halos.

This result clashes with conventional concepts of galaxy formation. In particular, if ellipticals are built up by mergers of smaller galaxies, it is puzzling that the resulting systems show little trace of their precursors’ dark matter halos. And it is also apparent that some important physics is still missing from the recipes for galaxy formation. For example, substantial portions of these galaxies’ dark matter halos could have been shed through interactions with other galaxies. Such stripping has been inferred for ellipticals near the centres of dense galaxy clusters, but the galaxies studied here are in much sparser environments, in which substantial stripping is not expected to be an important process.

Crucial to understanding the incidence and origin of this low-dark matter phenomenon will be the results for a large sample of ellipticals with a broad range of properties, including differing environmental densities, which could be a key factor in determining halo outcomes; the continuing PN.S observing program will provide this sample.

Figure 11 Figure 12
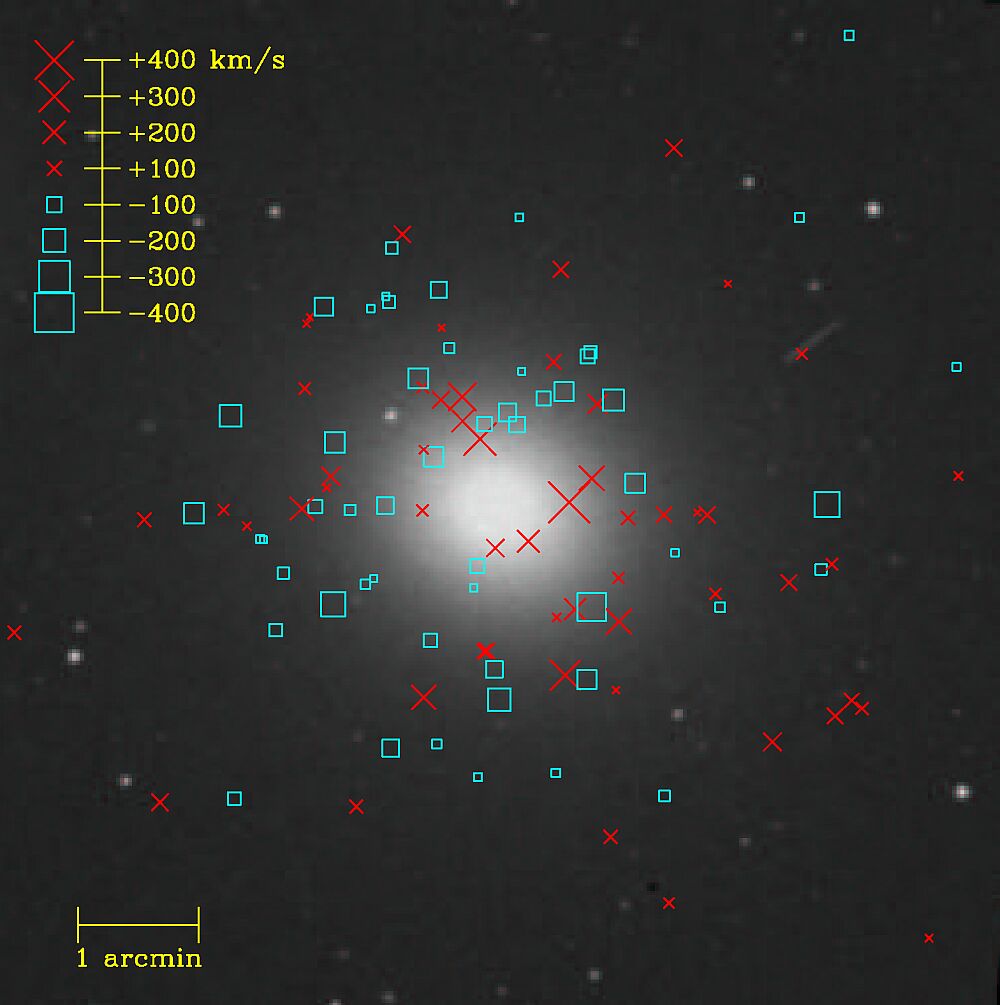
Figure 11 (left). NGC3379 (M 105) with 109 PN line-of-sight velocities relative to the systemic velocity, as measured with the PN.S instrument on the William Herschel Telescope. The symbol sizes are proportional to the velocity magnitudes. Red crosses indicate receding velocities, and  blue boxes, approaching velocities. Field of view is 8.4×8.4 arcmin=26×26 kpc=14×14 Reff. 
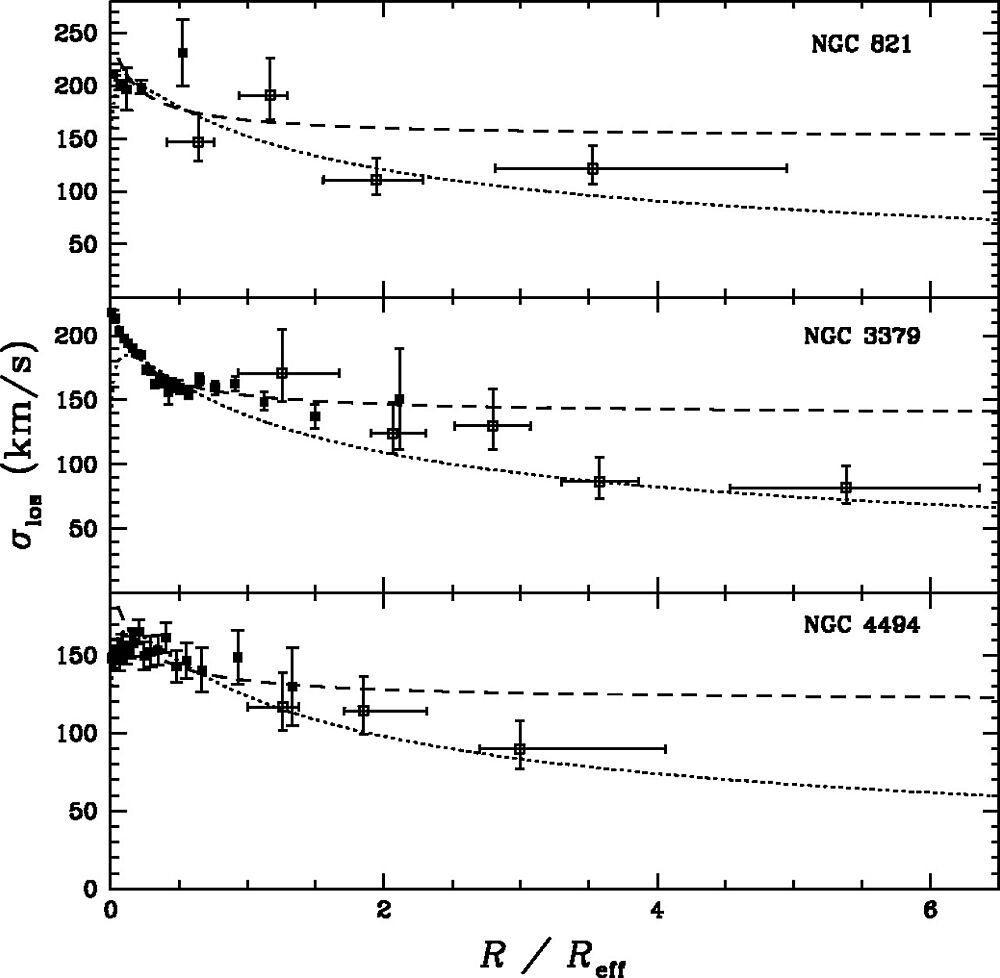
[ JPEG | TIFF ]

Figure 12 (right). Line-of-sight velocity dispersion profiles for three elliptical galaxies, as a function of projected radius in units of Reff. Open points show planetary nebula data (from the PN.S); solid points show diffuse stellar data. The vertical error bars show 1 uncertainties in the dispersion, and the horizontal error bars show the radial range covered by 68% of the points in each bin. Predictions of simple isotropic models are also shown for comparison: a singular isothermal halo (dashes) and a constant mass-to-light–ratio galaxy (dots). [ JPEG | TIFF ]


A PHOTOMETRIC AND SPECTROSCOPIC STUDY OF DWARF AND GIANT GALAXIES IN THE COMA CLUSTER

WHT+MCCDII, AF2/WYFFOS, JKT+CCD

The Coma cluster (Abell 1656) is one of the best studied nearby clusters of galaxies. Among nearby clusters, it is the richest and the most compact one showing a reasonable degree of spherical symmetry. Since the Coma cluster is more than 5 times as distant as the Virgo cluster, its dwarf galaxy population has not been studied well. Assuming that Coma dwarfs are similar to Virgo and Fornax dwarfs, they have scale length of about 1" and are fainter than R~16. The image area of a single CCD is quite small and inefficient to cover the whole extent of the Coma cluster with sufficient angular resolution.

The technique of CCD mosaicking was a breakthrough to this dilemma. Mosaic CCD cameras made observations of dwarf galaxies feasible beyond a few very nearby clusters such as the Virgo and the Fornax clusters.

A team of astronomers has carried out a deep photometric and spectroscopic survey of wide areas in the Coma cluster, aiming to investigate the properties of galaxy population in different environments within the cluster, using a wide-field mosaic CCD camera (MCCDII) for photometric survey and the AF2/WYFFOS multiobject spectrograph at prime focus of the WHT to increase spectra of both giant and dwarf galaxies available to the study.

Imaging data covered a large field of view (2.22deg2) from the cluster centre to the outskirts, and the photometry was complete to a limiting magnitude of R≅23 mag. This photometric survey covered a wide area down to a considerably deep limiting magnitude compared to previous studies. In particular, the surveyed area is the largest among the recent CCD surveys of the Coma cluster. It covers the area in the Johnson B and Cousins R bands for which only photographic data had been available before.

The Mosaic CCD Camera II (MCCDII) was developed in a collaborative program between the University of Tokyo and National Astronomical Observatory of Japan. MCCDII has 40 1k×1k CCDs produced by TI/Japan. Since the CCDs are not buttable, they are aligned in the 5×8 array with gaps (hence one contiguous image consists of 160 frames). The camera is designed so that four different exposures provide one contiguous image without any gap. The gap between each CCD is about 900 pixels, which is optimized to give both as large field of view as possible and an appropriate overlap (100 pixels) between adjacent images. MCCDII was attached to the prime focus of the William Herschel Telescope. The scale at the prime focus of WHT is 17.75" mm-1, which results in 0.21" per pixel sampling and 50×32arcmin2 field of view is attained with four exposures.

Figure 13
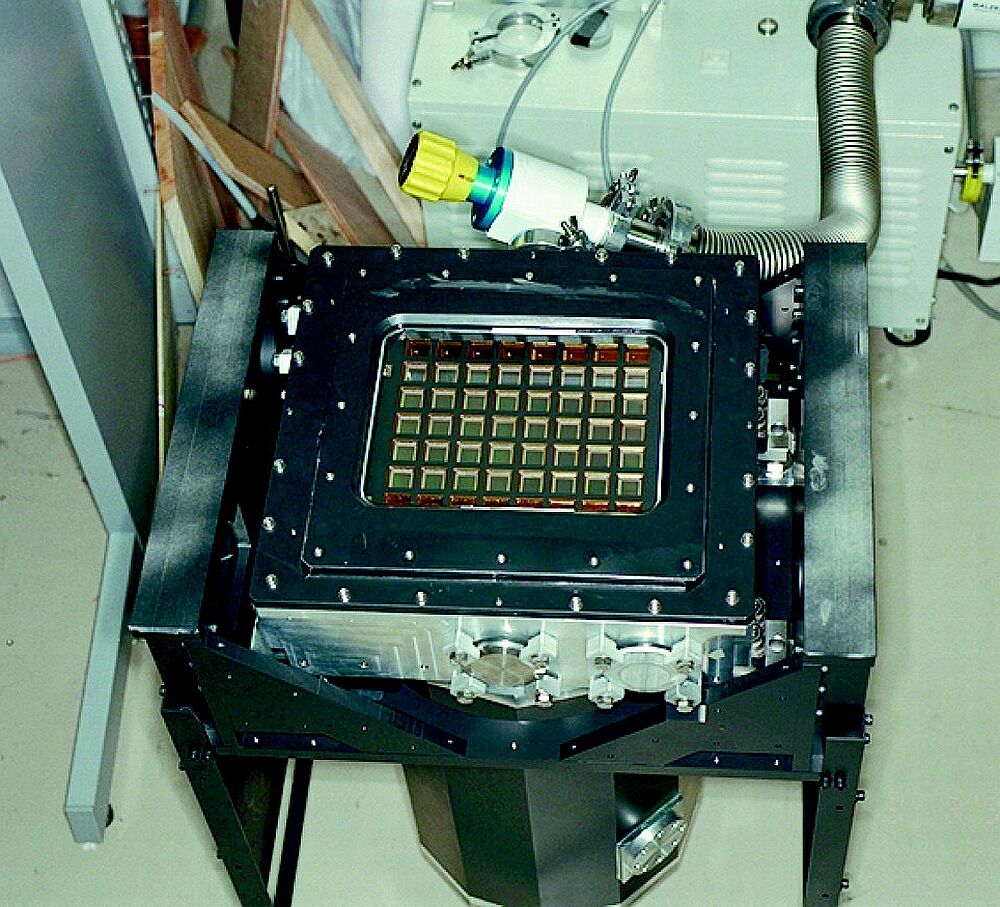
Figure 13. Mosaic CCD Camera II (MCCDII). Forty CCDs are seen aligned in 5×8 array. A liquid nitrogen tank is attached backside of the Dewar to cool the CCDs down to appropriate temperature. [ JPEG | TIFF ]

To study the spectral properties of galaxies as a function of their local environment, two fields were selected for spectroscopic observations to cover both the core and outskirts of the cluster. Medium resolution spectroscopy was then carried out for a total of 490 galaxies in both fields, using the AF2/WYFFOS multifiber spectrograph. The limiting magnitude was R=19.75 and a total of 279 galaxies were identified as members of the Coma Cluster.

The mean metallicity decreases with galaxy magnitude and, at a given luminosity, appears to be generally lower for galaxies in the southwest region of Coma as compared to the centre of the cluster. A broad range of ages, from younger than 3 Gyr to older than 9 Gyr, is found in galaxies of any magnitude. However, systematic trends of age with luminosity are present among galaxies in the central field, including a slight decrease of the mean age for fainter galaxies. Furthermore, in the central Mpc of Coma, a large fraction of galaxies at any luminosity show no evidence in their central regions of star formation occurred at redshift z<2, while the proportion of galaxies with significant star formation occurring at intermediate (0.35<z<2) and low (z<0.35) redshifts is found to depend on galaxy luminosity. An additional surprising result is that the faint galaxies with young luminosity-weighted ages appear to have a bimodal metallicity distribution that would point to a composite formation scenario involving different physical processes.

The R-band luminosity function is found to be the same between the inner and outer regions and close to those from measurements for field galaxies. This is remarkable given the variation in the spectral types of galaxies between field and cluster environments. The total B-band luminosity function shows a dip at MB=–18 mag, in agreement with previous studies. The luminosity function is studied in B–R color intervals and shows a steep faint-end slope for red (B–R>1.35) galaxies, at both the core and outskirts of the cluster. This population of low-luminosity red galaxies has a higher surface density than the blue (B–R<1.35) star-forming population and dominates the faint end of the Coma Cluster luminosity function. It is found that the relative number of high surface brightness galaxies is larger at the cluster core, implying the destruction of low surface brightness galaxies in the dense core environment.

A significant gradient in Mg2, in the sense that galaxies in the core of the cluster have stronger Mg2 is found in a sample of galaxies spanning a wide range of absolute luminosity in the Coma Cluster. The astronomers attribute the Mg2 gradient to changes in metal abundance. One possible mechanism to create this abundance gradient is pressure confinement by the intracluster medium of material from supernova-driven winds early in the history of the galaxies.

The ages of stellar populations in 52 elliptical and S0 galaxies in the Coma Cluster were also investigated. More than 40% of the S0’s are found to have undergone star formation in their central regions during the last 5 Gyr, while such activity is absent in the ellipticals. Galaxies in this sample have absolute magnitudes in the range –20.5<MB<–17.5, and the fraction of S0 galaxies with recent star formation is higher at fainter luminosities. The observed luminosity range of S0 galaxies with signs of recent star formation activity is consistent with them being the descendants of typical star-forming spirals at intermediate redshift whose star formation has been halted as a consequence of the dense environment.

THE CENSUS OF PLANETARY NEBULAE IN THE LOCAL GROUP

INT+WFC

Planetary Nebulae (PNe), the fate of the vast majority of stars with a mass similar to the Sun or a few times higher, represent a short but well characterised stage of stellar evolution. It is the time at which stars experiment their last thermonuclear burning on the surface of a core that has been left naked by strong mass loss during the previous red giant phase. The combination of a hot luminous star (up to 500,000K and to more than 10,000 solar luminosities) and a low density expanding wind, allows the formation of extremely luminous nebulae that reprocess the energetic continuum radiation from the stellar nucleus into specific emission-line spectra from atomic ionised gas. This makes PNe easily observable in our own Galaxy, but equally well detectable in external galaxies even with relatively small telescopes.

The technique used for searching PNe in external galaxies is almost invariably that of obtaining a narrow-band, continuum-subtracted image in a filter isolating the forbidden emission at 5007Å from double-ionised atomic oxygen [OIII]. A large fraction of the total luminosity of the star is in fact concentrated in this line, and this is the unique property that makes individual stars in the planetary nebula phase visible to very large distances: up to several hundred solar luminosities can be emitted in a single and very narrow spectral line. Observation of the hydrogen Hα line, also very bright, is sometimes added to discriminate against the detection of highly redshifted galaxies (e.g. [OII] emitting galaxies at redshift z=0.34, which shifts the O+ emission to the rest wavelength of [OIII]5007, or Lyman-α emitters at redshift 3.1), or to estimate the ionisation class and discuss possible contamination by compact HII regions. Another basic criterium to select candidate extragalactic PNe is that they are not spatially resolved by ground based imaging, their sizes being usually a fraction of a parsec which translates into a couple of hundredth of an arcsec at a distance of 1 Mpc, approximately the outer edge of the Local Group.

PNe in external galaxies provide a tool to investigate some important astrophysical problems. First of all, their number reflects the total mass of the underlying stellar population from which they derive. Extragalactic PNe also provide important information on the chemical evolution of the host galaxies, as the nebular abundances of elements like oxygen, neon, sulphur, or argon, do not vary significantly during the evolution of low-mass stars. Therefore the abundances of these elements probe the initial metallicity of their environment at the time when their progenitors were born. This covers a range in ages that can be hardly covered using other classes of stars. Moreover, nowadays PNe are used as reliable extragalactic distance indicators, through the invariance of their luminosity function with galaxian type and metallicity. And finally, as they are also detected in stellar systems of low surface brightness, they are extremely valuable test particles to map the dynamics of stars in galaxies up to very large galactocentric distances.

For the reasons above, an intense search for PNe in nearby galaxies, as one of the main objectives of the Local Group Census (LGC), was started. The LGC is a narrow-band survey of the galaxies of the Local Group observable from La Palma, that was awarded observing time within the INT Wide Field Imaging Survey programme. The aim of the survey is to find, catalogue and study old and young emission-line populations (e.g. HII regions, PNe, supernova remnants, Luminous Blue Variable Stars (LBVs), Wolf-Rayet stars, symbiotic binaries, etc.) to unprecedented levels. The value of narrowband [OIII], Hα, [SII], and HeII images is enhanced with complementary broad band data (g, r, i). This enables, in principle, the linkages between stellar populations to be probed.

The first part of the analysis of the survey data has been focused on the search for PNe in dwarf irregular galaxies of the Local Group. This is of particular interest as dwarf galaxies are the most numerous galaxies in the nearby universe. According to the hierarchical scenarios of galaxies formation, dwarf galaxies are the first structures to form and from them merging larger galaxies are built. The Local Group, which appears to the rest of the universe as an ordinary collection of dwarf galaxies (90% of its 40 known members) dominated by two main spiral galaxies, is an ideal laboratory as the low-luminosity dwarf galaxies can be studied in detail.

Before this census, only a small number of PNe were known in the dwarf irregular galaxies of the Local Group. With the present survey, so far 16 PNe in IC 10, 5 in Sextans B and 3 in IC 1613 were newly discovered, while the existence of one candidate planetary nebula in Leo A, one in Sextans A, and about 25 in NGC 6822 were confirmed. No PNe are instead found in GR8, as expected because of the small luminosity of this galaxy.

The Local Group Census detections provide a more complete view of the population of PNe in the Local Group. With these new data, the picture appears to be consistent with the predictions of the stellar evolution theories, as the number of observed PNe in each galaxy scales reasonably well with the luminosity of the galaxy. In spite of this agreement, there are also some interesting peculiarities. For instance, Sextans A and Sextans B have very similar V-band luminosities and mass, but while five PNe were discovered in Sextans B, only one candidate is detected in Sextans A. Statistically, this difference is only marginally significant, but may suggest some differences in their star formation history, as evidenced by the stronger main-sequence population of Sextans A compared to Sextans B.

The behaviour of the numbers of planetary nebulae with galaxy metallicity was also investigated, and found a possible lack of PN when [Fe/H]lessless –1.0, which might indicate that below this point the formation rate of PNe is much lower than for stellar populations of near solar abundances. This might in turn be related to the mass loss mechanism in evolved red-giants, that is governed by radiation pressure on dust grains, and is therefore sensitive to a significant deficiency of heavy elements in the stellar atmosphere.

Another result of the survey is the discovery of candidate planetary nebulae at large galactocentric distances, like in the case of IC 10 where they cover an area of 3.6×2.7kpc, much more extended than the 25 mag×arcsec–2 diameter (1.1×1.3 kpc).

The new detections of the LGC project are a starting point for future spectroscopical studies of individual objects, aimed at confirming their nature as PNe and, more important, at determining their physical and chemical properties and those of their host galaxies.

Figure 14
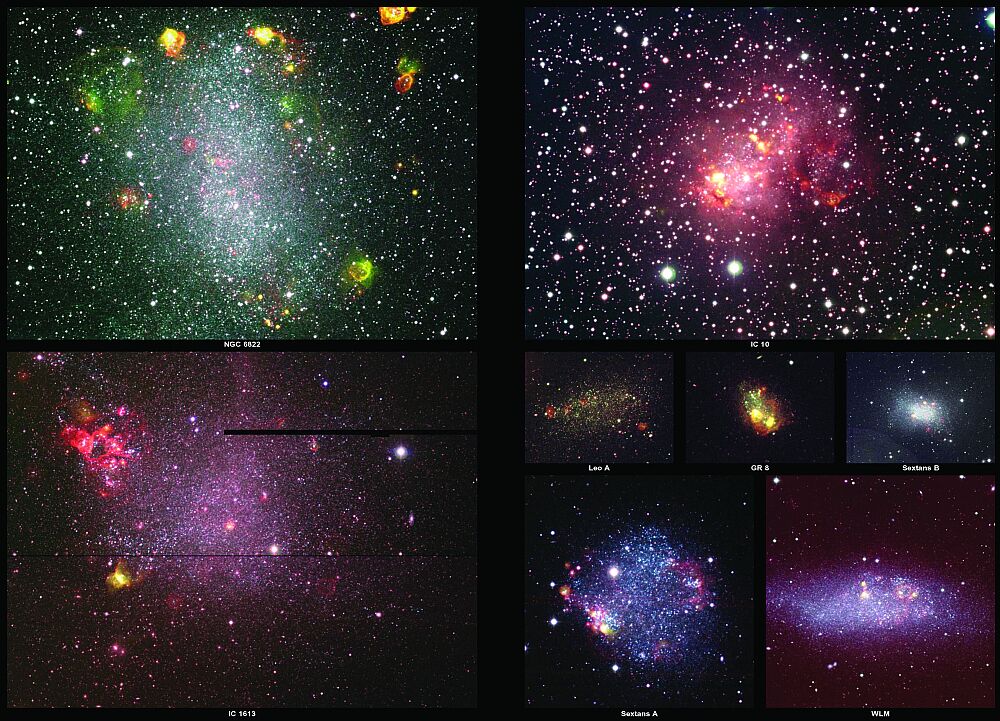
Figure 14. The data are illustrated in these colour figures; in each image green is the [OIII] emission, red the Hα one, while blue corresponds to the broad band Sloan-g images, mainly dominated by continuum stellar emission. In these images, planetary nebulae stand out as green or yellow dots (a striking example is the green luminous object on the upper-left side of the image of Leo A). [ JPEG | TIFF ]

DIRECT CONFIRMATION OF TWO PATTERN SPEEDS IN THE  DOUBLE-BARRED GALAXY NGC 2950

JKT+CCD

Large-scale bars are present in some two-thirds of all disk galaxies. Secondary stellar bars within large-scale bars are also common, occurring in about one-third of the barred galaxies. Interest in secondary stellar bars is motivated by the hypothesis that they are a mechanism for driving gas to small radii to feed the supermassive black holes powering active galactic nuclei. However, the efficiency of such transport is uncertain because of the lack of knowledge of the pattern speeds of the primary and secondary bars. Whereas a number of pattern speeds of large-scale bars have been measured, no such measurements in nested systems have been performed yet. The presence of nested bars with different pattern speeds has been inferred largely on the basis of their apparently random relative orientations. Secondary bars can naturally form and survive for more than a few rotation periods in pure stellar disks. However, simulations have also found other possibilities, including cases in which two stellar bars counterrotate.

An ideal target for measuring primary and secondary pattern speeds is the galaxy NGC 2950, which is a large and bright early-type barred galaxy. NGC 2950 is classified RSBO(r), and the presence of a secondary stellar bar has been discussed by several authors. The secondary bar of NGC 2950 has an intermediate inclination, and both bars have intermediate position angles between the major and minor axes of the disk and no evidence of spiral arms, patchy dust, or significant companions.

The photometric observations of NGC 2950 were carried out at the Jacobus Kapteyn Telescope. The astronomers took multiple exposures in the Harris B, V, and I bandpasses using the SITE2 CCD, and the spectroscopic observations were carried out at the Telescopio Nazionale Galileo.

The astronomers found that the primary bar in NGC 2950 is rapidly rotating. If this is the norm in this type of galaxies, then it guarantees that primary bars are efficient at funnelling gas down to the radius of influence of secondary bars. They also establish that in NGC 2950 the two bars have different pattern speeds, with the secondary bar having a larger pattern speed. This is the first time this is measured directly.

Figure 15
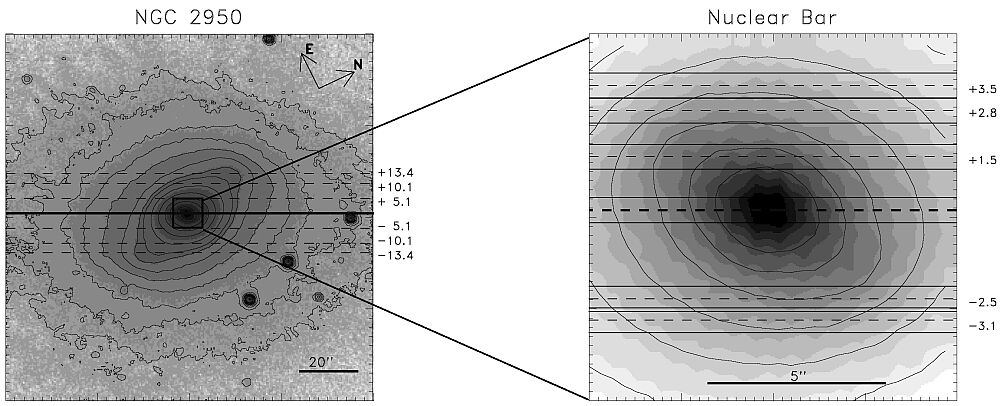
Figure 15. Left panel: Large-scale image of NGC 2950 showing the primary bar and disk with I-band contours and slit positions overlaid. Right panel: Zoom into the central region of NGC 2950 showing its secondary bar. [ JPEG | TIFF ]

EXTENDING COSMIC SHEAR MEASUREMENTS WITH THE WHT

WHT+PFC

Weak gravitational lensing of background galaxies by intervening large-scale structure (‘cosmic shear’) provides direct information about the total mass distribution in the universe, regardless of its nature and state. Thus a measurement of cosmic shear bridges the gap between theory, which is primarily concerned with dark matter, and observation, which generally probes only luminous matter. The recent detection of coherent distortion of faint galaxies using the WHT in 2000 have triggered great interest in the provision of new constraints on the amount and distribution of dark matter, together with measurements of several cosmological parameters.

If intrinsic galaxy orientations are essentially random in a given survey, any coherent alignment must arise from distortion due to weak lensing. Light paths from galaxies projected close together on the sky pass through, and are gravitationally distorted by, the same dark matter concentrations. This coherent distortion contains valuable cosmological information. In particular, the variance of the distortion field measures the amplitude of density fluctuations (~σ8 Ω0.5m ). This shear measurement is free from assumptions about Gaussianity or the mass-temperature relation, and whilst the shear-based measurement is currently comparable in precision to that from local cluster abundance, further progress is limited solely by the number of fields observed.

The validity of results from cosmic shear surveys depends sensitively on the treatment of systematic errors. A further issue arises from sample (or ‘cosmic’) variance, the impact of which can be limited by using numerous independent sightlines to complement panoramic imaging of a few selected areas. With these motivations in mind, a team of astronomers compared the cosmic shear observed with two independent instruments (Keck and WHT), using two different survey strategies.

Astronomers extended the original detection of the cosmic shear on the WHT by increasing the number of observed fields, with a further increase in area as a result of the larger 16×16arcmin2 size of field with the new prime focus mosaic camera. The aim of the survey was to acquire deep (z bq 1) fields representing numerous independent lines of sight, sufficiently scattered to sample independent structures and thus to minimise uncertainties owing to sample variance. These lines of sight were chosen in a quasi-random fashion, without regard to the presence or absence of mass concentrations, in order to obtain a representative sample of the mass fluctuations in the universe.

The cosmic shear with both Keck and WHT was measured at a signal-to-noise of 5.1, finding an amplitude of the matter power spectrum of σ8m/0.3)0.68=0.97±0.13, with 0.14<Ωm<0.65, including all contributions to the 68 per cent confidence level uncertainty: statistical noise, sample variance, covariance between angular bins, systematic effects and redshift uncertainty. A measurement of this quantity from cosmic shear is cosmologically valuable, as it represents a direct measure of the amplitude of mass fluctuations. These results for Keck and WHT are consistent with each other. The joint results are also consistent with other recent cosmic shear measurements. However, they cannot rule out lower cluster-abundance normalisation which has been derived recently. This discrepancy, if confirmed, could arise from unknown systematics in either the cluster or cosmic shear methods. It is important to understand the origin of the discrepancy between cosmic shear and cluster abundance methods. If this is not explained by such systematics, it could point towards a failure of the standard LCDM paradigm, and therefore have important consequences for cosmology.

Figure 16
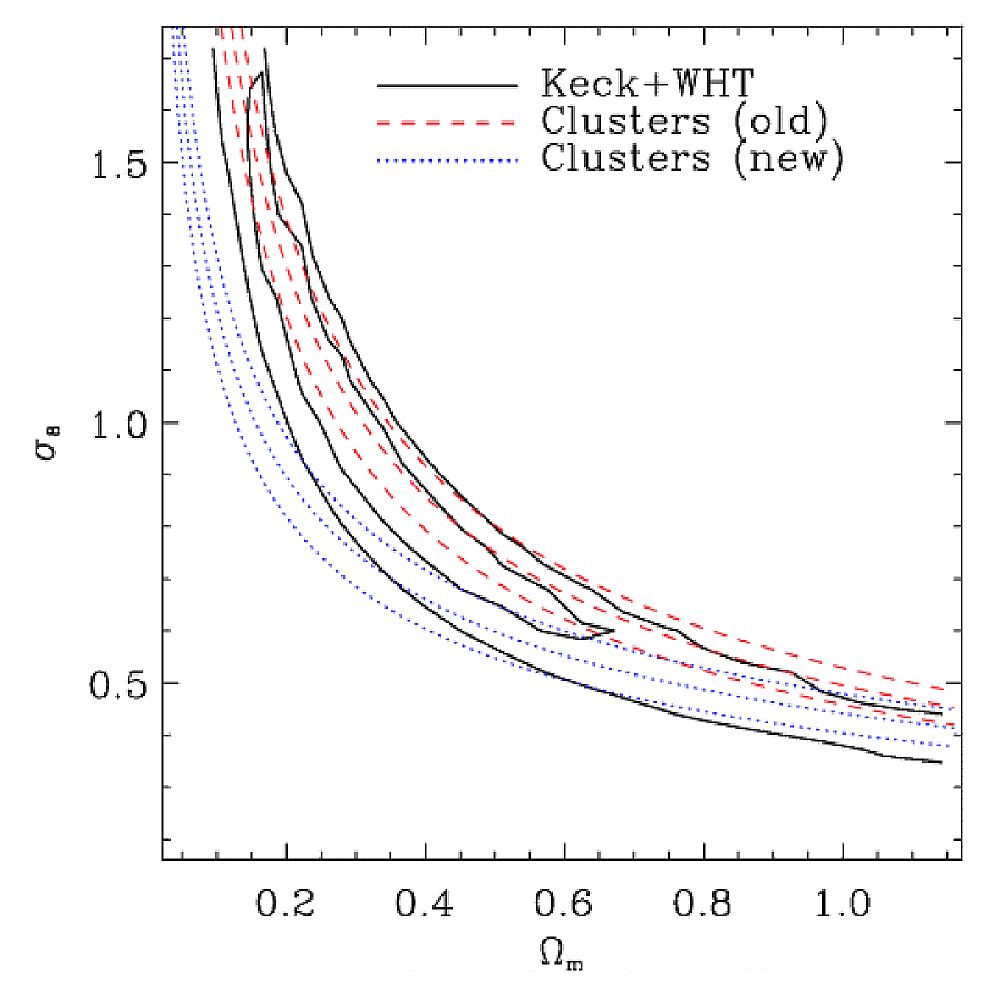
Figure 16. Constraints on the joint distribution of Ωm and σ8 for the combination of Keck and WHT measurements. [ JPEG | TIFF ]


Previous: Introduction | Up: Table of Contents | Next: Chapter 2. Operation, Maintenance and Enhancements

© 2004 Isaac Newton Group of Telescopes