Investigation of ISIS astigmatism
Is ISIS astigmatic?
A spectrograph is astigmatic if rays that propagate in two perpendicular
planes have different foci. This means that a collimator which is used to focus
the spectrograph will be at different position for the best focus of spectral features
in spatial and spectral (dispersion) direction.
A narrow dekker with an aperture of 0.3" in a spatial direction placed above the slit was used
to investigate a spatial profile of a spectrum for a given best spectral focus.
Relatively large differences (of up to 2500 microns) were found between the best spatial and
spectral foci, and differences were more prominent in the blue arm.
These differences became smaller when the spectral focus was achieved for a
smaller collimator value. Ultimately, the two foci (in spatial and spectral
direction) have never over-lapped as the lower limit of the collimator moving mechanism was reached.
Following this finding, during December 2011, January and February 2012 ISIS blue arm was entirely
checked and few things re-aligned resulting in a very good image quality obtained for the nominal
blue collimator value of 5400 microns (NB at that time, the nominal collimator
value was 5700, but ISIS has got new PLC controllers in February 2012
which slightly moved the collimator zero point).
However, as a dekker is not placed exactly on top of the slit but is 2.8 mm above the slit,
the dekker aperture will be de-focused in the image plane. In order to estimate amount of
astigmatism of ISIS we performed on-sky observations, described in the following
section, without a need to use a dekker.
How to define anastigmatic region
Anastigmatism of the spectrograph can be achieved by focusing the
spectrograph in the range that is close to nominal spectral focus (so called
spectrograph auto-collimation value) and also has acceptable values of the
spatial focus. In order to determine such a range for both arms we proceeded
as following:
the spectrograph was set-up in red and blue arms to give the best spectral focus.
the best telescope focus was determined and set.
for both arms, the collimator value was changed with small steps to both sides
from the previously determined best spectral focus. In each step position of the collimator,
an exposure was taken and the full width at half maximum (FWHM) of the spatial profile was
determined.
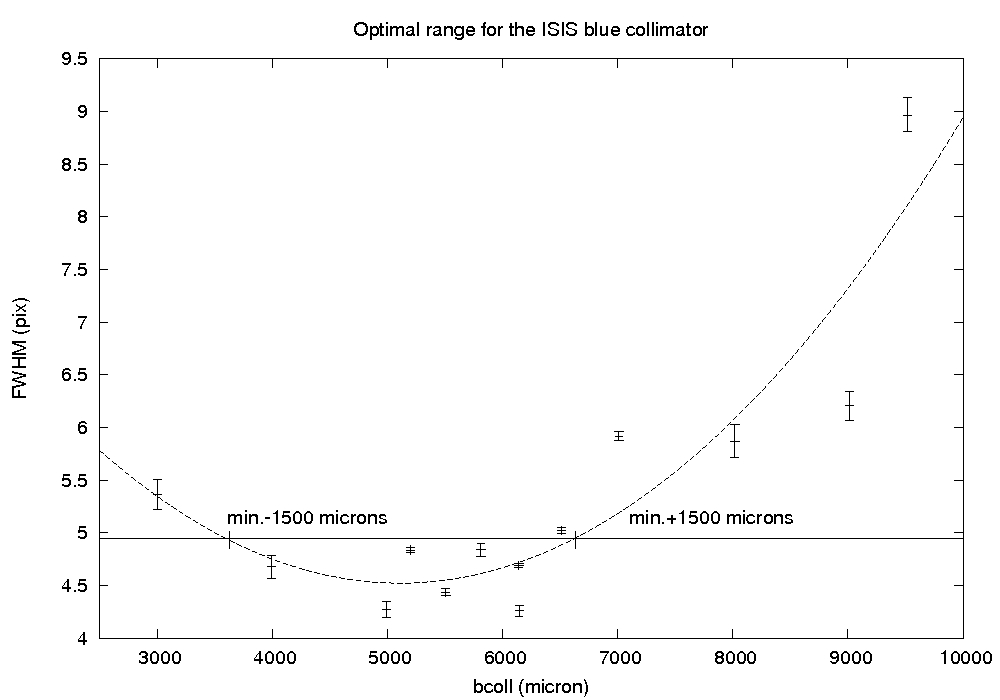
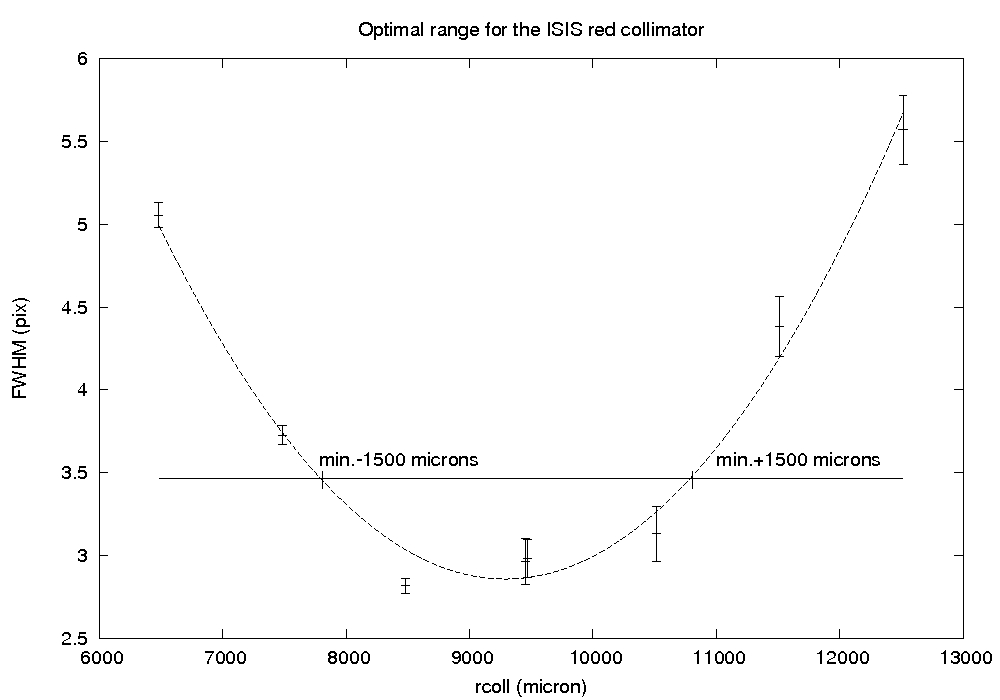
The measurement of FWHM of the spatial profile is plotted against the collimator value
in figures below. Each point is a mean of several FWHM measurements at different positions along the
dispersion direction and an error is a standard deviation. A quadratic
function was fitted to the data (dashed line). The minimum of a parabola
approximates the best spatial focus. If we accept an error of the spatial
focus of up to 2 pixels added in the quadrature with a spatial FWHM
(corresponding to 0.44" in the red arm and 0.4" in
the blue arm, still well below the mean seeing of La Palma), then the range
of acceptable spectral and spatial foci would be the parabola minimum
± 1500 microns for both arms. However, the spectrograph nominal
spectral focus has to be taken into account. By coincidence, for the red arm the minimum of
parabola agrees with the nominal spectral focus of 9300 microns, thus the
optimal range without any other optical elements in a light path
is 9300 ± 1500 microns. For the blue arm, the minimum of
parabola is 300 microns less than the nominal spectral focus of 5400
microns, thus the optimal range is 5100 ± 1500 microns.
Both arms were tested on 21st May 2012, when the seeing was around 0.8-0.9" and
not stable. The red arm was tested again in much better conditions on 1st June 2012,
when the seeing was around 0.6" and stable, and these measurements
superseded the previous ones in worse seeing. It would be useful to repeat
this test in the future for the blue arm, in better and more stable seeing.
Useful numbers for support
astronomers
Below are acceptable ranges of collimator values for the red and blue arm.
The focus offset for the order-sorting filter GG495 and for the dichroic
5300 in the red arm was measured several times in summer 2012 and is +800
microns for the filter GG495 and +860 microns for the dichroic 5300.
These focus offsets have to be taken into account when defining
acceptable collimator range in order to keep the same focal length between
the slit and the collimator. At the same time, as the grating is placed
between the collimator and CCD,
gratings
offsets do not change the acceptable collimator range.
Focus offsets for dichroics other than 5300 can be found
here.
ISIS red arm collimator optimal range |
GG495 |
D5300 |
Optimal range (microns) |
Optimal value (microns) |
No |
No |
7800 - 10800 |
9300 |
No |
Yes |
8660 - 11660 |
10160 |
Yes |
No |
8600 - 11600 |
10100 |
Yes |
Yes |
9460 - 12460 |
10960 |
ISIS blue arm collimator optimal
range |
Optimal range (microns) |
Optimal value (microns) |
3600 - 6600 |
5100 |


