Below is a series of plots which show monthly variations of some relevant atmospheric factors measured at the Roque de los Muchachos Observatory (mainly at the JKT meteorological mast) that might alter the human health condition, and which could also generate some of the symptons related to altitude sickness. The meteorological data used here were obtained using the ING weather stations. Refer to the site quality pages for an analysis of the astronomical observing conditions.
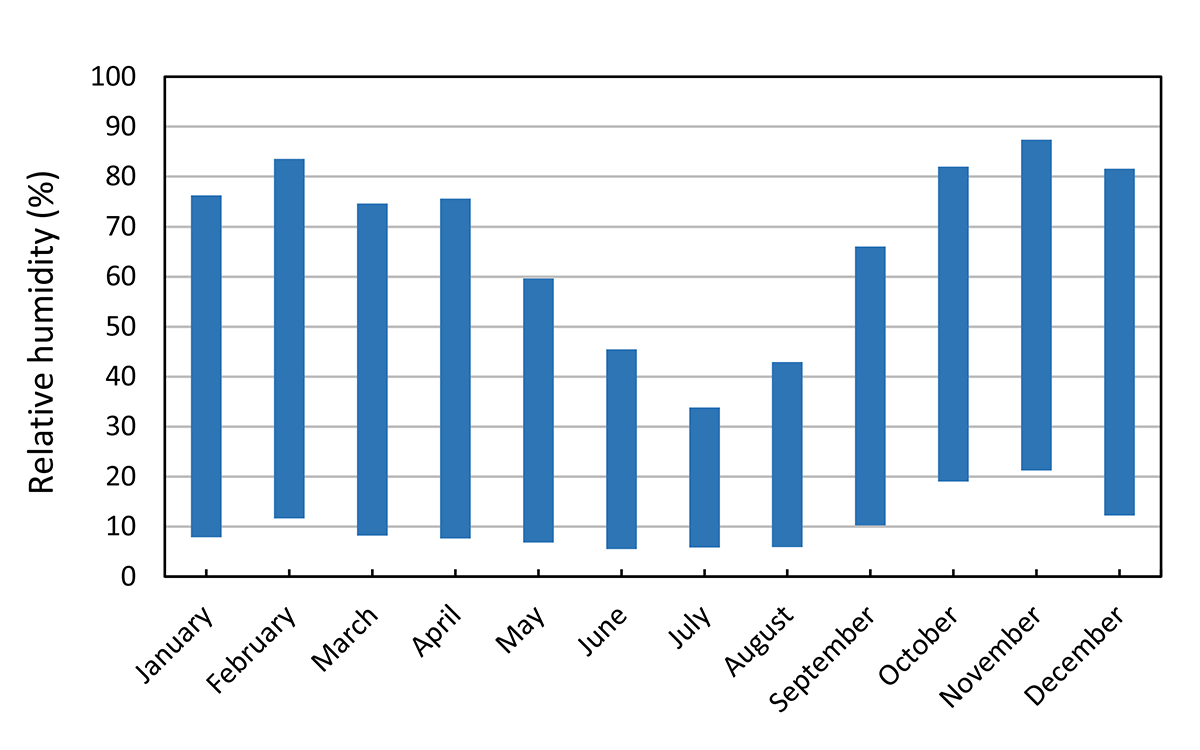
Relative Humidity
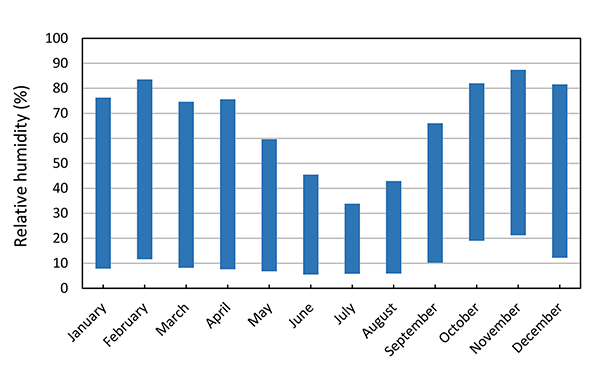 |
Each bar shows a one-sigma variation of the average monthly relative humidity as recorded from 2000 to 2019. In general, humidity can be frequently low, being July the driest month. |
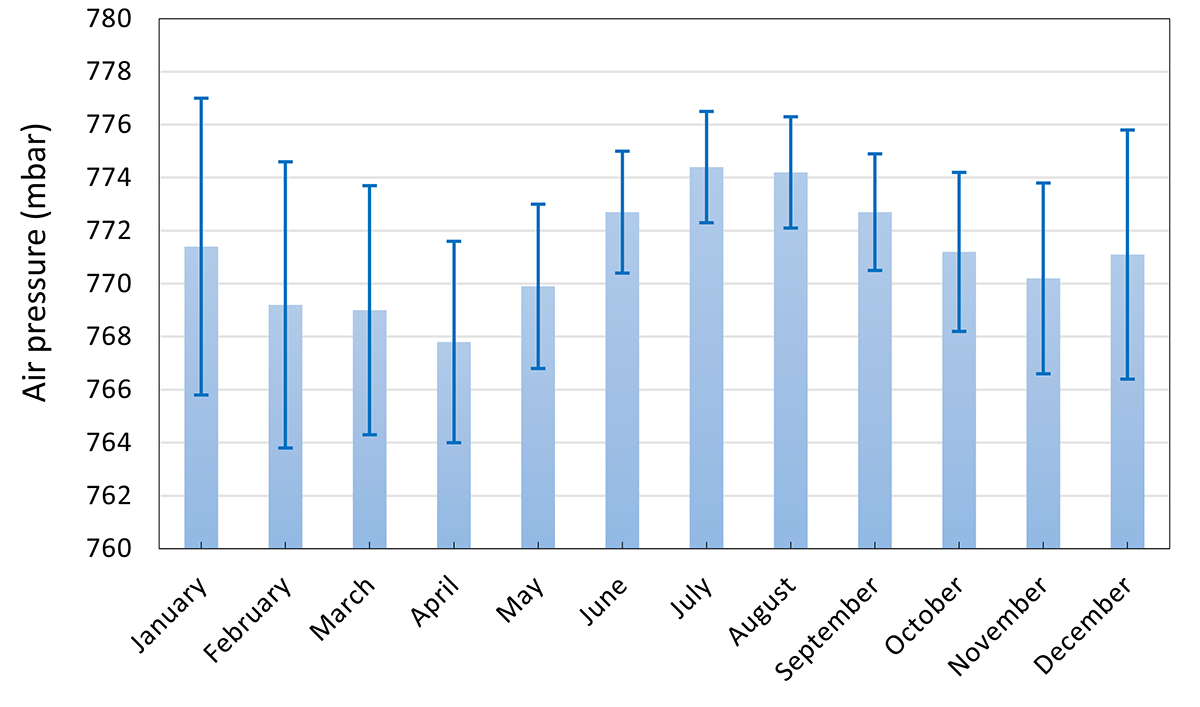
Air Pressure
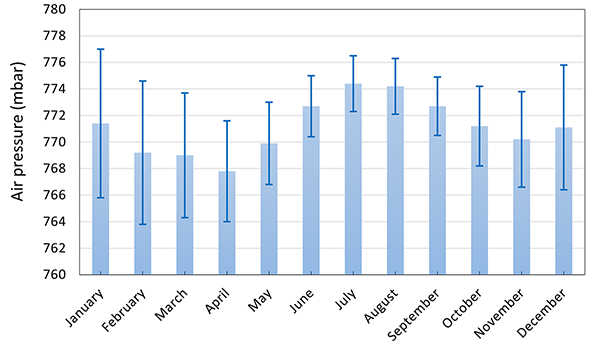 |
Each bar shows the average monthly air pressure and one sigma variation as recorded from 2000 to 2019. The lowest monthly value is 767.8±3.8 mbar (April) while the highest value is 774.4±2.1 mbar (July). This low pressure could generate hypobaric symptons. |
Daytime Temperature
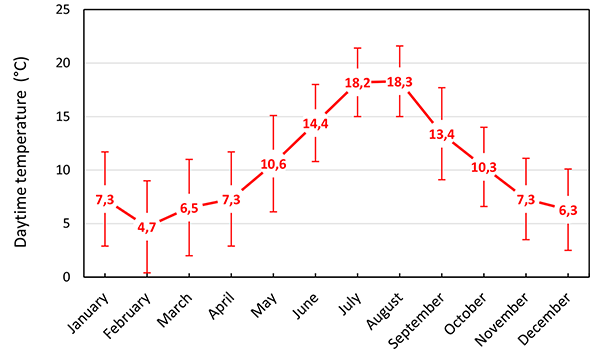 |
Monthly average daytime temperature and one-sigma variation in the time range 09:00-17:00 UT and as recorded from 2000 to 2019. February is the coolest month in daytime. Absolute highest temperature (35.6 °C) was measured on 28th Jul, 2008. Lowest temperature was recorded on 28th January, 2007 (-9.8 °C). |
Nighttime Temperature
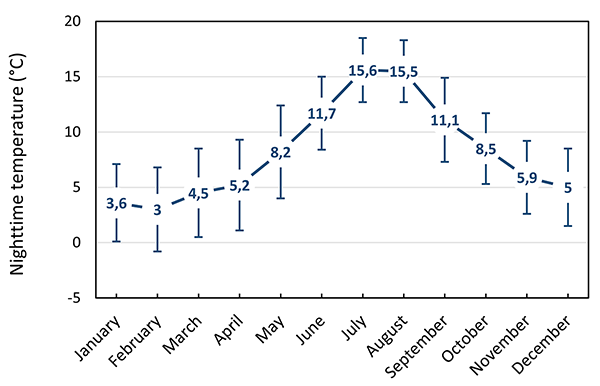 |
Monthly average nighttime temperature and one-sigma variation in the time range 22:00-07:00 UT and as recorded from 2000 to 2019. February is the coolest month at night. Absolute highest temperature (22.9 °C) was achieved on 30th Aug, 2005. Lowest temperature was recorded on 17th March, 2007 (-9.8 °C). |
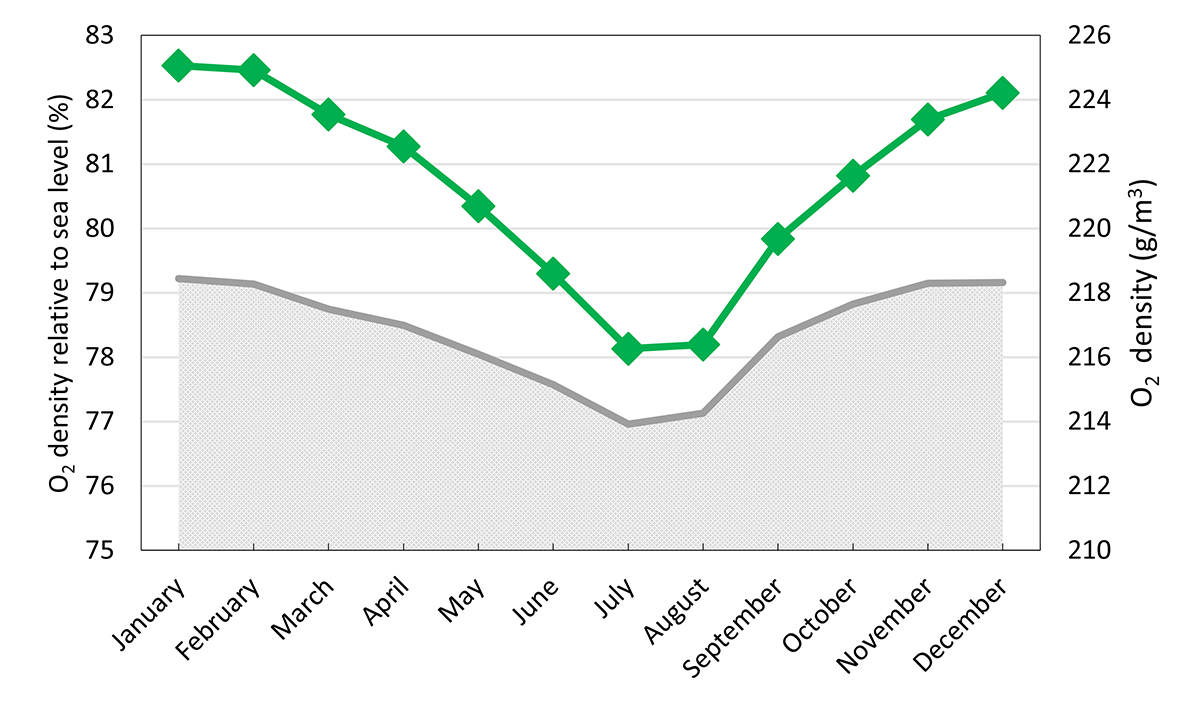
Air Oxygen Density
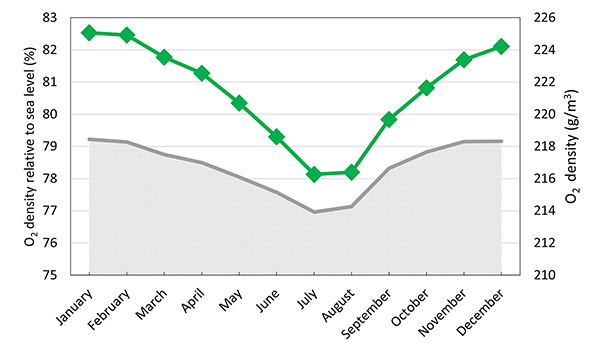 |
Green: monthly average of oxygen density as recorded from 2000 to 2019 (oxygen density is a function of temperature, pressure and humidity). Grey: variation of oxygen density relative to sea level. In general, oxygen density at the ORM is around 78% the oxygen density at sea level. The lowest value is obtained in July. In general, a low relative oxygen density like this could generate hypoxia symptoms in some individuals. |
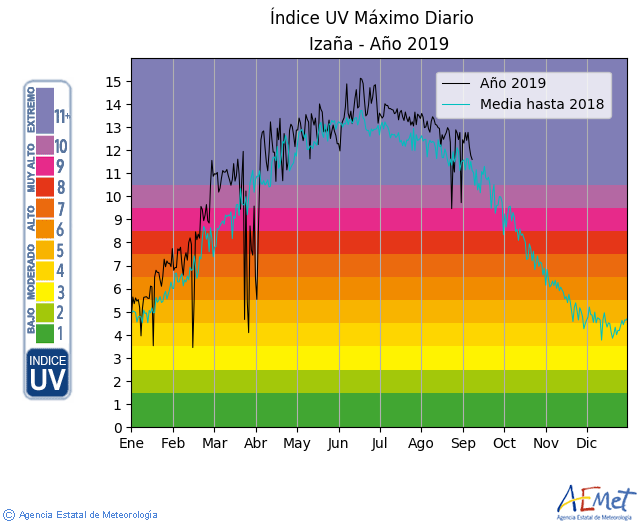
Ultraviolet Index
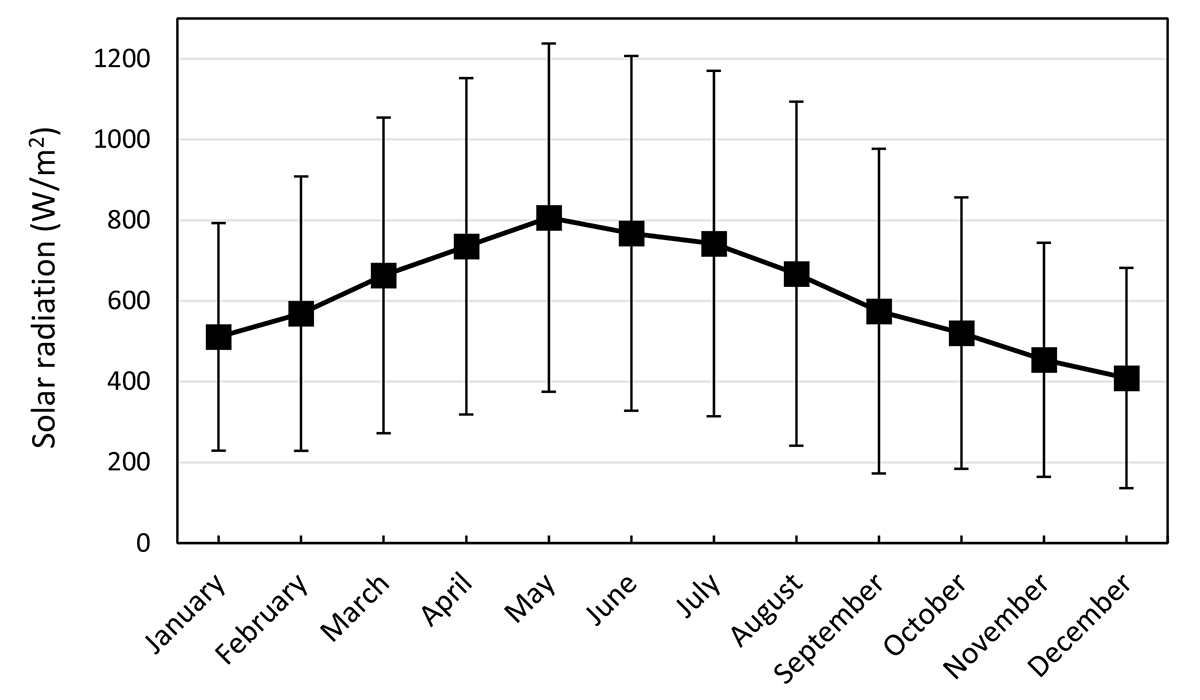
Solar Radiation
|