Statistical results from the ING DIMM
Astronomical seeing - the standard model
How a DIMM works
The DIMM measures the strength of the aberrations due to atmospheric turbulence, and then predicts the seeing FWHM for a large telescope assuming the standard seeing model. The aberration strength is parametrised by Fried's parameter (r0). Small values of r0 indicate strong turbulence, and hence poor seeing.
DIMM surveys carried out by the Instituto de Astrofisica de Canarias at other locations on the La Palma site have yielded similar results (Muñoz-Tunón, et al, 1998).
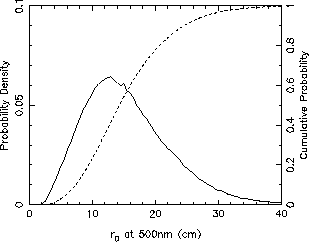
Distribution of Fried's parameter r0 measured with the ING DIMM seeing monitor, determined from 267379 values recorded on 233 nights between October 1994 and August 1998. The median value is r0 = 14.9cm.
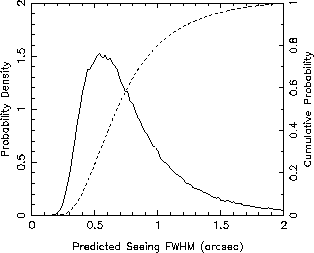
Distribution of predicted
seeing FWHM values (0.98 lambda/r0) from the ING DIMM seeing monitor,
for the same data set. The median value is FWHM = 0.69 arcsec.
Astronomical
seeing - the standard model
Starlight propagating through the Earth's atmosphere suffers random aberrations as it passes through regions where there is turbulent mixing of air of different temperatures and hence refractive indices. Atmospheric sounding experiments at La Palma and elsewhere have shown that such mixing typically occurs in a small number of layers, each a few tens of metres thick (Vernin, 1994). The strongest layers, in terms of the resulting optical distortion, are normally at low altitudes, with the majority of the seeing aberrations typically originating from less than 2km above the telescope.
At the focus of a large telescope the effect of these aberrations is to form a rapidly changing 'speckle' image. The long exposure PSF is then the co-addition of a large number of random speckle realisations, resulting in an approximately Gaussian PSF with FWHM typically in the range 0.5 to 2 arcseconds at a good observing site.
The standard model for astronomical seeing, developed largely by Tatarski (1961) and Fried (1965), is based on the work of Kolmogorov (1941) on atmospheric turbulence. The analysis has been reviewed in detail by Roddier (1981). The crucial result is that for propagation through turbulence in the Kolmogorov model the structure function Dp(r) of the wavefront phase perturbations p(r) at ground level scales as separation r to the 5/3 power:
Dp(r) = <[p(r') - p(r'-r)]2> = 6.88 (|r|/r0)5/3where the scaling length r0 is known as Fried's parameter, and is a measure of the strength of the seeing distortions. For this structure function the seeing limited FWHM of the long exposure PSF for a telescope with diameter much larger than r0 is given by:
FWHM = 0.98 lambda / r0where lambda is the wavelength of observation. Since r0 scales as (lambda)6/5 , the image FWHM has only a weak (lambda-1/5) dependence on wavelength. The typical size of the Fried length at a good observing site is 10cm at 500nm, which yields a long exposure image width of approximately 1 arcsecond. It is important to note that the observed image FWHM will be equal to that predicted by this equation only if there is no contribution to image width from other sources such as telescope focus or tracking errors.
For the theoretical Kolmogorov/Tatarski structure function, seeing distortions of the wavefront extend to infinitely large spatial scales. In reality an upper limit is imposed by the finite thickness of the contributing turbulent layers. Hence the 5/3 scaling will apply only to spatial scales smaller than an upper limit known as the outer scale of turbulence L0. If the outer scale is not much larger than the telescope aperture diameter, then the image FWHM will be smaller than 0.98 lambda / r0, particularly at long wavelengths.
The ING DIMM is based upon a 20cm Celestron telescope with its entrance pupil masked to form two apertures with diameter 60mm and separation 140mm. A wedge prism covers one aperture so that two separated images of a bright star are produced at the telescope focus, where they are recorded by an intensified CCD camera. A frame rate of 25Hz allows the image motions to be recorded. The instrument is mounted on an open tower approximately 100 metres from the WHT building, so that dome seeing and low level ground-to-air seeing effects are also avoided.
For the Tatarski spectrum of wavefront phase fluctuations, the variance of the differential image motion in the direction parallel to the aperture alignment sl2 is related to r0 by
sl2 = 2 lambda r0-5/3 [0.179 d-1/3 - 0.0968 r-1/3 ]where d is the diameter of the apertures and r their separation. A similar equation gives the orthogonal component of the differential image motion st2. The variances sl2 and st2 are estimated from the measured image motions (typically averaged for 15 seconds), and a value for r0 is obtained from the equation above. A prediction of the long exposure image FWHM is then given by 0.98 lambda / r0. The uncertainty of the seeing estimates, determined mainly by photon noise, is typically less than 5 per cent. The seeing values are corrected for zenith distance z, using the formula:
r0(zenith) = r0(z) sec(z)0.6
The DIMM FWHM prediction assumes that the spatial spectrum of wavefront
aberrations is well described by the Tatarski structure function.
Furthermore, measurements are made only on the 140mm baseline which separates
the DIMM apertures - a much smaller scale than the 4.2m aperture of the
WHT. The accuracy of the DIMM seeing estimates for the WHT is therefore
dependent on the validity of the Kolmogorov turbulence model for the spatial
scales of interest. In particular, the DIMM will over-estimate the seeing
for the WHT if the outer scale of turbulence is not much larger than
the WHT aperture size.
- Fried, D.L., 1965, J. Opt. Soc. Am., 55, 1427.
- Kolmogorov, A.N., 1941, in Tikhomirov, V. M., ed, Selected works of A.N. Komogorov, Mathematics and its applications (Soviet series), Klewer Academic press (1991).
- Muñoz-Tunón, C., Varela, A.M., Mahoney, T., 1998, New Astronomy Reviews, 42, 409.
- Roddier, F., 1981, in Wolf E., ed, Progress in Optics 19, North Holland, Amsterdam.
- Tatarski, V.I., 1961, Wavefront Propagation in a Turbulent Medium, Dover, New York.
Vernin, J., & Muñoz-Tunón, C., 1994, AA, 284, 311.