- Akerlof, C. et al., 1999, Nature, 398, 400. ADS
- Blaes, O. M. & Webster, R. L., 1992, ApJ, 391, L63. Citation in article | ADS
- Bloom, J. S. et al., 1999, Nature, 401, 453. Citation in article | ADS
- Frail, D. A. et al., 1997, Nature, 389, 261. Citation in article | ADS
- Galama, T. J. et al., 1998a, ApJL, 500, L101. Citation in article | ADS
- Galama, T. J. et al., 1998b, ApJL, 500, L97. Citation in article | ADS
- Galama, T. J. et al., 1998c, ApJL, 497, L13. Citation in article | ADS
- Galama, T. J. et al., 1998d, Nature, 395, 670. Citations in article: 1, 2, 3 | ADS
- Galama, T. J., Vreeswijk, P. M., Tanvir, N. et al., 1999, ApJ, in press. Citation in article
- Galama, T. J. et al., 1999, Nature, 398, 394. Citation in article | ADS
- Kulkarni, S. R. et al., 1998, Nature, 393, 35. Citation in article | ADS
- Kulkarni, S. R. et al., 1999, Nature, 398, 389. ADS
- Metzger, M., et al., 1997, Nature, 387, 878. Citation in article | ADS
- van Paradijs, J. et al., 1997, Nature, 386, 686. Citation in article | ADS
- Vreeswijk, P. M. et al., 1999, ApJ, submitted. Citation in article
| THE ING NEWSLETTER | No. 2, March 2000 |
|
|
SCIENCE |
|
|
|
| Previous: | WHT Achieves First Direct Detection of an Extra-solar Planet | Up: | Table of Contents | Next: | The Sakurai Object: A Case Study in Advanced Stellar Evolution |
Other available formats: PDF | gzipped Postscript
Gamma-Ray Burst Afterglows: Surprises from the Sky
P. Vreeswijk1, N. Tanvir2, T. Galama3
1: Astronomical
Institute "Anton Pannekoek"; 2: Astronomy Research Group,
University of Hertfordshire; 3: California Institute of
Technology
The GRB field of astronomy has experienced a cascade of astonishing discoveries and new surprises over the past three years. In this paper we discuss some of the highlights of GRB afterglows, in which the ING telescopes have played an important role. With the new generation of GRB satellites to be launched, new exciting results are on their way, giving important insights into the nature of the progenitors of GRBs, and also into the high redshift universe.
Afterglow highlights
GRB 970228
Twenty five years after the discovery
of Gamma-Ray Bursts (GRBs), there was still a very strong debate about
their distances. One camp put them in the halo of the Galaxy, the other
among the most distant objects known in the universe. It was expected that
the discovery of a counterpart at other wavelengths would resolve this
issue. Searches for counterparts were not successful because the error
boxes typically had the size of several degrees. Such positions could be
refined by triangulation with the Inter-Planetary Network (IPN), but the
few GRBs with such accurate positions were, with hindsight, not observed
rapidly enough to give a chance of detecting afterglows. With the launch
of the Italian-Dutch satellite BeppoSAX (near the end of 1996), which carries
two X-ray Wide Field Cameras (WFCs) on board, burst positions became available
with typical error circle radii of 3 arcminutes (a factor of ~4000 improvement
in localisation). These positions were made available rapidly (several
hours after the burst). When the second burst detected by one of the WFCs
came along (GRB 970228) the team of the late Jan van Paradijs, consisting
of the two former PhD students Titus Galama and Paul Groot, were ready
for it. They pointed the WHT towards the WFC X-ray source position 21 hours
after the burst, and on March 8, the INT was used for a follow-up image.
Using these images, they were able to identify the first optical counterpart
of a GRB (van
Paradijs et al., 1997), which marked the beginning of a revolution
in our understanding of GRBs (see Figure 1). This discovery, together with
that of the X-ray afterglows discovered by our Italian colleagues with
the Narrow Field Instruments (NFIs) of BeppoSAX is among the top 5 of major
scientific breakthroughs of 1997, according to Science. Later HST
images showed a faint nebula around the optical transient (OT), for which
Keck has now been able to determine the redshift: z=0.695. These results
confirmed that GRBs occur at cosmological distances and together with the
fluxes received at Earth, indicated that GRBs are the most powerful photon
emitters in the Universe.
 |
| Figure 1. Discovery V band images of the first optical counterpart (GRB 970228) (van Paradijs et al., 1997). The image on the left shows the transient on February 28, 1997. The image on the right shows the transient on March 8, 1997. The optical transient is denoted by 'OT'. A late-type star (K-dwarf) is also indicated. [ GIF | TIFF ] |
The first OT for which the redshift
was determined was GRB 970508: z=0.835 (Metzger
et al., 1997). It was also the first burst for which a radio afterglow
was discovered, by Dale Frail and colleagues (Frail
et al., 1997), and the ING observations of this burst showed evidence
for a spectral transition (Galama
et al., 1998a). Titus Galama and co-workers also constructed a radio
to X-ray spectrum at day 12 after the burst and showed that the observations
can be understood in terms of the relativistic blastwave (or fireball)
model (see Figure 2; the R-band light curve of this burst is also shown).
In this model, a huge amount of energy is dumped into a compact region,
which causes a relativistically expanding blast wave that sweeps up the
surrounding matter. The electrons in the shock are accelerated to a power-law
distribution in energy and radiate synchrotron emission. The bulk of the
electrons have the Lorentz factor gamma-m and radiate near the peak frequency
nu-m (corresponding to gamma-m). This produces the typical synchrotron
spectrum shown in sections II and III of Figure 2. Section I is modified
by synchrotron self absorption (frequency nu-a), and section IV is located
above the electron cooling frequency (nu-c); cooling causes a steepening
of the spectrum. As the blast wave slows down, the peak and cooling frequencies
move to lower frequencies as a power-law in time, which, together with
the fact that the spectral shape is also a power-law (in distinct regions),
causes a power-law decline of the afterglow.
 |
 |
| Figure 2. Left: The X-ray to radio spectrum of GRB 970508 on May 21.0 UT (12.1 days after the event). Three break frequencies are indicated, corresponding to synchrotron self-absorption, nu-a, the peak, nu-m, and the transition to rapid electron cooling, nu-c (from Galama et al., 1998b) [ GIF | TIFF ]. Right: Rc band light curve of GRB 970508, based on ING data. A power law fit is represented by the solid line. Indicated by the dashed line is a fit of a power law plus a constant, FR = FR0 talpha+ C. Left lower panel: the fit to the power law decay subtracted from the data. Deviations from a power-law decay are only moderate (r.m.s. = 0.15 magnitudes) (from Galama et al., 1998c). [ GIF | TIFF ] | |
GRB 971214
Using the Keck 10-m telescope, Shri Kulkarni and his colleagues, were able to determine the redshift of the counterpart of GRB 971214 at z=3.42 (Kulkarni et al., 1998; the most distant GRB detected so far). The implied energy output, assuming a standard cosmological model and isotropic energy release, was an amazing 3×1053 erg.
GRB 980425
After GRB 970228, the redshift determination of GRB 970508, which showed that GRBs come from cosmological distances, and the outstanding energy output of GRB 971214, the GRB community was waiting for the next surprise from the sky.
On Sunday April 29, 1998, two
of us (Titus Galama and Paul Vreeswijk) were analysing images taken the
days before with the Anglo-Australian Telescope (AAT) and ESO's New Technology
Telescope (NTT). They were frantically looking for a faint stellar-like
object to disappear in later frames, but couldn't find any good candidates.
As Paul was on the phone with his sister, who called him up for his birthday,
Titus shouted out: "Hey, what's this??? Paul, look at this!" It appeared
Titus had discovered the supernova SN 1998bw (see Figure 3 and Figure 4),
which marked the beginning of a revolution in not only the GRB field, but
also the SN community. With our late supervisor Jan van Paradijs, we very
conservatively estimated the chance of finding a supernova in the GRB error
box, with the time of collapse around the time of the burst, and found
it to be 104. This being so small, the notion that some GRBs
and SNe are physically related became fairly hard to reject (Galama
et al., 1998d).
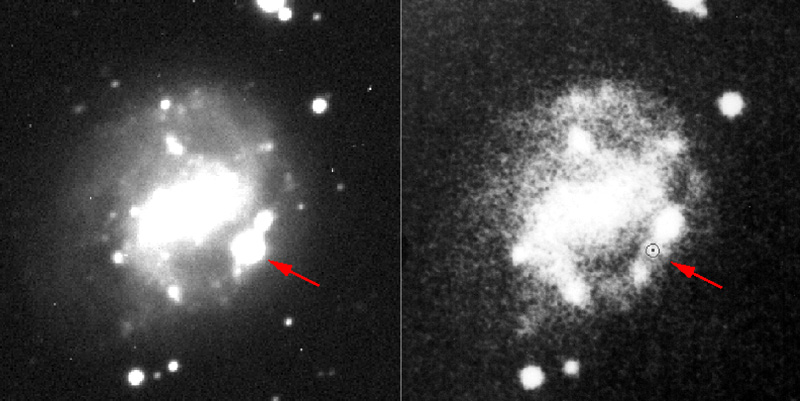 |
| Figure 3. Discovery R band NTT image showing SN 1998bw in the spiral galaxy ESO 184G82 on May 1 1998 (left) and pre-discovery (1976) UK Schmidt Telescope image of ESO 184G82 (right) (from Galama et al. 1998d). [ JPEG | TIFF ] |
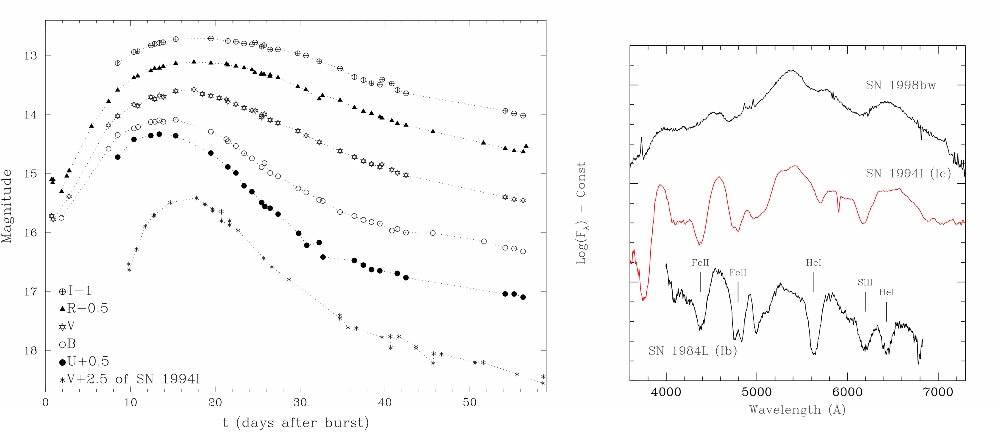 |
| Figure 4. Left: UBVRI light curves of the GRB supernova SN 1998bw (GRB 980425). Time is in days since April 25.91 UT. For comparison the V band light curve of the type Ic SN 1994I is shown. Right: Representative spectra near maximum light of SN 1998bw, SN 1994I, and SN 1984L (type Ib). The overall shape of the spectrum of SN 1998bw is similar to that of a Ic supernova, although the spectral features are less pronounced (from Galama et al. 1998d). [ JPEG | TIFF ] |
Since this discovery, more evidence
for a relation between SNe and GRBs has been found. Josh Bloom and colleagues
suggested that the late-time afterglow of GRB 980326 could be explained
by an underlying SN 1998bw type supernova at a redshift of about unity
(Bloom
et al., 1999). Our team, after re-analysing just about all the available
data of GRB 970228, to minimise differences in analysis by different groups,
has also found evidence for a supernova contributing to the light curve
of GRB 970228 (see Figure 5). These findings call for accurate determination
of afterglow magnitudes, not only at early times, but especially at late
times (~2030 days after the burst), for which the WHT is very suitable.
The link between GRBs and SNe was one of the ten major breakthroughs in
1999 according to Science.
 |
| Figure 5. The V-, Rc-, and Ic-band lightcurves of GRB 970228 (log-log plot of fluxes versus time). The dotted curves indicate power-law decays, fixed at a = 1.46, and redshifted SN light curves. The thick line is the resulting sum of SN and afterglow. This, along with similar evidence for an SN component to GRB 980326 and the connection of GRB 980425 with SN1998bw, suggests that at least some classical GRBs are associated with a class of supernovae (fromGalama, Tanvir, Vreeswijk et al., 1999). [ GIF | TIFF ] |
After nearly two years of afterglow studies, GRBs continued to surprise the community with the discovery of the afterglow of GRB 990123. The first report was of an afterglow of R~18th magnitude, which was not very unusual at around 4 hours after the burst. However, the ROTSE team had slewed their robotic telescope to the burst position only 20 seconds after the BATSE alert and when they analysed their images at the reported position of the afterglow, they found an incredible V~9th magnitude flash, i.e. somebody with binoculars looking at the right part of the sky would have been able to see it! The total isotropic energy output of this burst beat that of GRB 971214: over 1054 erg.
Combined with the BATSE data and
images taken at other telescopes, including the ING, we were able to conclude
that the BATSE gamma-ray burst itself, the optical flash responsible for
the 9th magnitude, and the late-time afterglow, came from three distinct
emission regions. Figure 6 shows that the optical flash probably smoothly
connects with the late-time afterglow, which means that if OTs are caught
at an early time, they may be very bright. Observations of bright afterglows
should become possible with the launch of HETE-II, which will provide accurate
positions of the prompt X-ray burst accompanying the GRB within a minute.
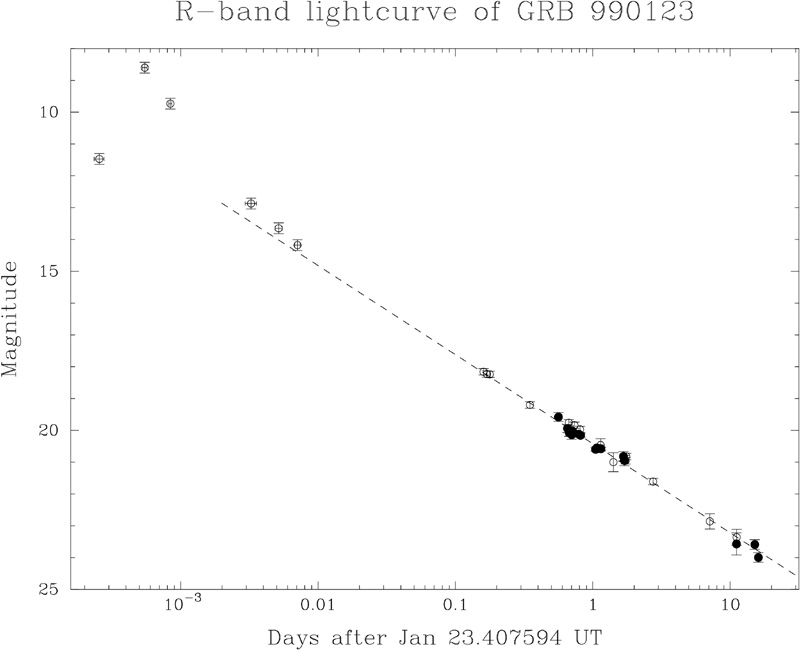 |
| Figure 6. R-band light curve of the afterglow of GRB 990123, including our WHT and INT data. The filled circles indicate results of our observations. The open circles are data taken from the literature. The dashed line indicates a power law fit to the light curve (for t>0.1days), which has exponent 1.12 ± 0.03. Also included are the ROTSE data. The power law fit is extrapolated backward (from Galama et al., 1999). [ JPEG | TIFF ] |
In the past year many bursts went off at Southern declinations. With the first unit of the Very Large Telescope in use, our team was able to determine the redshifts for three afterglows (two are actually lower limits, since only absorption features are detected and these could in principle be caused by an intervening cloud in the line of sight): GRB 990510, GRB 990712 and GRB 991216.
For GRB 990510 we also studied
the evolution of the metal absorption lines (see Figure 7). We found no
evidence for a change in the equivalent width of the MgII feature, suggesting
that the atoms responsible for the absorption are not in the immediate
vicinity of the site of the explosion (Vreeswijk et al., 1999).
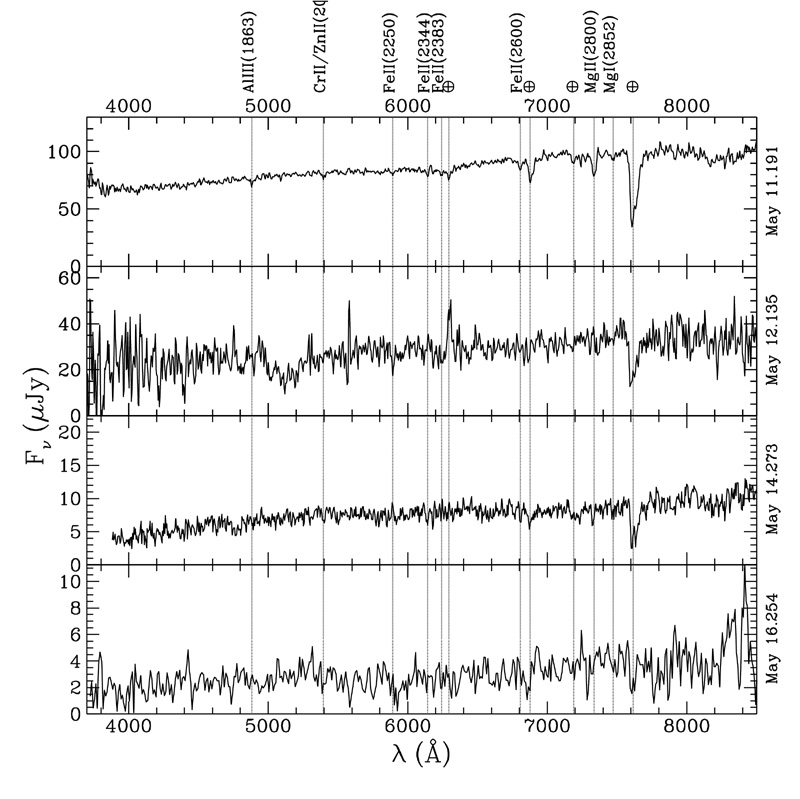 |
| Figure 7. VLT/FORS1 spectra of the afterglow of GRB 990510, from 0.8 to 5.9 days after the burst, plotted over the wavelength range 3700-9300Å. Several absorption features are indicated with the broken lines, putting the absorber redshift at z = 1.619 ± 0.02, which is most likely the host galaxy of the burst (From Vreeswijk et al., 1999). [ JPEG | TIFF ] |
The combination of their power and their large distances, makes GRBs extremely interesting as possible probes of the high redshift Universe. When we have a vast sample of redshifts available, and we find more evidence that GRBs are directly related to the formation of massive stars, they can be used to trace the star formation rate up to the very early Universe. And just like quasars, they can be used to study the chemical composition of the inter-galactic medium. In several GRB afterglow spectra, multiple absorption systems have been detected through the identification of redshifted UV metal lines. When these GRBs were caught, they were typically fainter than R=20. With the launch of HETEII (expected date of launch: 23 Jan. 2000), however, it will become possible to catch GRB afterglows when they are still very bright, at R ~1516. This is due to the fact that HETE will be able to make an accurate position available immediately (less than one minute), whereas the WFC positions of BeppoSAX typically are available after 4 hours. At that brightness, high signal-to-noise, high resolution spectroscopy will become feasible. For some bursts it may even become possible to catch them when they are brighter than R=10, but this requires an automated activation procedure of the telescopes. ESO is already investigating the possibilities of automated activation of the VLT, and hopefully other observatories will follow.
Coming from cosmological distances, GRBs have the possibility of being gravitationally lensed. Although this possibility is estimated to be less than 0.1% (Blaes & Webster, 1992), with 3 bursts per day going off over the whole sky, detecting a lensed GRB is just a matter of time. With the clear variability that GRBs display, the time lag should be easy to determine, and assuming a mass model for the lensing galaxy or cluster, one will be able to estimate the value for H0 (as has been done for several lensed variable quasars).
Following up GRB afterglows has
pushed traditional ground-based observing into a new mode of operation
of frequent and substantial overrides. Thanks to the support of the time-allocation
committees and observatory staff, and goodwill of the large majority of
observers, this has actually worked very successfully. Without the target-of-opportunity
possibility, many of the above mentioned exciting discoveries would not
have been possible. Clearly, in the longer term, a move towards queue/reactive
scheduling will benefit both GRB astronomers and the rest of the community.
References:
Email contact: Paul Vreeswijk (pmv@astro.uva.nl)
| Previous: | WHT Achieves First Direct Detection of an Extra-solar Planet | Up: | Table of Contents | Next: | The Sakurai Object: A Case Study in Advanced Stellar Evolution |
| GENERAL | SCIENCE | TELESCOPES AND INSTRUMENTATION | OTHER NEWS FROM ING | TELESCOPE TIME |