- Bacon, R., et al., 1995, A&AS, 113, 347. Citation in article | ADS
- Cretton, N., de Zeeuw, P. T., van der Marel, R. P., Rix, H-W., 1999, ApJS, 124, 383. Citation in article | ADS
- Kuntschner, H., Davies, R. L., 1998, MNRAS, 295, 29. Citation in article | ADS
- van der Marel, R. P., Cretton, N., de Zeeuw, P. T., Rix, H-W., 1998, ApJ, 493, 613. Citation in article | ADS
| THE ING NEWSLETTER | No. 2, March 2000 |
|
|
SCIENCE |
|
|
|
| Previous: | Another View of M33 | Up: | Table of Contents | Next: | First Sodium Beacon at La Palma |
Other available formats: PDF | gzipped Postscript
The One Eye that Sees All: Integral Field Spectroscopy with SAURON on the WHT
P. T. de Zeeuw1, J. R. Allington-Smith2, R. Bacon3, M. Bureau1, C. M. Carollo4, Y. Copin3, R. L. Davies2, E. Emsellem3, H. Kuntschner2, B. W. Miller5, G. Monnet6, R. F. Peletier7, E. K. Verolme1
1: Leiden
Observatory; 2: Durham University; 3: Observatoire
de Lyon; 4: Columbia University; 5: Gemini International
Project; 6: University of Nottingham; 7: European
Southern Observatory
In 1999, a new and unique integral-field spectrograph, SAURON, made its debut at the WHT. SAURON has a large field of view and high throughput, and was developed as a private instrument in a collaborative effort between groups at Observatoire de Lyon, Leiden Observatory, and the University of Durham for the systematic study of the stellar and gaseous kinematics and the line-strength distributions of nearby early-type galaxies.
Galaxy dynamics and integral-field spectroscopy
Many elliptical galaxies and spiral bulges are triaxial and/or display multiple kinematic components. Triaxiality leads to velocity structures that are difficult to map with traditional long-slit spectroscopy. Furthermore, the central few arcseconds are often 'kinematically decoupled': the inner and outer regions appear to rotate around different axes. This makes two-dimensional (integral-field) spectroscopy of stars and gas essential for determining the internal structure of these systems, and for understanding their formation and evolution.
Substantial instrumental effort has gone into high-spatial resolution spectroscopy with slits (e.g., STIS on HST), or in small areas (e.g., the integral-field units (IFUs) TIGER and OASIS on the CFHT), to study galactic nuclei. By contrast, studies of the large-scale kinematics of galaxies still make do with long-slit spectroscopy along at most a few position angles. Therefore, the galaxy dynamics groups at the Observatoire de Lyon, Leiden Observatory, and the University of Durham joined forces to build SAURON (Spectroscopic Areal Unit for Research on Optical Nebulae), an IFU optimized for studies of the kinematics of gas and stars in galaxies, with high throughput, and most importantly, with a large field of view.
SAURON
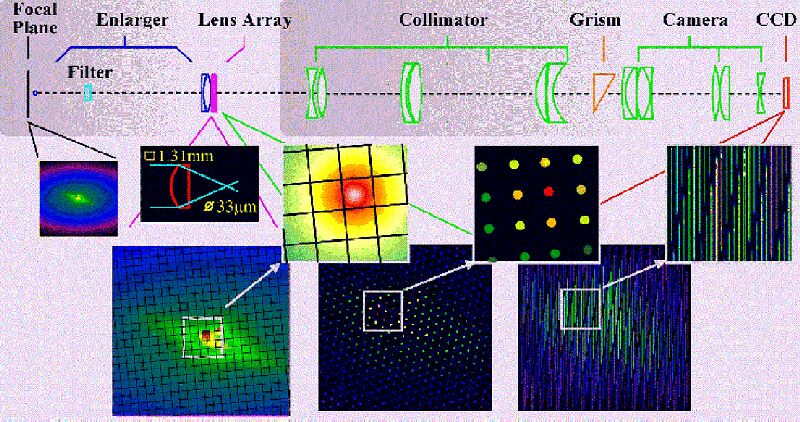
The optical layout of SAURON is
illustrated in Figure 1. A filter selects a fixed wavelength range, after
which an enlarger images the sky on the heart of the instrument, the lenslet
array (Figure 2). Each lenslet produces a micropupil. After the collimator,
the light of each micropupil is dispersed by a grism, and a camera then
images the resulting spectra onto a CCD. The CCD is rotated slightly to
avoid overlap of adjacent spectra. This design is similar to that of the
prototype IFU TIGER, which operated on the CFHT between 1987 and 1996 (Bacon
et al., 1995), and of OASIS, a common-user IFU for use with natural
guide star adaptive optics at the CFHT. Table 1 summarizes the basic specifications
of SAURON.
 |
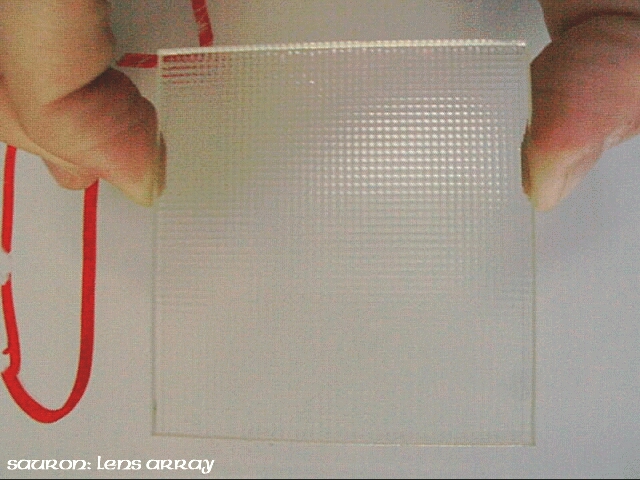 |
| Figure 1 (left). Optical layout of SAURON [ JPEG | TIFF ]. Figure 2 (right). The SAURON lenslet array is made of fused silica, and consists of over 1600 square lenslets, each 1.35 mm on the side [ JPEG | TIFF ]. | |
| Spatial sampling | 0.26" | 0.94" |
| Field of view | 9" × 11" | 33" × 41" |
| Spectral resolution (FWHM) | 2.8 Å | 3.6 Å |
| Instrumental dispersion (sigma) | 70 km/s | 90 km/s |
| Grism | 514 lines/mm | |
| Spectral sampling | 0.9 Å/pix | 1.1 Å/pix |
| Wavelength coverage | 48105400 Å | |
| Calibration lamps | Ne,Ar,W | |
| Detector | EEV12 2148 × 4200 | |
| Pixel size | 13.5 µm | |
| Efficiency (optics/total) | ~35%/14% | |
The SAURON optics are optimized for the wavelength range 45007000Å. Currently only one filter and one grism are available, for the range 48105400Å. This allows simultaneous observation of the OIII and H-beta emission lines to probe the gas kinematics, and a number of absorption features (the Mg b band, various Fe lines and again H-beta) for measurements of the stellar kinematics (mean velocity, velocity dispersion, and the full line-of-sight velocity distribution), and the line strengths (age, metallicity, and abundance ratios).
A new feature of SAURON compared to existing IFUs is the ability to do simultaneous sky subtraction. This is achieved by means of an extra enlarger which observes a patch of sky 1.7 arcmin away from the main field, using about 100 lenslets.
Each of the lenslets normally images 0.94 × 0.94 arcsec on the sky. This undersamples the typical seeing at La Palma, but provides essentially all one can extract from the integrated light of a galaxy over a remarkably large field of view, 33 × 41 arcsec, observed with a filling factor of 100% (1500 lenslets). SAURON therefore does justice to its name, as its mythical predecessor was also known as 'The one eye that sees all'.
SAURON contains a mechanism for switching to another enlarger, resulting in a 9 × 11 arcsec field of view, sampled at 0.26 × 0.26 arcsec. This mode can be used in excellent seeing to study galactic nuclei with the highest spatial resolution achievable at La Palma without adaptive optics.
The total throughput of SAURON, including atmosphere, WHT and detector, is 14%.
The mechanical design of SAURON
is similar to that of OASIS; it is light and strong, and minimizes flexure.
Figure 3 shows the instrument mounted on the Cassegrain port of the WHT.
SAURON weighs less than 300 kg, as compared to about 1500 kg for ISIS,
which normally occupies this port. In order not to have to rebalance the
WHT when SAURON is mounted, four counterweights totalling 580 kg are bolted
on with the instrument: these are visible as a steel ring surrounding the
top of SAURON. The dewar, made available by the ING, can be seen at the
very bottom of the photograph.
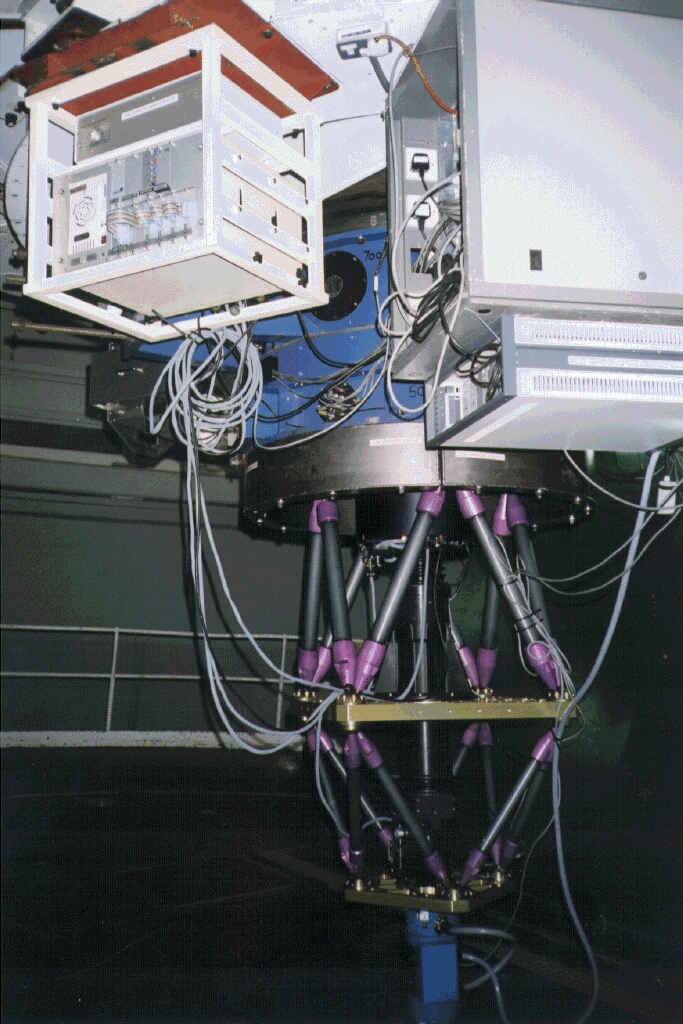 |
| Figure 3. SAURON mounted on the Cassegrain port of the WHT [ JPEG | TIFF ]. |
The plan to develop SAURON was hatched in the summer of 1995, and the first work started in late spring 1996. The instrument was completed in January 1999. This fast schedule was possible because SAURON is a special-purpose instrument with few modes, and because much use could be made of the expertise developed at Observatoire de Lyon through the building of TIGER and OASIS. While SAURON was constructed as a private instrument, plans are being developed to make it accessible to a wider community.
Commissioning the Eye
SAURON was commissioned on the WHT in early February of 1999, during time shared with the ESA STJ team (see ING Newsletter, 1, 13). In the preceding days, the instrument was checked, together with the software to run it, and the interface to the WHT environment. We paid particular attention to the optical alignment of SAURON and the detector, to be sure that the spectra were aligned accurately with the columns of the CCD.
The instrument performed very well from the moment of first light, on February 1. We modified an internal baffle slightly, to avoid some residual light leak between the main field and the sky part. A small tilt of the filter removed an unwanted ghost image. The slow read-out of the CCD led to some inefficiencies, but this is being fixed by the ING.
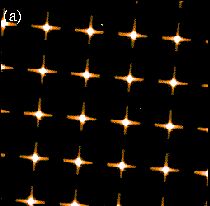
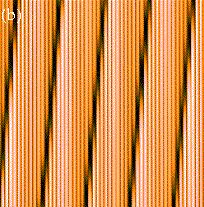
Figure 4 presents some calibration
data taken during commissioning. Panel a) shows a small part of an exposure
with the grism taken out, which produces an image of the micropupils. Panels
b) and c) show spectra obtained with the internal tungsten and neon lamps,
respectively. The former shows the nicely aligned continuum spectra, while
the latter shows the emission lines used for wavelength calibration.
 |
 |
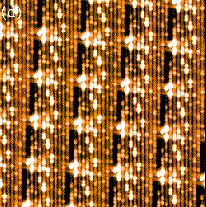 |
| Figure 4. Examples of various SAURON calibration measurements, taken during commissioning. Each panel shows only a small part of the entire CCD frame so that details can be seen. a) Micropupil image taken with the grism out. Each dot is the diffraction pattern from one square lenslet [ TIFF ]. b) Continuum image using the tungsten lamp [ TIFF ]. c) Neon arc [ TIFF ]. | ||
Data Analysis
Each SAURON exposure produces a CCD frame containing about 1600 individual spectra. These are extracted by means of an optimal algorithm based on a full optical model of the instrument. The resulting data cube is reduced in the standard manner, archived, and analysed by means of a set of programs modelled on the XOASIS package.
We have developed a special pipeline, fittingly called Palantir, to analyse the SAURON data cubes in a very systematic manner. The first module of Palantir removes the instrumental signature, the cosmic rays, and also does the wavelength and flux calibration and the sky subtraction. The second module allows merging of individual exposures and mosaicing of different pointings for the same object. Measurement of the kinematic quantities and the line strengths is then done with dedicated algorithms. The reduced data is archived at Leiden Observatory, and will be made public in due course.
First Results
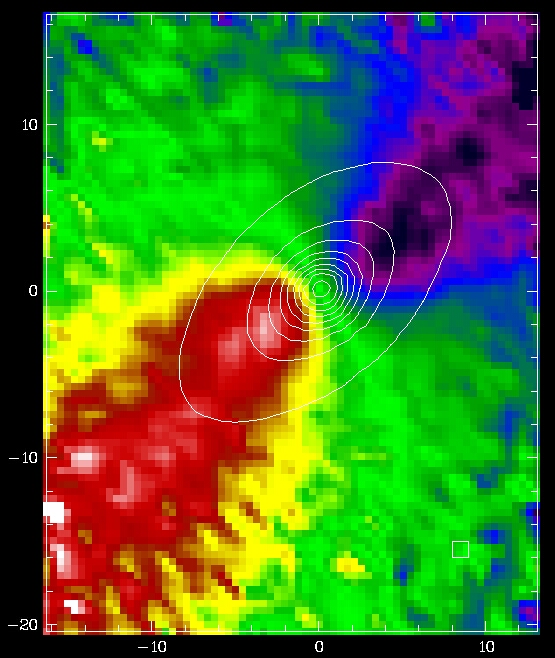
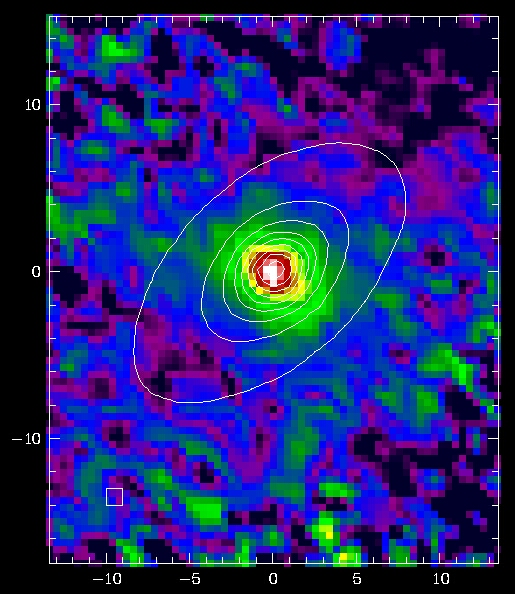
Figure 5 shows results from the
first SAURON observing run (February 1420, 1999). Reconstructed total
intensity, stellar Mg b line strength, mean velocity and velocity dispersion,
and emission-line gas intensity and velocity maps are presented for the
E6 galaxy NGC 3377. The stars show a striking rotating disk pattern with
a spin axis misaligned ~10º from the photometric minor axis.
The Mg b isophotes seem to follow the continuum light. A comparison with
the H-beta isophotes will reveal whether this galaxy contains a younger
stellar disk. The gas also reveals non-axisymmetric structures and motions.
These results are based on a total of only four 30 min exposures (no spatial
binning was applied). The large angular extent of the maps should be noted.
 |
 |
 |
 |
 |
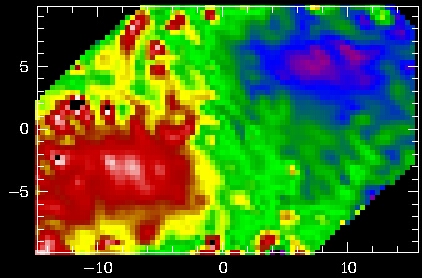 |
| Figure 5. SAURON measurements of the E6 galaxy NGC 3377. Each pixel is 0.94" × 0.94" and the FOV shown is 30"× 39". a) Reconstructed total intensity [ JPEG | TIFF ]. b) Stellar Mg b index [ JPEG | TIFF ]. c) Stellar mean velocity [ JPEG | TIFF ]. d) Stellar velocity dispersion [ JPEG | TIFF ]. e) Gas total intensity ([OIII] 5007Å) [ JPEG | TIFF ]. f) Gas mean velocity [ JPEG | TIFF ]. | ||
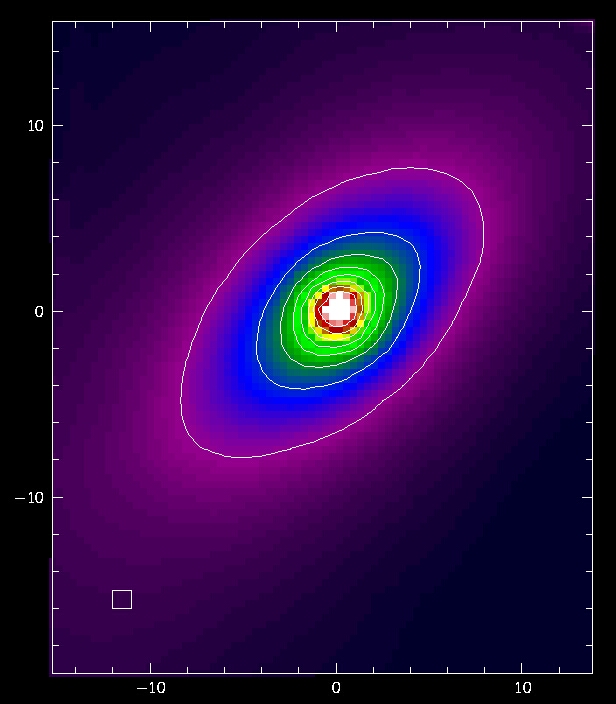
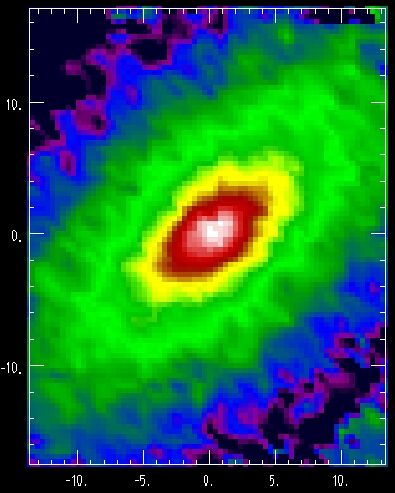
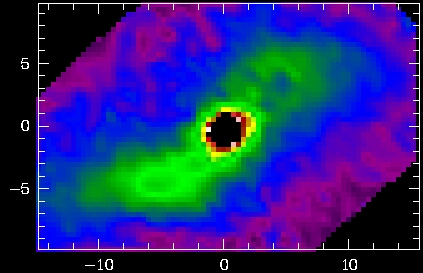
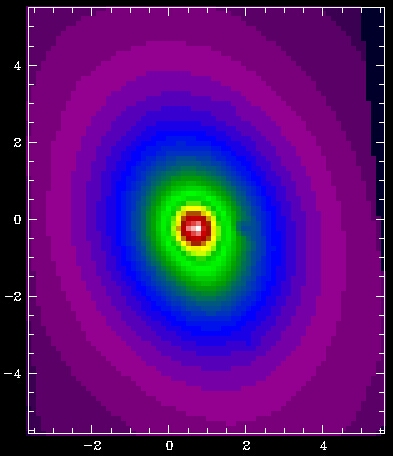
During our run in October 1999, we observed the E3 galaxy M32 to test the high-resolution mode. Figure 6 shows the integrated intensity and the mean velocity field of the central region of M32, derived from a single 45 min exposure with good seeing. The velocity field is very regular, is consistent with axisymmetry, and has a peak amplitude of about 50km/s. Individual velocity measurements are accurate to a few km/s. The velocity dispersion in M32 is significantly smaller than the SAURON instrumental dispersion, except in the inner few arcseconds (e.g., van der Marel et al., 1998), and we do not show this here.
Figures 5 and 6 also illustrate
a key advantage of integral-field spectroscopy over traditional aperture
and long-slit spectroscopy: by integrating the flux in each spectrum, the
surface brightness distribution of the galaxy is recovered. As this is
derived from the same spectra that are used to obtain the kinematics and
line strengths, there is never any doubt about the relative location of
these measurements and the galaxy morphology.
 |
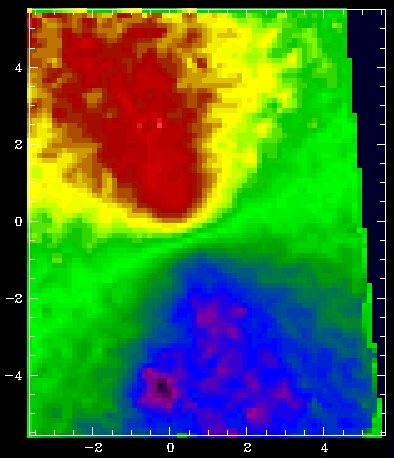 |
| Figure 6. SAURON measurements of M32. a) Reconstructed total intensity [ JPEG | TIFF ]. b) Stellar mean velocity. The FOV is 9"× 11", and the spatial sampling is 0.26" × 0.26" [ JPEG | TIFF ]. | |
The SAURON project: structure of E/S0/Sa Galaxies
We built SAURON to measure the intrinsic shapes and internal velocity and metallicity distributions of early-type galaxies, and to gain insight into the relation between the stellar and gaseous kinematics and the stellar populations in spheroids. Our strategy is to study a representative sample of nearby ellipticals, lenticulars, and early-type spiral bulges. The SAURON data are combined with high spatial resolution spectra of the nuclei, and interpreted through state-of-the-art dynamical and stellar population modelling.
Our sample was constructed as
follows. We first compiled a complete list of accessible E/S0 galaxies
and Sa bulges for which SAURON can measure the stellar kinematics: 6º
<= delta <= 64º (zenith distance), cz < 3000 kms-1
(spectral coverage), sigma > 90 kms-1 (spectral resolution).
The objects span a factor 50 in luminosity (MB < 18) and
cover the full range of environment, nuclear cusp slope, rotational support,
and apparent flattening. The galaxies were then divided into six categories
(E/S0/Sa; field/cluster) and a representative sample of 72 objects was
selected to populate the ellipticity versus absolute magnitude planes homogeneously
(Figure 7). Based on our two observing runs in 1999, we hope to complete
the observations of the entire sample by early 2002.
 |
| Figure 7. Distribution of E, S0, and Sa galaxies in the SAURON sample in the plane of ellipticity epsilon versus absolute blue magnitude MB. Open circles: field galaxies. Solid circles: cluster galaxies [ GIF | TIFF ]. |
The detailed measurements will be compared with fully general galaxy models constructed by means of Schwarzschild's numerical orbit superposition technique (e.g., Cretton et al., 1999). The dynamical modelling uses all appropriate imaging and spectral data that are available, including HST and OASIS spectra to constrain the mass of a central black hole. When combined with the constraints on the stellar populations derived from the line-strength distributions (Kuntschner & Davies, 1998), this will shed new light on the fundamental connections between the large and small scale dynamics, the formation (and existence) of supermassive black holes and galactic nuclei, and the history of metal enrichment in early-type galaxies.
It is a pleasure to thank René Rutten, the ING staff, in particular Tom Gregory, and Didier Boudon and Rene Godon for enthusiastic and competent support on La Palma. The SAURON project is made possible through financial contributions from NWO, the Institut National des Sciences de l'Univers, the Université Claude Bernard Lyon I, the universities of Durham and Leiden, and PPARC.
References:
Email contact: Tim de Zeeuw (tim@strw.leidenuniv.nl)
| Previous: | Another View of M33 | Up: | Table of Contents | Next: | First Sodium Beacon at La Palma |
| GENERAL | SCIENCE | TELESCOPES AND INSTRUMENTATION | OTHER NEWS FROM ING | TELESCOPE TIME |