
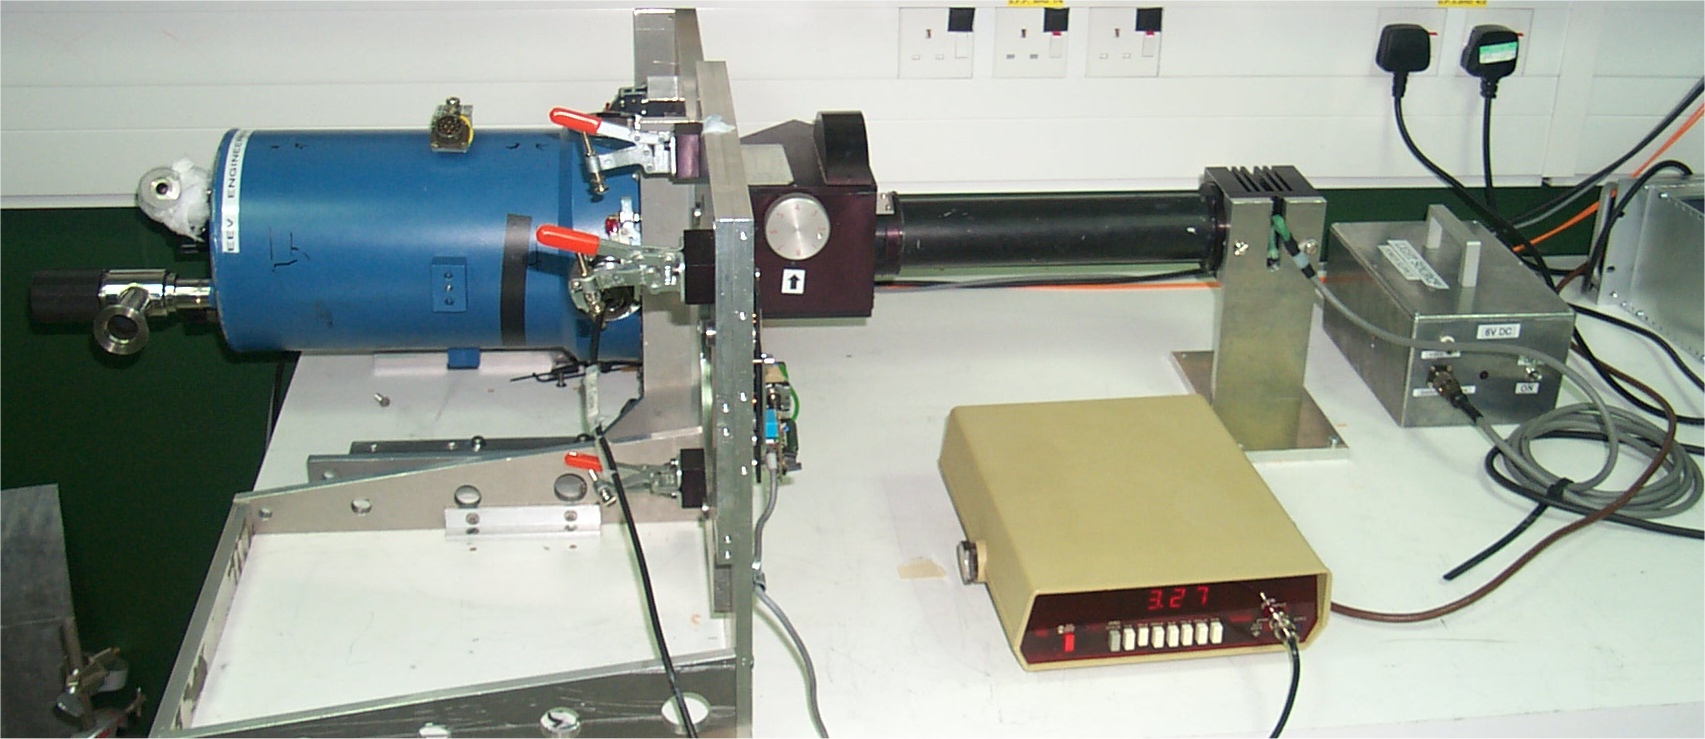
Quantum Efficiency Measurement Rig
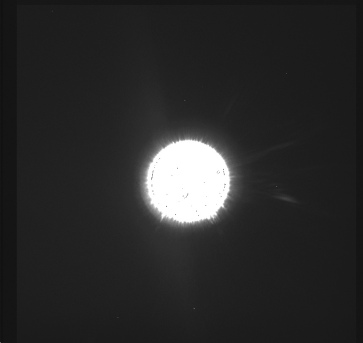
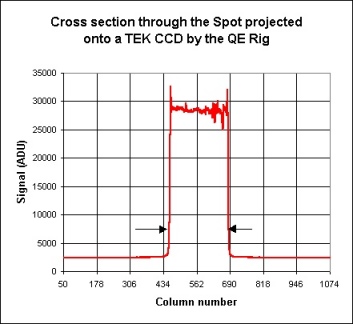
The light source is a 6V tungsten halogen lamp. A filter wheel containing 8 filters is positioned between lamp and CCD. Two 5mm apertures, one close to the lamp, the other close to the CCD serve to collimate the beam. A pencil beam of light exits the equipment with a low divergence angle. At the CCD the beam has a diameter of about 5.5mm, 150mm further downstream the diameter has only risen to 7mm. The outer regions or 'wings' of the beam contain almost no signal.
 |
 |
|
|
|
The measurement technique consists of first measuring the spot brightness using a large area calibrated photodiode connected to a pico-ammeter, at each filter position. The diode is then dismounted and a CCD camera placed in the same position. A further series of brightness measurements is then done with the CCD. Surprisingly almost all CCDs can be configured as a photodiode by attaching a pico-ammeter between the substrate and the RD pin (although with the EEV chips the DD connection must be used). The QE measured in this mode has been shown to be the same as that measured by more complex methods involving imaging and readout (The ATC Quantum Efficiency Measurement System,). To calculate the CCD QE, the ratio of CCD current to photodiode current is taken and multiplied by the photodiode QE. An EXCEL spreadsheet is included here to help with this calculation (Download spreadsheet). The photodiode QE values included in this spreadsheet were calibrated in 1998. Two cables are also included with the rig to allow connection of the SITe/MIT/TEK and EEV CCDs to the pico-ammeter. These are normally kept in the bottom draw below the QE rig in the darkroom.
Precautions
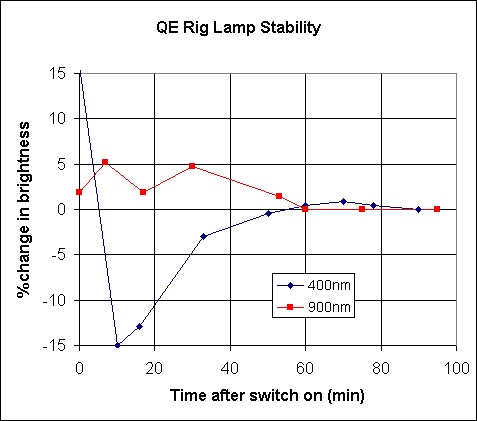
1.The lamp takes some time to warm up and stabilise. It is recommended that the lamp is left on for at least an hour before commencing measurements. The graph below shows lamp stability after power-on at two colours:
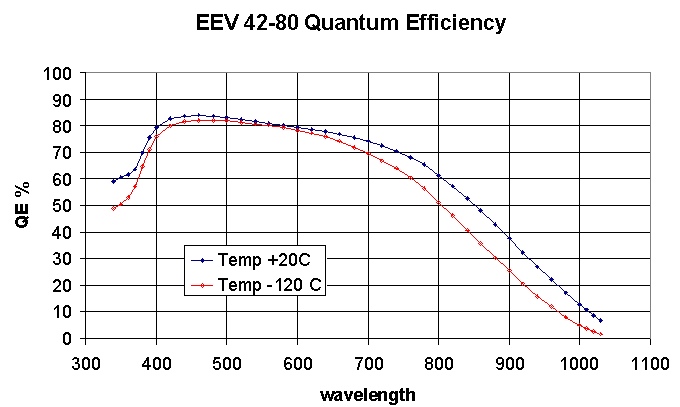
2.The QE of a CCD is strongly dependant on temperature, particularly in the red part of the spectrum. It is important to measure the CCD QE at its operational temperature. This graph shows the temperature dependence of QE for EEV12.
3. Extraneous light will certainly disturb measurements. Ensure the darkroom is in full darkness.
4. Wait until the CCD signal stabilises. This may take some seconds with the EEVs. The cable connecting CCD to pico-ammeter can generate a lot of noise if it is allowed to swing or vibrate.
5. At the end of the measurement run, switch off the lamp and measure the CCD dark current. This signal should be subtracted from all the CCD data prior to calculating QE.
6. The lamp output at 350nm is extremely low, the pico-ammeter currents will thus be very low also. The EEV dark current is quite noisy (approx 60pA with a noise component of +/-10pA) and may be a significant fraction of the photo-induced signal. The calculated QE at this wavelength may have a large error.
 |
 |
 |
 |
|
|
|
|
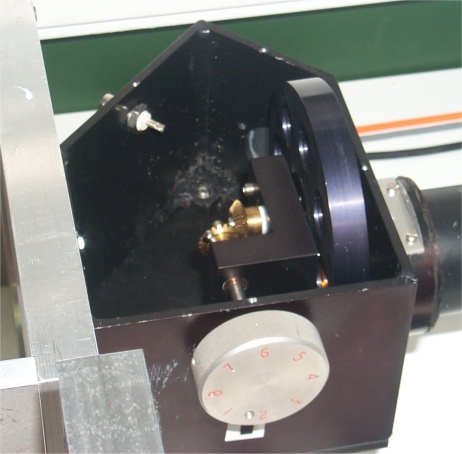
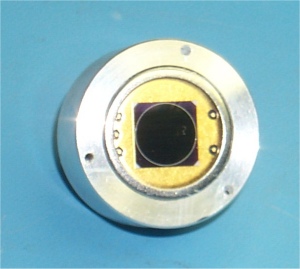
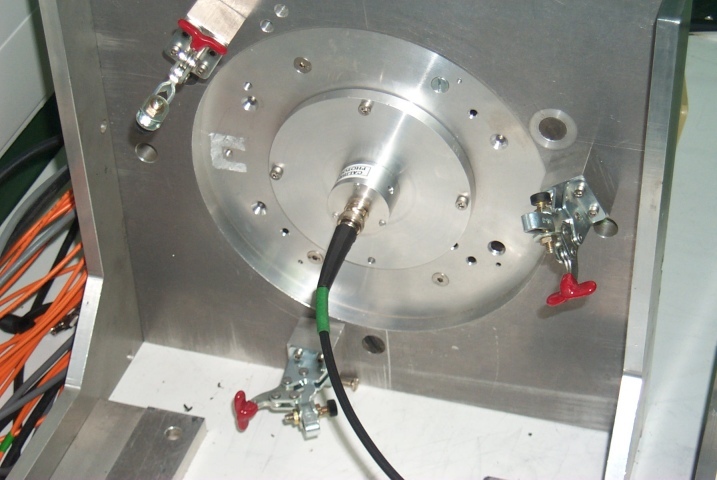
Photodiode mounted on test rig |
Potential errors with this system are :
-Scattered light getting around the side of the filters and reaching the CCD/Photodiode.
-Some light missing the photodiode.
-Non-repeatability in filter positioning.
-Calibration drift of the photodiode.
Scattered light was not a problem either. A piece of black card was placed downstream and very close to the filter wheel. The light exiting the rig aperture was un-measurably small.
The photodiode intercepted all of the light exiting the system. The beam profile was checked with a CCD image and shown to be smaller than the photodiode area by a large margin.
The filter wheel positional repeatability could cause problems if there were small variations in filter transmission across the filter aperture. This was tested by making 4 rotations of the filter and measuring the photodiode current at each position. Filter #6 was repeatable to about 2%, all the others were repeatable to 0.5%.
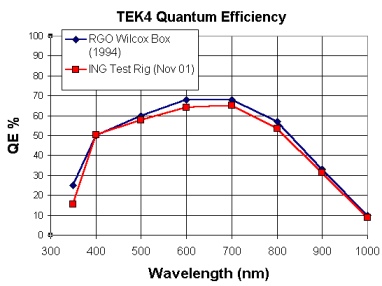
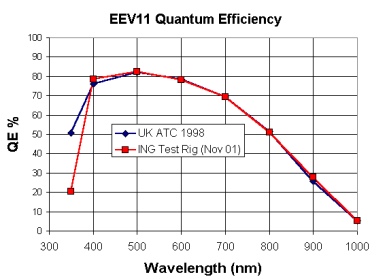
The Photodiode was calibrated at the ATC in 1998. Ideally it should be re-calibrated at the National Physical Laboratory as its sensitivity may have drifted. As a confidence check, the QE of two of our CCDs were compared with measurements made at the ATC and RGO, and were found to be quite similar, indicating that calibration drift was probably not a problem.
Sample Data
 |
 |
|
|
(most data points coincident) |
Estimated Errors
At 350nm, the errors are very large due to the low intensity of the source at this wavelength. In fact it is recommended that the results at 350nm should be ignored. At the other wavelengths, the ultimate accuracy depends on the calibration accuracy of the photodiode. When compared with the QE data for an EEV-4280 obtained at ATC, the similarity of the data is striking, deviating by at most by 2.6% (except for the 350nm result) and in most cases deviating by less than 1%.
The calibration photodiode was initially calibrated at the ATC using another diode that was characterised by the National Physical Laboratory. The estimated accuracy of the NPL measurements was +/- 0.4%.
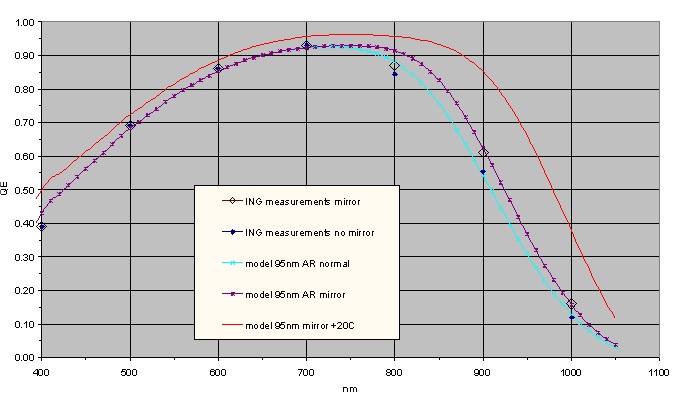
The graph below produced by Paul Jordan of Marconi shows
a comparison of the theoretical QE model for the Marconi1
Deep Depletion low fringeing CCD (not available) with data obtained on
the ING QE rig. The results are very close and are a good indication of
the system's accuracy.