Viewing Breakpoints in the Breakpoints Window
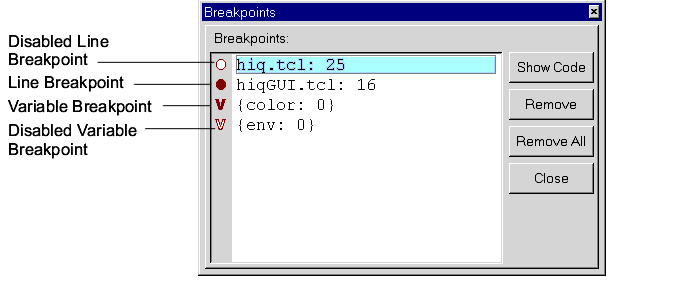
To display the Breakpoints window, click the "B" in the tool bar or by select View | Breakpoints from the menubar. The Breakpoints window displays line-based and variable breakpoints, as shown in Figure 13.
Figure 13 The Breakpoints Window

The line-based breakpoints in Figure 13 indicate the file and line number where the breakpoint has been set. To select a breakpoint, click the line to the right of the breakpoint in the Breakpoint window to highlight it. You can delete, disable, and enable breakpoints:
- To delete a breakpoint, select the line in the Breakpoint window and click the Remove button.
- To disable a breakpoint, click the breakpoint in the Breakpoint window.
- The disabled breakpoint is shown as a hollow stop sign for a line-based breakpoint or hollow "V" for a variable-based breakpoint.
- To enable a disabled breakpoint, click it in the Breakpoint window.
- Disabling and enabling breakpoints can be helpful when you want to keep all of your breakpoints but may not want to use all of them at the same time.
Note: You can select multiple breakpoints to be disabled or enabled by clicking the breakpoints while pressing the <Ctrl> key.
You can perform the following actions on a selected breakpoint:
- Click the Show Code button to show the code at a Line-based breakpoint.
- Clicking this button causes TclPro Debugger to display the code containing the corresponding line in the Code display.
- Click the Remove button to remove a selected breakpoint.
You can click the Remove All button to remove all of the breakpoints.
The information for a variable breakpoint in the Breakpoint window, as shown in Figure 13, appears in the form of two sets. The first set contains the variable name followed by the absolute stack level at which the variable breakpoint was created. The second set contains information regarding the most recent occasion in which the variable breakpoint was triggered. If the second set is empty, the variable breakpoint has never been triggered. Otherwise, the second set contains the name and stack level of the variable that triggered the variable breakpoint. In most cases, the second set will not differ from the first set. However, when a variable is aliased by the global and upvar commands, any instance of that variable can trigger the variable breakpoint. The second set is helpful when you have an aliasing bug in your code.
The following is an example of an aliased variable a whose variable breakpoint gets triggered by a variable named x:
1 proc foo {} {
2 upvar #0 a x
3 set x 52
4 }
5 set a 50
6 puts "global var a is set"
7 set a 51
8 foo
If you stop this application on line 6, you can create a variable breakpoint for the global variable a. If you open the Breakpoint window, you will see the following:
{a: 0} {: }
If you continue to run the application, the variable breakpoint is triggered on line 7, the following appears in the Breakpoint window:
{a: 0} {a: 0}
If you continue to run the application again, the variable breakpoint is triggered once more on line 3, the following appears in the Breakpoint window:
{a: 0} {x: 1}
|
http://www.ajubasolutions.com Voice: (650) 210-0100 Fax: (650) 210-0101 support@ajubasolutions.com |