An important thing to be aware of is array saturation. With WHIRCAM, saturation is defined by the full well capacity of the pixels, NOT by the dynamic range of the A-D converter (65,535 DN). The full well capacity is controlled by the substrate voltage (called the bias voltage), but as this also affects the number of hot pixels, a larger well capacity is paid for by a larger number of hot pixels. The default voltage setting (0.68 V) provides a reasonable well depth and a bearable number of hot pixels. If fewer hot pixels are required, then you can select a lower bias voltage by selecting Imaging, set_ALICE, recall_setup, then change recall_input to FPA40348_SHALLOW, followed by select_enable = YES. This will change the bias voltage to 0.60 V. The default is FPA40348_DEEP, with a bias voltage of 0.68 V.
To make life interesting, the well depths, and hence saturation, vary across the chip, and vary with wavelength. And because of the non-linearity above 80% of full well capacity, the effective saturation level is even lower. In the following, all saturation figures are defined as 80% of full well capacity.
For ND_STARE mode with a bias of 0.68 V, the minimum saturation in Ks is 9,500 DN
(along the lower edge of the chip), and the minimum saturation within the
central ![]() pixels is 12,000 DN. There is also an odd/even column effect,
giving rise to two peaks in the saturation levels, at 13,500 and 17,500 DN.
At J, these figures tend to increase, with the minimum saturation being
11,000 DN, the minimum within the central
pixels is 12,000 DN. There is also an odd/even column effect,
giving rise to two peaks in the saturation levels, at 13,500 and 17,500 DN.
At J, these figures tend to increase, with the minimum saturation being
11,000 DN, the minimum within the central ![]() being 14,000 DN, and the
two odd/even column peaks being at 15,500 and 17,500 DN. Figure 5,
plots the non-linearity for the even and odd columns, but shows simply the
means of these columns. Users should be very careful to estimate
exposure times such that the maximum counts will not saturate on the chip
in the area of interest. As most observations will be taken as combinations
of dithers, then the best practice would be to aim to have final counts
always below 10,000 DN in ND_STARE. For STARE mode, the fixed pattern
noise, dominated by the reset values, has a range of 20,500 to 28,000 DN,
making a comparison with ND_STARE difficult. With a bias of 0.68 V and a
Ks filter, STARE mode has a minimum 80% full well saturation above
reset level (ie 100% of reset level plus 80% from there to saturation)
is
being 14,000 DN, and the
two odd/even column peaks being at 15,500 and 17,500 DN. Figure 5,
plots the non-linearity for the even and odd columns, but shows simply the
means of these columns. Users should be very careful to estimate
exposure times such that the maximum counts will not saturate on the chip
in the area of interest. As most observations will be taken as combinations
of dithers, then the best practice would be to aim to have final counts
always below 10,000 DN in ND_STARE. For STARE mode, the fixed pattern
noise, dominated by the reset values, has a range of 20,500 to 28,000 DN,
making a comparison with ND_STARE difficult. With a bias of 0.68 V and a
Ks filter, STARE mode has a minimum 80% full well saturation above
reset level (ie 100% of reset level plus 80% from there to saturation)
is ![]() 37,500 DN, with less well-resolved peaks at
38,000 DN and 40,000 DN.
37,500 DN, with less well-resolved peaks at
38,000 DN and 40,000 DN.
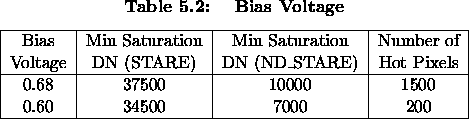
The approximate 80% well depths and number of hot pixels for each Bias voltage are given in Table 5.2.
A problem with this array is that the odd columns tend to have a lower well depth than the even columns. So that both sets of columns will have 80% saturation at similar DN values, the reset level has been set up such that it is higher for the odd columns (see Figure 5).
In the thermal near-IR (3-5 ![]() m), the background level is always high
and dominates any astronomical signal. Short on-chip integrations are
always required.
m), the background level is always high
and dominates any astronomical signal. Short on-chip integrations are
always required.
Although the detector is a direct readout device with 4 readouts which each address every fourth column, the minimum exposure time for full frame readout is 120 ms, limited by the multiplexer performance, and it is this minimum exposure time and finite well depth that defines lower magnitude limits below which stars will saturate the chip. Table 5.2 gives the minimum magnitudes of stars which will saturate at this minimum exposure time (in 0.5'' seeing and a scale of 0.24''/pix):
Faster exposures can be made (of brighter stars) if subarrays are employed.