IDS REDPLUS2 Commissioning Report
Final Report (Mon 28 Nov 2011)
Completed by Ovidiu Vaduvescu and Andy Ridings (Jan-Oct 2011)
Based on a template provided Andy Ridings and Steve Smartt (Feb 2000)
Master document available here:
/data/docs/Astronomy/instruments/ids/IDS-REDPLUS2/IDS-REDPLUS2-REPORT/IDS-REDPLUS2-COMMISSIONING-REPORT.htm
accessible via
http://www.ing.iac.es/astronomy/instruments/ids/IDS-REDPLUS2/IDS-REDPLUS2-REPORT/IDS-REDPLUS2-COMMISSIONING-REPORT.htm
data folders (raw and reduced FITs) in /data/ovidiuv/IDS/ folder
1 Introduction
1.0 Status
The report is complete. Automatic QC to be commissioned.
1.1 Purpose
This document describes the ING test requirements for the commissioning and acceptance of all new CCDs. As the generic test plan, some tests may not be relevant to a new detector on a particular telescope or focal station. This may be noted in any such test.
1.2 Scope
The tests can be divided into two broad categories:
1. Functional tests - designed to verify and validate the functional behaviour of the CCD within the Data Acquisition System.
2. Acceptance tests - tests designed to verify that the package is acceptable to the ING commissioning astronomer.
The functional and acceptance test will be carried out at the direction of the ING commissioning astronomer, although it is not expected that they will themselves carry out all the tests.
The test results will be fully documented, both in the condensed form of the CCD characteristics data sheet, and in the full form of the completed test plan to be held by the detector group.
Both the functional tests and the acceptance tests might be applicable to
the testing of any subsequent modifications to the CCD and it's software -
when only the relevant sections need to be carried out.
1.3 References
1. TEK4 Commissioning tests, RGMR.
2. TEK on INT/JKT - Testing, and Acceptance, PMF.
3. CCD Commissioning, DRM.
1.4 Overview
In the following sections the functional and acceptance tests are described in detail. Please see the above links (under the title) where the master document, figures, plots and all FITS data reside.
When carrying out the tests in the following, sections, the run numbers of
any frames (and dates) evaluated should be recorded for future reference in
the ING archive and printouts of relevant images stored with the commissioning
file.
2 Functional Tests
2.1 Mechanical arrangement
MechU001 The cryostat should accept filler tubes of different lengths
and be filled with liquid nitrogen and cooled.
| Notes: The cryostat will accept both a half length and full length
tube and will correctly seal with a teflon washer.
|
MechU002 LN2 filler tube location should allow LN2 to remain in the
cryostat at all telescope positions. Put appropriate filler tube in and attach
CCD to its nominal focus on the telescope.
| Notes: With the cryostat mounted on IDS with a half length filler tube the cryostat hold time is >14 hours during normal telescope perations. |
MechU003 The filler tube length needed for each of the various instruments
that the device will be used on, should be recorded here.
| Instrument | Tube Length |
| IDS | Half length |
| . | . |
| Notes: Tube fits correctly
|
MechU004 Capstans should have clamps on and with these clamps tight,
the capstans should have no movement - both rotationally, and in slop.
| Notes: There is the tiniest of slop on capstan C but this does not
cause cryostat movement. |
MechU005 Establish the position of the CCD surface relative to the
window front face. and relative to the cryostat (metal) front face, and record
them here.
| Notes: 11 mm measured optically
|
MechU006 The cryostat should physically fit all the instruments it
could ever be used with. Note down here the instruments that have been tested.
| Instrument | Tested |
| IDS | ok |
| Notes: The cryostat physically fits, there are no cabling issues and all micrometers can be read. |
MechU007 The flatness of the chip itself should be known. This should
have been measured before delivery to ING. Check that there is no gross curvature
across the chip by either FWHM measurements of stellar profiles ( if chip
is to be used for imaging ) or through Hartmann shifts (or FWHM estimates
of arc lines if chip is to be primarily used for spectroscopy) Note down the
method used and the approximate shape of any curvature.
| Notes: This is a metal buttable device with a peak to valley of 20um
as measured by E2V. |
MechU008 Flexure of the CCD relative to the sky should be noted for
the most common focus for the detector. A full flexure test is not necessary
for full commissioning, but the flexure between zenith and ~60 degrees from
zenith should be noted and compared with what is expected. Advice from the
appropriate instrument specialist can be sought.
| Notes:
Five arc images were taken (by Amy Tyndall on 14 Apr 2010) with same settings
(low resolution gratings R300V) and telescope pointing 90 deg, 70, 50, 30 and
about 15 deg in altitude (starting from the Zenith and lowering only the DEC,
telescope no tracking). Same three arc lines were measured in all images. |
MechU009 It should not be possible for the radiation shield inside
the cryostat to impinge on the light path, for any, of the likely foci that
the detector may be used. Indicate here that this has been checked and is
acceptable.
| Notes: The cryostat window is very close to vignetting the corners
of the device. This is however well outside the window used on IDS.
|
2.2 CCD performance
PerfU001 The number of the controller used for the performance tests
should be noted.
| Notes: The controller number is 20. |
PerfU002 The .lod file used for this detector should be recorded here.
| Notes: home/dspdev/ccd/timIII/RED+2/timGen3.RED+2.2010-11-16.lod |
PerfU003 The DAS system should be able to start up and prepare for
reading out the CCD. Start up the instrument control system, with the detector
under test in use note down any errors or warnings.
| Notes: The system starts correctly. |
PerfU004 The bias readout time is needed for each readout speed.
'Using "BIAS" until the prompt returns, or until the system indicates that
the run has completed. Leave blank any unsupported readout speeds. Note
which DAS system was in use for this test.
| |
Bias readout time (secs) |
| slow | bin 1x1: 12s bin 1x2: 6s bin 2x1: 12s bin 2x2: 7s bin 3x3: 4s |
| fast | bin 1x1: 9s bin 1x2: 5s bin 2x1: 10s bin 2x2: 6s bin 3x3: 4s |
| Notes: I used the IDS default window 1 "[755:1119,1:4200]". Run (image numbers) used to read time from header (UTOBS) and measure readout time: r782400-420 (bias 1x1 slow); ..463-480 (bias 1x1 fast) |
PerfU005 The bias, level and readout noise in ADUs should be measured.
with all lights off and curtain shut - preferably at night - take 2 bias
frames at all available readout speeds. Using ING analysis scripts or any
other means measure the bias level and readout noise in ADU. Note these
down for all supported speeds. Keep the runs used.
| |
Binning | Bias Level | STDDEV (ADU) | Readout noise (e) |
| slow | bin 1x1 bin 2x2 bin 3x3 bin 1x2 bin 2x1 |
3720 3659 3657 3695 3650 |
5.5 5.4 98 4.7 5.4 |
5.0 5.0 89 4.3 4.9 |
| fast | bin 1x1 bin 2x2 bin 3x3 bin 1x2 bin 2x1 |
2991 2965 2963 2978 2961 |
5.2 2.9 79 4.6 3.8 |
9.6 5.4 146 8.4 7.0 |
| Notes: Files used to read time from header (UTOBS) and measure readout time: same as in PerfU004. Readout noise (e) calculated by multiplying STDDEV (ADU) by the gain (0.91 for slow and 1.84 e/ADU for fast, acc to RED+2 tech specs). Task bias_ron from ing iraf package did not work and needs time to update to make it work, so I used imstat *.fit[1] instead. Data in /data/ovidiuv/IDS/Bias folder. |
PerfU006 Gain should be measured using the ING analysis scripts
(or the IRAF script ccd_gain). Note down the gain and the electron readout
noise at all supported readout speeds. Write down the archived run numbers if applicable.
| |
|
|
|
| slow | bin 1x1 bin 1x2 bin 2x1 bin 2x2 |
0.95 0.95 0.95 0.94 |
2.67 2.64 2.74 2.76 |
| fast | bin 1x1 bin 1x2 bin 2x1 bin 2x2 |
1.93 1.92 1.91 1.90 |
3.84 3.83 3.91 3.64 |
| Notes:
I used FINDGAIN task in IRAF to measure gain and noise, using two
pairs of flats and biases for each setting. Found values are closed
to CCD tech specs (0.91 for slow and 1.84 for fast). Files used
for analyse: r785935-..-r785968.fit. Some master flat images in
REDPLUS2-FLAT folder. Data in
/data/ovidiuv/IDS/PerfU006/ccd_gain">PerfU006/ccd_gain folder. |
PerfU007 Bias structure needs to be checked. This is most clear
on a MULTBIAS 10 or on 10 bias frames combined. This should be done at night
to reduce the effect of light leakage. If it is not done at night ensure
that any structure is not a light leak. It should be done for each speed
at which it will be used in science mode (ie standard, quick and turbo)
note down run numbers and dates.
| Notes:
No major patterns seen in any combined master bias or individual
biases. Some darker region columns at left-side (~20 pix) and some
brighter lines at bottom-side (~10 pix) visible for most settings.
Darker columns range from 3710 ADU (leftmost column)
to 3720 (average value of the bias, some 0.25% darker). Brighter
lines are about 3730 ADU (some 0.25% brighter than the rest of the
bias). Saved master bias images, column and line cuts in jpg shots
in REDPLUS2-MASTERBIAS-SHOTS
folder. Data in /data/ovidiuv/IDS/Bias folder. |
PerfU008 Any variation in bias structure should be noted. Take a
bias frame whilst the telescope is tracking, derotating and autoguiding
and with other sources of RF interference that are possible. Note down the
conditions and the readout noise for this test, and any "banding" apparent
on the frame. Note the run numbers.
| Notes:
No major interferences seen. |
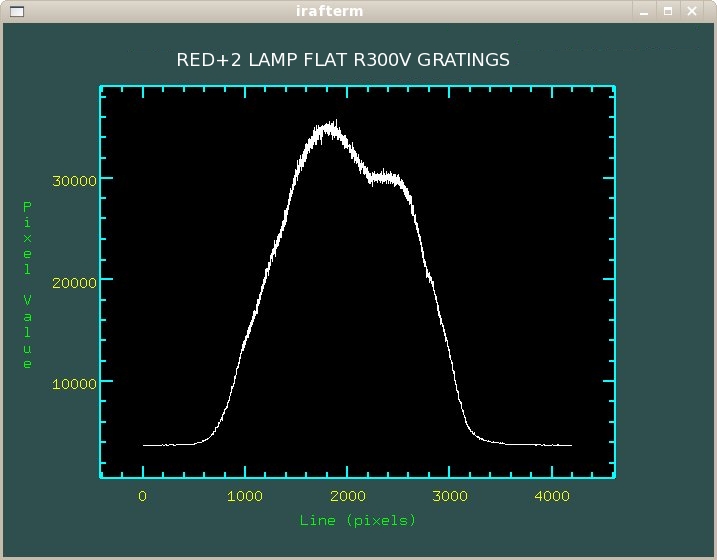
PerfU009 The linearity of the device should be known. Carry out
linearity tests at all supported readout speeds. Note the integration times
used, the resulting values. Draw a graph of the deviation from linear for
all readout speeds and attach the graphs to this document.
| Notes: Take lamp flats (bin 1x1 in slow mode only) using 5, 10, 15, ..., 160s exposures, then 4, 3, 2, 1, 0.5, 0.2 and 0.1s. Plot mean ADU value versus exposure time in REDPLUS2-LINEARITY.pdf plot. Estimated linearity: within 0.1% up to 50,000 ADU; and within 1% very close to 60,000 ADU. See also REDPLUS2-LINEARITY.jpg image. Run data: r786016-..054. Data in /data/ovidiuv/IDS/PerfU009 folder. |
PerfU010-PerfU015 Binned readout mode. Carry out tests PerfU004-PerfU009
and note down the results when using the chip in 2x1, 1x2 and 2x2 mode.
| Notes: Done, please see results and data above (PerfU004, 005, 006). |
PerfU016-PerfU021 Windowed readout mode. Carry out tests PerfUOO5-PerfU009
and note down the results when using the device is windowed. If the CCD
is to be used on a spectrograph were a particular window will generally
be used then this window setting should be used then this window setting
will be used for tests.
| Window | Speed | Binning | Bias | Gain (e/ADU) | Noise (e) |
| [837:1037,1100:3100] | Slow | bin1x1 bin1x2 bin2x1 bin2x2 |
3735 3736 3683 3684 |
1.06 1.06 1.06 2.01 |
2.89 2.89 2.95 2.95 |
| [837:1037,1100:3100] | Fast | bin1x1 bin1x2 bin2x1 bin2x2 |
2990 2998 2973 2973 |
2.15 2.15 2.13 2.13 |
4.43 4.43 4.48 4.41 |
| Notes: Run numbers: r782538-..540. Structure similar to non-windowed, including darker vertical region at left and brighter horizontal region at bottom. Windowed and binned data taken by Amy Tyndall on 14 Apr 2011 (S/D night). Bias level, gain and noise are quite stable (within normal variations). Data in /data/ovidiuv/IDS/Bias-window and /data/ovidiuv/IDS/PerfU016 folders. |
PerfU022-27 If two-gain mode is available with this chip then the
tests Perf005-009 should be carried out with the more ‘uncommon’
setting. Do 2 x 900 sec dark exposures at night. Note down the dark current
and the run numbers used.
| Notes:
Run numbers: Darks 900s x 3 images: r786075-..077; Darks 300s x
3 images: r786078-..-080; |
PerfU028 Using the above frame estimate the cosmic ray count, in
events per hour. The hot pixels intrinsic to the device can be found combining
the images within IRAF with appropriate clipping parameters.
| Notes:
Measured in 3 x 900s dark images; counted 60, 73 and 58 events;
so an average of 64 events in 900s. Thus, we identified ~256 cosmic
ray events/hr across standard window IDS/REDPLUS2. Note: the Sun
was very active during Feb-Mar 2011, being probably responsible
for this relatively high number of strikes. Images in REDPLUS2-DARK
folder. Data in /data/ovidiuv/IDS/PerfU022 folder. |
PerfU029 Using the dark images taken in Perf028 produce a bad pixel
map and attach a printout of the image with the look up table optimised
to show the traps. List pixel co-ordinates of all traps and other poor cosmetics.
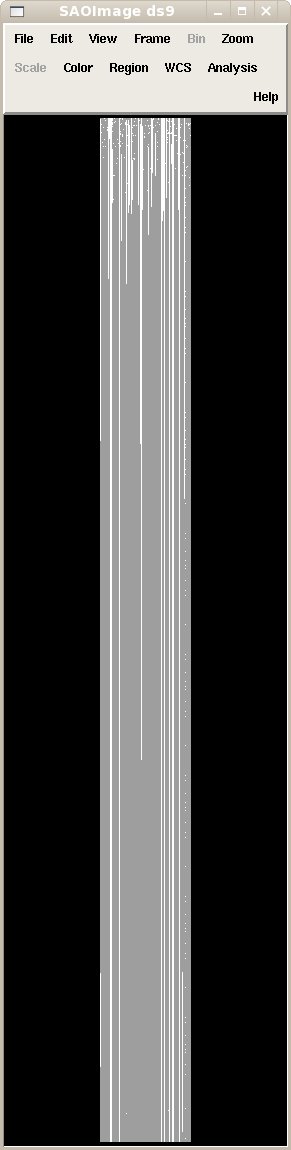
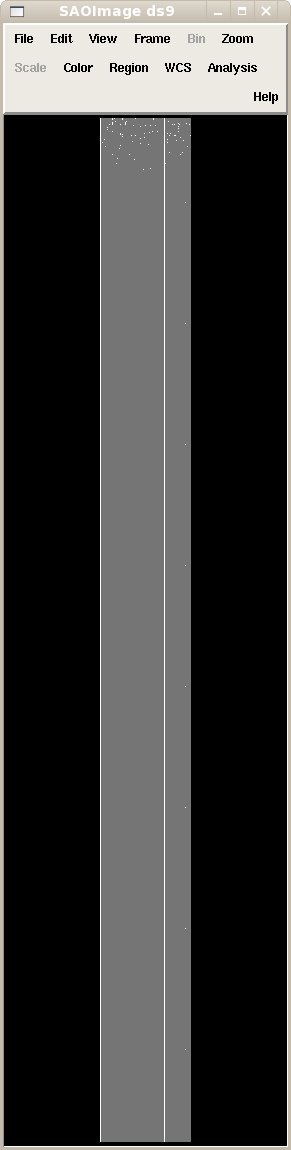
| Notes: I used the lamp flats (not the darks!) taken with 10s (runs r786091-..095) and 90s (runs r786081-..085). I divided 90s master flat by 10s one to create the badpixel map, using CCDMASK task in IRAF. Using CCDMASK's default sigma threshold =6 (parameters lsigma = hsigma = 6), the resulting badpix mask includes quite many "bad columns" (plot here) but increasing the threshold = 10, only one column and a few pixels are flagged (plot here). Screenshots in BADPIX2-BADPIX folder. Data in /data/ovidiuv/IDS/PerfU030 folder. |
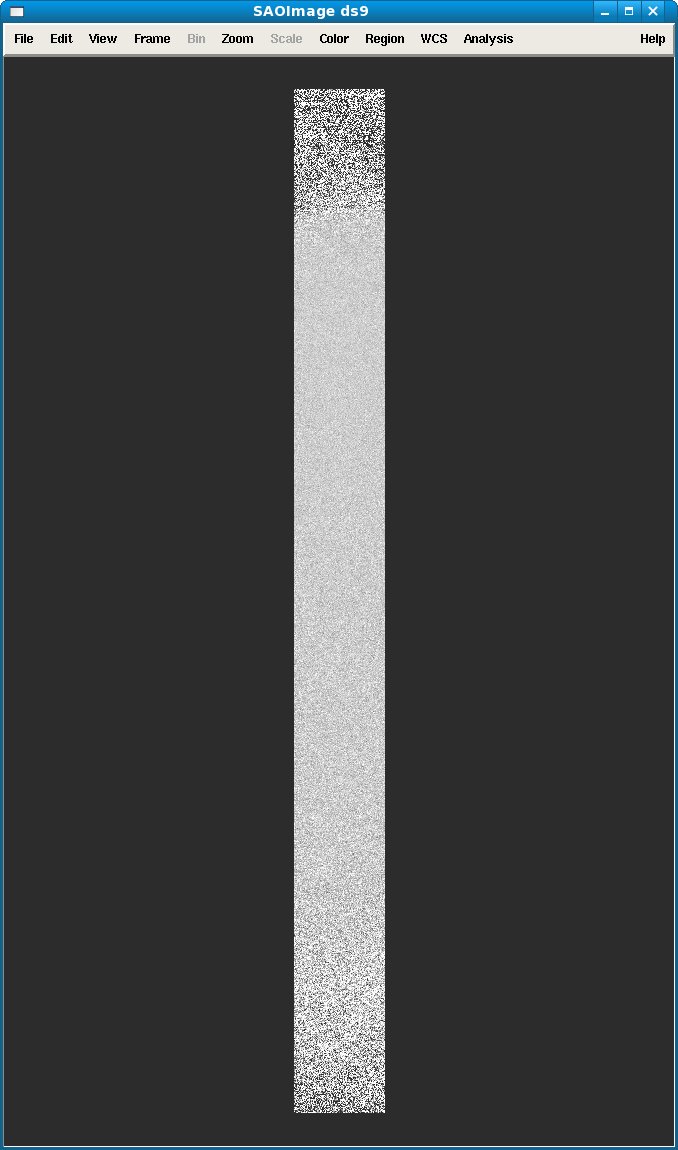
PerfU030 Take a flat field exposure (e.g. sky flat, lamp flat or
dome flat) and normalise the signal level to approximately unit. Attach
a copy of this image to show cosmetics and the pixel to pixel response variations
that cannot be seen in the dark images. Note the run number used.
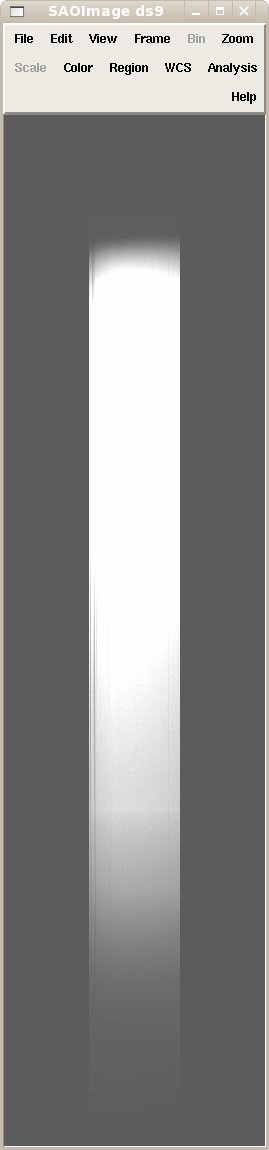
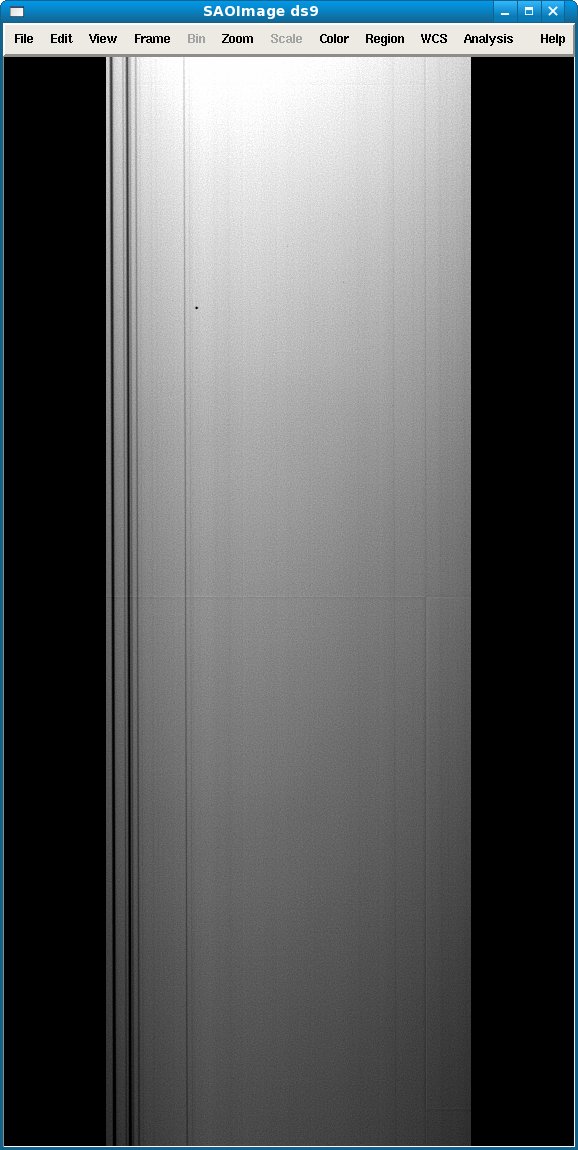
| Notes: Using slow mode and bin 1x1 and default IDS window, I took lamp flats taken (5 of each) with 10s (runs r786091-..095), 30s (runs r786081-..-085) and 90s (runs r786081-..085). Using them, I created masterflat10, ..30, ..90, treating them of masterbias. Screenshot in REDPLUS2-FLAT-BIN1x1.jpg and REDPLUS2-FLAT-BIN1x1-ZOOM1.jpg. Working folder: /data/ovidiuv/IDS/PerfU030. |
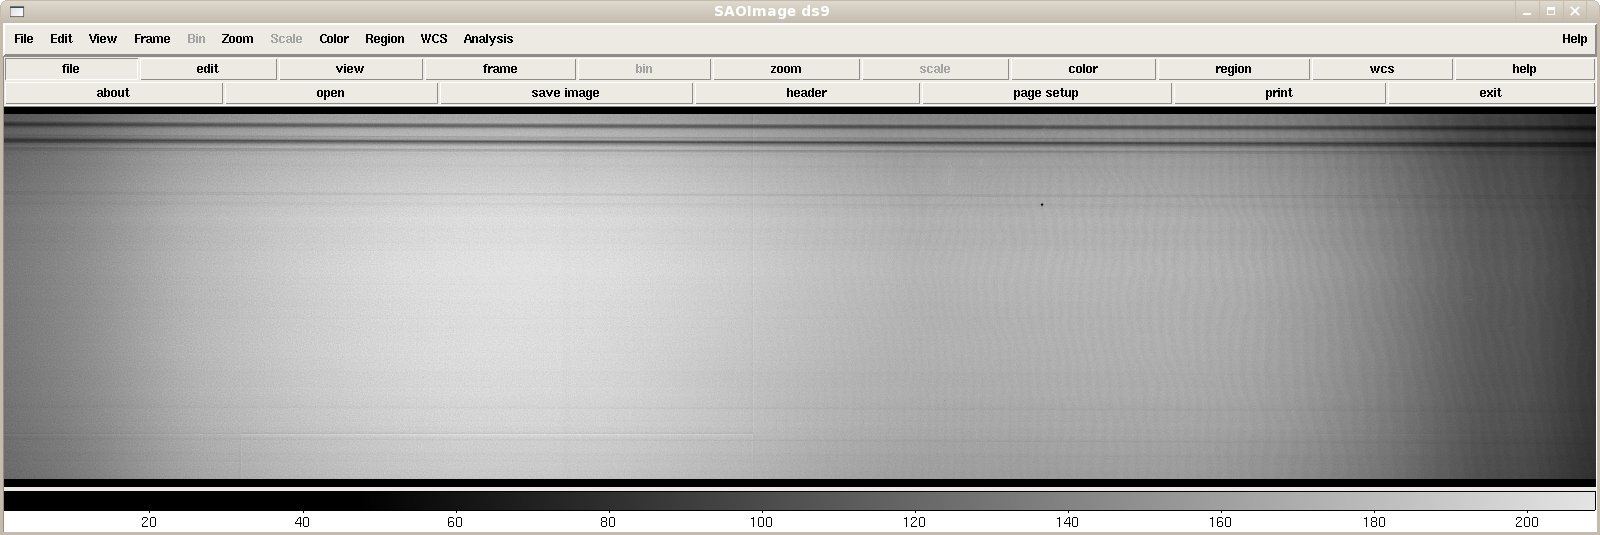
PerfU031 Calculate the pixel-to-pixel variations, using well exposed
multi-flats in PerfU032. Show how the calculation was done.
| Notes:
We combined 5 images of 90 sec each, then 5 images of 10 sec each. Then, we divided the results.
Please see divided flat image and
the central column cut.
Most of the data (from Y=800 to Y=3600) remain very stable (within less than 0.1 percent), close
to 9 (ratio of the two series exposure times), with the rest affected by vignetting (bellow cca
50 percent) at the two CCD Y-ends and the largest jumps some 200 pixels close to Y=4000.
Data in /data/ovidiuv/IDS/PerfU030 folder. |
PerfU032 List the charge transfer in all readout speeds (provided by manufacturer).
Include plots of cosmics and method of calculation.
| Readout Speed | HCTE | VCTE |
| slow | 0.999998 | >0.999999 |
| Notes:
See PerfU028 for counting cosmic ray events. |
PerfU033 The stability of the bias level and readout noise should be noted. The CCD-controller must itself have been powered up continuously for 24 hours, then without turning the drive box off, note down the bias level and readout noise (in ADUs) every 6 hours for 24 hours.
NB this should be done during the first S/D night when the chip or mosaic
is on the telescope.
| Notes: We used perfu033 script to run different IDS settings. We performed the test three times, at ~5hr intervals (beginning, mid and end of the night). Run numbers: set 1: r785975-..-r786014; set2: r786161-..-r786200; set3: r726235-..-r786274. The median number of counts (obtained with imstat) show a very stable bias level (within a few counts). Here are the numbers: bin 1x1: slow: 3704, 3699, 3707; fast: 2978, 2976, 2979 bin 1x2: slow: 3705, 3699, 3708; fast: 2979, 2977, 2980 bin 2x1: slow: 3661, 3655, 3650; fast: 2964, 2952, 2957 bin 2x2: slow: 3663, 3655, 3650; fast: 2964, 2962, 2957 All data in folder /data/ovidiuv/IDS/PerfU033 Update: Ricardo Carrera (IDS RED+2 user in 14-16 Apr 2011) reported some difference in the bias level within ~12 hrs interval (beginning and the end of the night) of about 20 ADUs (higher at the end), which repeated the second night. Andy confirmed that this is quite normal, also for other CCDs. |
2.3 Astronomical measurements and test
The astronomical tests to be carried out will depend on if the chip
is to be commissioned at a spectroscopic or imaging focal station. If spectroscopy
then skip to section 2.3.2 and leave this section 2.3.1 blank.
2.3.1 CCDs for use at imaging stations.
AstroImageU001 Find out where the optical field/rotator centre is
on the CCD. Adjust to silicon centre if possible. Note down pixel co-ordinates,
the instrument name and any telescope and capstan settings that effect this.
| Notes: |
AstroimageU002 Align CCD columns and rows with celestial co-ordinate
system (e.g. by startrail tests) and note down capstan settings and any
other parameters that may effect alignment.
| Notes: |
AstroimageU003 Establish optimum capstan setting for the detector
at its most common imaging foci. If relevant, bear in mind the final position
should allow TV and Autoguider to reach focus. Note down the capstan settings
and telescope focus. (Lock the capstans after adjustment).
| Notes: |
AstroimageU004 Take standard star fields(s) in UBVRI filters and
either reduce the data or inform the instrument specialist that the analysis
needs completion. Note the run numbers. When the analysis is done make a
note of the throughput here (in standard units along with a brief explanation
of the method)
| Notes: |
AstroimageU005 Establish colour correction terms. Note down the
procedure used and the run numbers.
| Notes: |
AstroimageU006 Confirm the pixel size as projected on sky using
a standard field. Calculate the pixel size as at the other common foci.
Indicate which are calculated and which are measured
| Notes: |
AstroimageU007 Calculate the minimum usable exposure time on the
focal station on which the device is to be used most commonly. This can
be done by carrying out a linearity test at low shutter speeds. Write down
the method and the results. As this is generally set by the shutter in the
instrument itself it will not usually need to be recalculated for every
CCD. The commissioning astronomer and the instrument specialist should satisfy
themselves that this has been done for the station in question.
| Notes: |
AstroimageU008 Confirm that the de-tilting routines in the ING IRAF
package are working satisfactorily with this device and that all tilt can
be removed. Contact the instrument specialist to implement any changes necessary
or with any other queries.
| Notes: |
2.3.2 CCDs for use at spectroscopic stations
AstrospectU001 Find were the centre of the slit corresponds to on
the CCD if applicable (this may not apply to all spectrometer usage) note
row/column value. This can be done with a narrow dekker or a star.
| Notes: We measured X=196 using a standard star spectra and standard windowing. |
AstrospectU002 Ensure that the CCD can be focussed satisfactorily
ie make sure that all tilt (spatial and spectral) can be removed an that
hartmann shifts of <5um can be obtained across the focal plane. Ensure
that the cryostat can be rotated so that arc lines can be aligned along
columns (or rows) to within 5um ie that the top-bottom shifts over the full
spectroscopic window are less than 0.2 pixels (of a 24 micron pixel device).
Note the final best focus run numbers (a pair of hartmann images) note the
capstan settings.
| Notes: I checked and completed the IDS setup 4 times: |
Best Hartmann images: r781494-..95; Best focus image: r781469; Collimator less than 208, setup not finished); Data in /data/ovidiuv/IDS/setup-19Jan folder; Best Hartmann images: r782196-..97; Best focus image: r782197; Best collimator: 192 (setup finished OK); Data in /data/ovidiuv/IDS/setup-20Jan folder; Best Hartmann images: r782397-..98; Best focus image: r782399; Best collimator: 195 (setup finished OK); Data in /data/ovidiuv/IDS/setup-25Jan folder; Best Hartmann images: r785932-..33; Best focus image: r785934; Best collimator: 196 (setup finished OK); Data in /data/ovidiuv/IDS/setup-18Feb folder. Using a small slit (0.6-1"), final arc lines FWHM is 1.5-1.7 pixels (0.7") uniformly across the chip (within ~0.2 pixels), while the arc lines are horizontal within ~0.3 pixels. Some final arc images in REDPLUS2-ARC folder. |
AstrospectU003 Confirm that the IRAF routines in the ING package work
with this CCD and that the advice on direction and magnitude of capstan movements
are correct. Confirm also that the collimator movement advice is correct and
that the CCD can be focussed within the acceptable non-astigmatic region of
the collimator. Contact the instrument specialist from implementing these
these routines and any other queries.
| Notes: During the setup process, I fixed the IRAF ING scripts "ids_rotation" and "ids_tilt" (in fact their associated two files database) to work with REDPLUS2 camera. Two lines defining the REDPLUS2 camera orientation and some plate scale factors (related to micrometer and capstan readings) were added at the end of the files in the two database, namely (see copy here): ids_rotation.dat and ids_tilt.dat. New data was found based on trial and error starting from previous data for EEV10 CCD, because I could not find exactly the meaning and calculation mode for each constant (nobody knew to tell me, incl Pablo former INT and IDS specialist). |
AstrospectU004 Take exposures of a spectroscopic flux standard under
the usual conditions for measuring throughput. This generally means a wide slit,
lowest spectral resolution possible plus no filters. Contact the instrument
specialist in advance for the required set-up. Either reduce the data and note
the results here or inform the instrument specialist of the run numbers and the
setup used.
| Notes: Using R300V lower resolution gratings centered at lambda 7800A, Annemieke observed one standard (SP1036+433) later during the night. I present her reduced spectra (by bias and flat field) here: SP1036+433. Before Annemieke, I also observed two other standards (SP0934+554 and SP0946+139) using the higher resolution gratings H1800V centered at 5000A (run numbers r786151-..52 and r786153, respectively), taking also arcs with 5" and 1" slit width (run numbers r786154-..159). Data in /data/ovidiuv/IDS/AstrospectU004 folder. On 10 May 2011, Lindsay observed the standard star Feige 34 close to Zenith. After comparing the three datasets, I decided to use the last one to derive the throughput of RED+2 with IDS. Final plot included on the public IDS website here and comparison plot with older cameras is here. RED+2 is responding as expected, being more sensitive in the red (above 5000 A compared with EEV10 and 7500 compared with other older CCDs). |
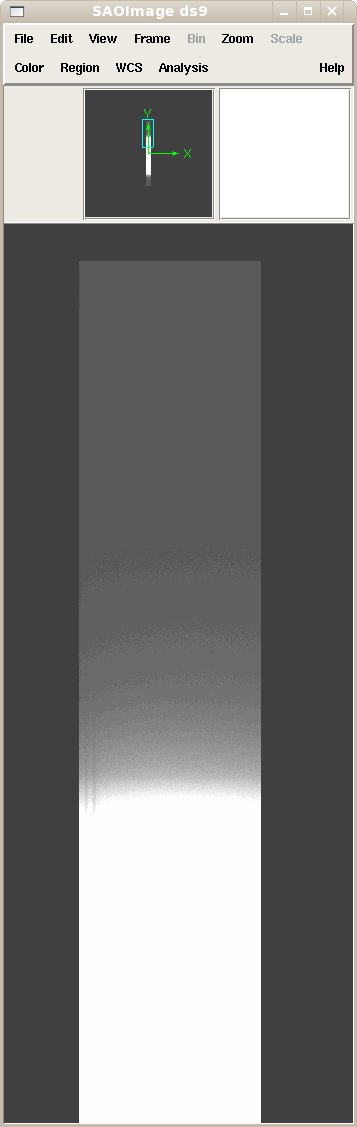
AstrospectU005 Calculate the minimum usable exposure time on the focal
station on which the device is to be used most commonly. This can be done
by carrying out a linearity test at low shutter speeds. Write down the method
and the results. As this is generally set by the shutter in the instrument
itself it will not usually need to be recalculated for every CCD. The commissioning
astronomer and the instrument specialist should satisfy themselves that this
has been done for the station in question.
| Notes: I used lamp flats taken with 4s, 3s, 2s, 1s, 0.5s, 0.2s and 0.1s. I divided 4s to the faster ones and studied the result (image and plot column cut) to look for any shutter effect. Clear level changes (drop by about 5%) at the top and bottom of the CCD were seen for the exposures shorter than 1s, and less changes for those longer than 1s (which could be associated with vignetting, I think). Given these, we recommend 1 sec as a limit of visibility of the shutter effect. Data in /data/ovidiuv/IDS/PerfU009 folder, and resulting divided flat images in REDPLUS2-SHUTTER folder (ex: FLAT4DIV0p1 means the resulting flat 4s divided by flat 0.1s image). |
AstrospectU006 Confirm the pixel size on sky by observing a pair of
stars of known separation on the slit.
| Notes: I observed a double Tycho star, namely TDSC25498 (found by Vizier and Tycho Double Stars Catalog), carefully placing both stars in the slit (PA = 258.7 deg). I measured the X1 and X2 and calculated the REPLUS2 pixel scale by knowing the separation of the stars from the catalog (79.41"), namely 0.437"/pix (matching the calculated 0.44"/pix taking into account the 13.5 micron pixel size and comparing with the old camera EEV10 pixel scale 0.40"/pix and 15 micron pixel size. Data in /data/ovidiuv/IDS/AstrospectU006 folder. |
AstrospectU007 Define the direction of movement along the slit viewed
on the TV acq. system with respect to the CCD columns or rows e.g.. a movement
to the right of the TV results in the object moving which way on the CCD.
| Notes: Center the star (run r786201), then move telescope to the South (or star to North) take another image (run r786202), spectra went to the right on REDPLUS2 image. Thus, REDPLUS2 orientation is normal for the INT, with North to the left. Data in /data/ovidiuv/IDS/AstrospectU007 folder. |
AstrospectU008 Confirm that the slit-to-detector reduction factor
expected is reproduced with this CCD ie calculate what width of the slit should
project to in terms of the FWHM of the arc lines and measure this at best
focus position.
| Notes: Using H1800V high resolution gratings with 0.6" slit, I obtained FWHM 1.5-1.6 pix = 0.7" for most CuNe+CuAr arc lines across the whole wavelength interval. Former tests using lower resolution R300V gratings gave similar FWHM values. |
2.3.3 Other device specific tests or comments.
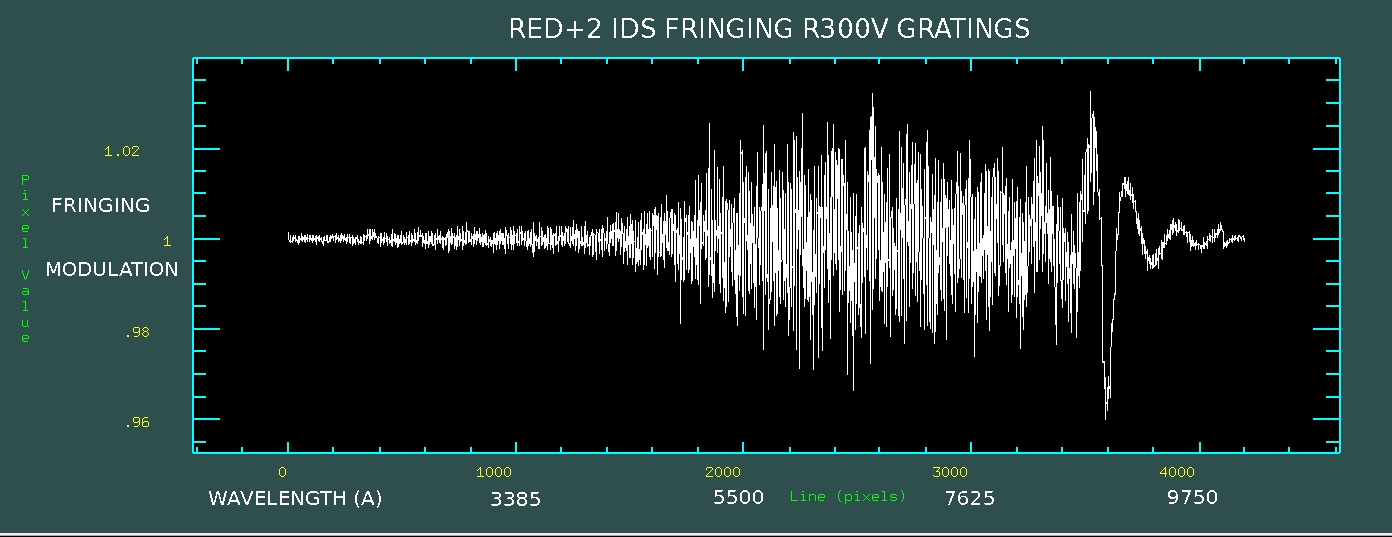
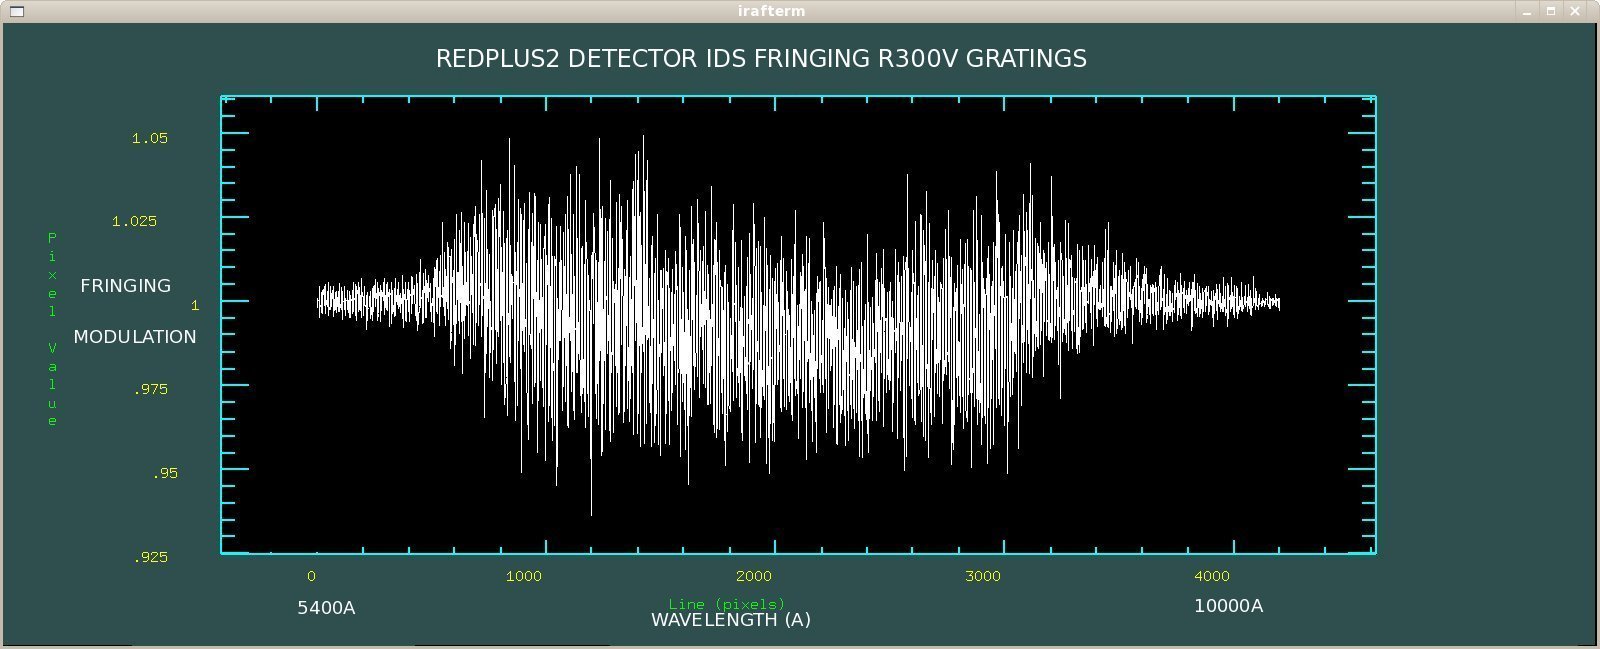
| Notes: Other tests suggested by Chris and Ian: Fringing: First, I worked on Annemieke's lamp flat using her low resolution setup (R300V, central lambda 7800, coverage 3400-12000A). Not much fringing visible after displaying the whole (zoomed out) image: REDPLUS2-FLAT-R300V-5400A-10000A and column cut REDPLUS2-FLAT-R300V-5400A-10000A-COLCUT and bigger REDPLUS2-FLAT-R300V-5400A-10000A-COLCUT1 and top red end here REDPLUS2-FLAT-R300V-5400A-10000A-TOPRED. Nevertheless, some fringing visible while displaying non zoomed central image with convenient contrast/brightness: REDPLUS2-FLAT-R300V-7200A-8500A-rotated270deg (limits: 7200A at left and 8500A at right). There are different algorithms to plot the fringing. I used 3 approaches and 3 datasets to quantify and plot the fringing: In a first approach I combined 5 lamp flats taken by Amy Tyndall and Lindsay Magill on 14 April 2011 with gratings R300V, lambda central 5510A. I fitted the combined image with FIT1D (spline3, order=20) and divided the two, in order to quatify the fringing, obtaining the following plot: RED+2-FRINGING-MODULATION (not much fringing visible). A second approach to quantify the fringing: I inverted in IRAF the lines in the original flat image (creating a new image) which I then divided by the original flat. Taking a column cut I obtained the following fringing modulation plot: REDPLUS2-FRINGING-R300V-5400A-10000A corresponding to limits between 5400A and 10000A (not much fringing visible) In the third approach I averaged the central columns 201-204 producing a one-dimensional image along the whole wavelength which holds the signature of the fringing, then I averaged the central columns 100-300 producing a similar one-dimensional image which averaged out the fringing. Then, I divided one by the other to plot the fringing in RED+2-FRINGING-MODULATION. I used the reduced lamp flat taken by Annemieke with R300V gratings, central lambda 7790A and cut the plot between 6,000A and 10,000A. I addopt the above third plot as the best, which show some 1% RED+2 fringing above 600nm growing up to 2% close to 1000nm. All approaches show similar results. The following plot FRINGING-REDPLUS2-EEV10 compares fringing of IDS RED+2 (plot in red) with that of the old camera IDS EEV10 (plot in blue) both taken with the same R300V gratings and similar central wavelenghts. While RED+2 remains very low fringing (bellow 0.2%) up to 1000nm, EEV10 frining grows up to 25% at the very red regime. The following mosaic image shows the two reduced fringing with EEV10 (left) and RED+2 (right), both cut between 600nm and 1000nm: FRINGING-REDPLUS2-EEV10-IMAGES Working fringing data in /data/ovidiuv/IDS/Fringing folder. Flexure: Evidenced - please see MechU008 test above. Ghosts: no ghost visible other than a few (~10 pixels) brighter lines at the bottom on the bias. Direction of red/blue: Red is increasing upward (in normal displayed image). |
2.4 Software tests
SoftU001 The software should detect illegal windows and implement
legal ones when requested. Try defining windows outside of the physical
range of the device and note the software response and whether it is expected.
Check that no windows are saved in the controller particularly window 0.
| Notes: It works for illegal windows, so I recommend some tech fix in the near future. |
SoftU002 The software should detect illegal attempts to bin and implement
legal ones when requested. Try to bin in the following, way and note the software
response and whether it is as expected: BIN 2x2, BIN 1000x1, BIN, 4x1 BIN
2000x2, BIN 1x4
| Notes: It works for illegal binning, so I recommend some tech fix in the near future here. |
SoftU003 Check that all the information held in the FITS header is
correct for this CCD. On the WHT the detectors definition file will have to
have this detector added, along with the gains and readout noises for all
readout speeds.
| Notes: Checked, all data OK in headers, e.g., DETECTOR=REDPLUS2 GAIN=0.91 READNOIS=3.48 |
3 Acceptance Tests
3.1 Delivery
Notes: All performance documentation relating to this camera can be found here: http://www.ing.iac.es/Engineering/detectors/g3_ultra_red%2B2.html All engineering information can be found here:
http://www.ing.iac.es/~eng/detectors/SDSU/hardware/SDSU_wiring.htm |
3.2 Performance
The commissioning astronomer should accept that the chip is configured in an acceptable way
| Notes: All tests concluded that RED+2 on IDS is configured in an acceptable way. |
3.3 Acceptance
If improvements have been agreed, or deliveries are yet to be received, this section should not be completed. If the CCD is acceptable in its current state, this document should be signed off by the people below.
Commissioning Astronomer (ING): Ovidiu Vaduvescu, 25th November 2011
Commissioning Engineer (ING): (sign and date) Andy Ridings 28th November 2011
Head of Engineering (ING): (sign and date)
When this document has been completed. it must be held by the detector section.