|
Linearity Source |
|
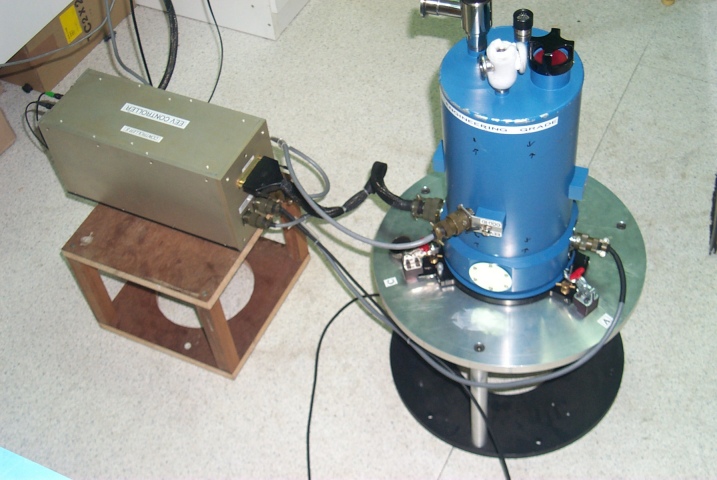
This source is designed to be mounted externally to a camera cryostat, from where it can be used to accurately measure the linearity of the camera under test. The source contains a Nichia NLPB500 blue LED (peak output 425nm), chosen for its low
temperature coefficient. The source is under the control of the SDSU controller. The uDAS 'flash' command is used to turn the source on. A special cable is required between front panel SDSU temperature connector and the source. This cable takes the pre-flash signal to a co-axial cable rather than to the cryostat temperature connector, as is normally the case. The cable is then plugged into the linearity source.The uDAS 'flash' command is used as follows :
SYS> flash [CAMERA] n
where n is the pre-flash time in seconds, ranging from 0.001 to 8. Unfortunately, at the lower end of this range the actual pulse width starts to diverge from the demanded pulse width. A number of demanded pre-flash times are compared below with the actual times as measured with an oscilloscope:
|
Demanded |
Actual |
|
0.001 |
0.000828 |
|
0.002 |
0.00163 |
|
0.004 |
0.00403 |
|
0.007 |
0.0064 |
|
0.01 |
0.00964 |
|
0.02 |
0.02 |
|
0.03 |
0.0297 |
|
0.05 |
0.0498 |
|
0.08 |
0.0802 |
|
0.1 |
0.0996 |
|
0.12 |
0.1204 |
|
0.15 |
0.1496 |
|
0.3 |
0.3 |
|
0.5 |
0.5 |
|
1 |
1 |
These corrections must be taken into account if you use pre-flash times of less than 0.15s.
The intrinsic linearity of the source is very good i.e. the relationship between 'on-time' and total light output is linear. See
here to see how this was checked. Self heating is normally a problem with LEDs, it is certainly a problem with the internal cryostat LEDs since they are physically small and driven with a 6mA current. The LED inside the source has a 250uA drive current and an intrinsically low temperature coefficient of brightness. When energised it dissipates approximately 0.5mW of heat. Since the thermal resistance between the LED junction and its pins is approximately 200K/W, the maximum temperature rise is expected to be 0.1K. This should only affect its brightness by 0.02%. At the lower end of the pulse range, the linearity may be slightly affected by the finite switching time of the driver circuitry. The falling edge of the LED drive pulse has a period of 20us.The source is very faint. There is neutral density filtering in front of the LED so that the source brightness is well matched to the available range of pre-flash pulse widths. It produces a spot image at the centre of the CCD, approximately 5mm in diameter. The time for the centre of the spot image to reach ADC saturation (65000 ADU) for the various ING cameras is shown in the table below:
|
Camera |
Time to reach saturation in FAST |
Time to reach saturation in SLOW |
|
All EEV cameras |
8s |
4s |
|
All TEK cameras |
6.5s |
3s |
|
All SITe cameras |
5.2s |
4s |
|
MITLL0 |
|
|
|
|
|
|
|
Camera under measurement |
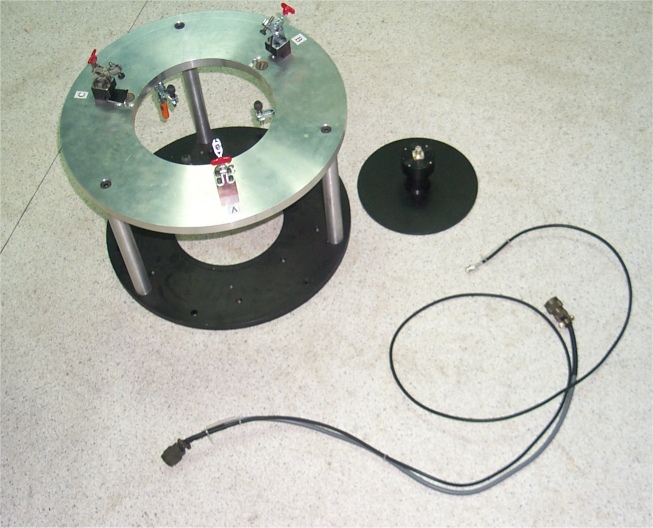
Source and Cabling |
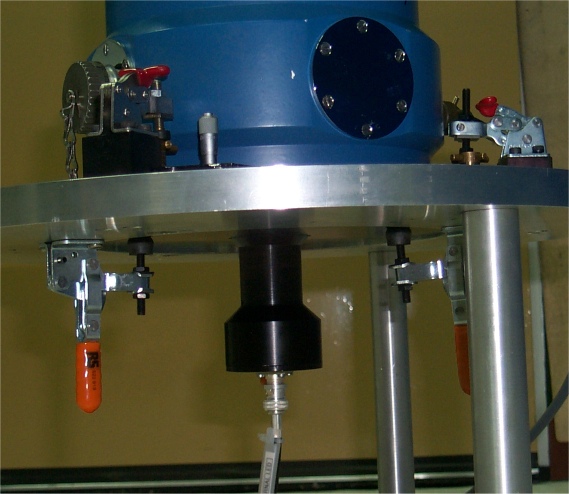
Source on mount |
Precautions.
It is helpful to have the spot appear on the same part of the CCD each time it is mounted. Although the spot is nominally on the optical axis, the alignment of the CCD inside its cryostat can be as much as 1mm in error. To help with this, the three clamps on the top of the linearity rig are labelled A,B and C. Additionally there are arrows marked on the rig and the lamp itself. When the lamp is mounted, these arrows should be lined up.
When fully mounted the source will still leak some ambient light. With normal room lighting, the dark signal will be about 1e per second for an EEV CCD. The source should be used in a darkroom or with a black cloth thrown over.
Make sure the CCD temperature is stable. If the temperature changes during the measurement, so might the sensitivity of the CCD.
When measuring the signal from the images, use a small window in which there is not a large variation in illumination. This will probably mean using a small 50 x 50 pixel window centred on the illumination maximum. The peak will be very close to the optical centre of the CCD. The picture below shows the illumination profile produced on a TEK1024 device (click to enlarge):
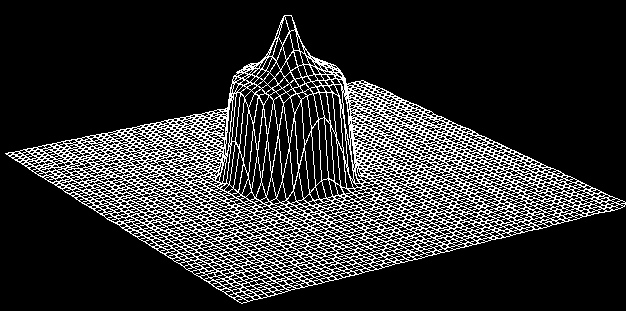
obtained using IRAF 'surface' command
Sample Data.
The new source was used to check the linearity of TEK4 in fast speed. The range of pre-flash times was 100ms to 6.5s
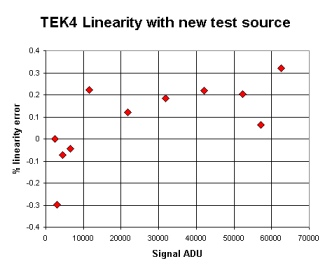
The EXCEL spreadsheet used to produce this graph can be downloaded here.
Links.
LED drive circuitry inside SDSU controller
Linearity measurement technique
Simon Tulloch Nov 2001