StripTool
The StripTool program is used to display a continuous record of the value of one or more PV's. the example shows the graph of CPU loads on some EPICS Crates.
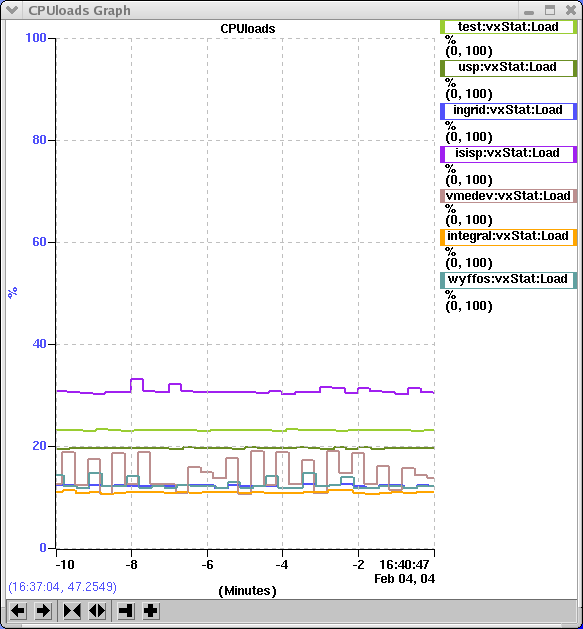
The program is started with the command "StripTool" this will pop up a Controls window. The PV to monitor is entered into the "Plot New Signal" box and the Connect button is activated. this will pop up the Graph Window to display the monitored value. The current configuration can be saved under the File->Save As drop-down menu. Predefined displays can be loaded with the File->Load drop-down menu. The data displayed above is from the "CPULoads" file in the /home/epicssm/lib/stripTool directory.
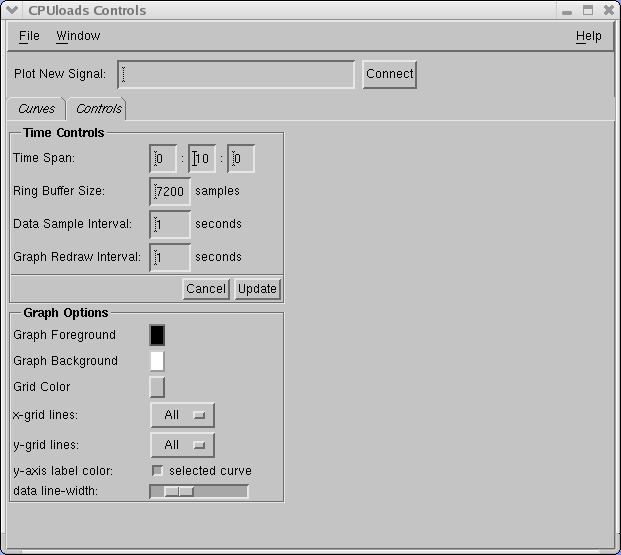
The Controls tab allows various display parameters to be adjusted, Time controls and Graph options.
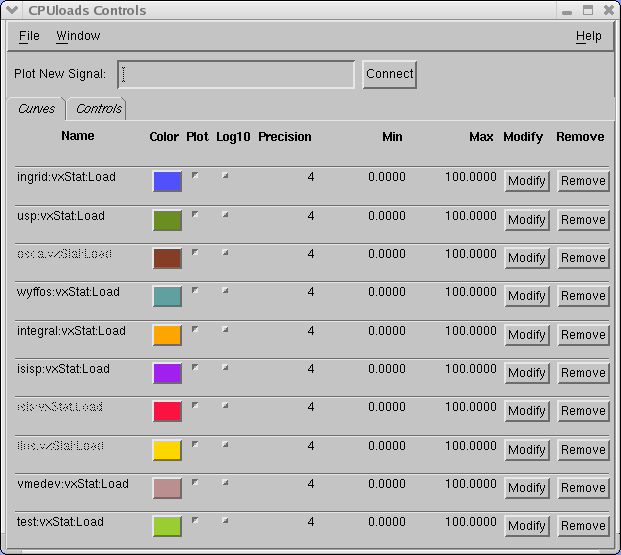
The Curve tab allows individual PV parameters to be adjusted, for example the Minimum and Maximum values allowed for the display of the PV. The Graph window may be resized at any time without loss of data.
Where a PV name is "grayed out" on the Curves tab this means that the PV value is not available for display at this time.
Probe
This program allows for the continuous monitoring of the value of a PV. Start the program by executing the command "probe " from the command line.
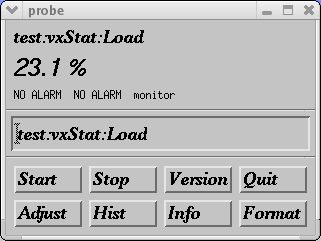 |
Insert the PV name into the box (test:vxStat:load) and press the Start button on the display. The value will be monitored and displayed. |
| If the PV is an input variable the value can be changed by typing a new value in the window or adjusting the slider control. | 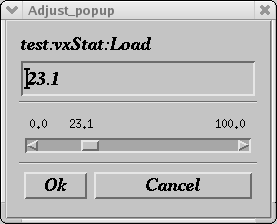 |
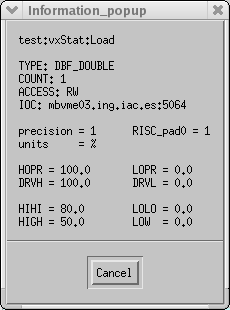 |
Information on the PV is available with the Info button. |