Version 13 May 2021
For a list of PGPLOT subroutines (with description and syntax), see this page at Durham.
Examples are shown below. '[ ]' indicates example crb prog using this call.
PGPLOT syntax examples (html crb/notes/notespgplot.html)
----------------------

'=' indicates non-standard aliases

Setup:

call pgbeg(0,device,1,1) [cols.f]
  = pgbegin
call pgenv(-6.0,4.0,-6.0,4.0,0,0) [cols.f]
  IJUST (5th no.) = 1 for same scales on x and y axes
  AXIS (6th no.) = 0 for usual plot, -1 for box only, -2 for no box
  Or call pgswin then pgbox
call pglab('alpha(4500-6000)','alpha(6000-8000)',' ') [cols.f]
  = pglabel
call pgend

call pgbox('BCNST',0.0,0,'BCNST',0.0,0) [const.f, curve.f]
call pgpage (= pgadvance)
call pgpap(35.0,0.9) = (width in inches, height/width) [timel.f]
call pgqvp(1,x1,x2,y1,y2) [const.f]
call pgvsize(xleft,xright,ybot,ytop) [const.f]
call pgwindow(r2,r1,d1,d2) [const.f]

Text:

call pgiden - write name, timestamp at bottom of plot
call pglen - length of string in different units [useful to decrowd?]
call pgmtxt - at posn rel to viewport
call pgnumb - convert number into plottable char string
call pgscf(2) - 1 default; 2 roman; 3 italic; 4 script
call pgsch(0.7)
call pgslw(2)
call pgtext(x,y,text)
call pgptxt(alph1(i),alph2(i),0.0,0.5,t(i)) [cols.txt]
  = pgptext
  The 0.0 is tilt angle in deg, 0.5 is the justification - 0.0 =
  left justify, 0.5 = centre, 1.0 = right justify

Graphics:

call pgarro(x1,y1,x2,y2) [vpri.f]
  Use pgsah to set shape, pgsch to set size
call pgbin(20,dhistx,dummy,.false.) [qso3.f]
call pgcirc(xc,yc,d/2.) [gdl.f]
call pgcon* - contouring
call pgerr* - error bars
call pggray, pgimag, pgvect - grey, colour, vector reps of 2D arrays
call pghist - histogram
call pgline(2,xx,yy) [qso2.f]
call pgpixl - draw pixels
call pgpnts - graph markers, each with diff symbol
call pgpt(npl,xx,yy,isymb) [id3.f]
call pgpoly(n,x,y) [gdl.f]
call pgpt1(xx-v/2.,yy+0.02,28) [qso3.f]
  = pgpt?
call pgrect(x1,x2,y1,y2) [flag.f]
call pgsah(1,45,0.3) [vpri.f]
  1 is fro fill, 2 -> outline.  45 is angle, 0.3 is cutaway
call pgsfs(1)
  1 for solid fillstyle, 2 for outline
call pgsls(4) - 1 full; 2 dashed; 3 dash dot; 4 dotted; 5 dash dot dot dot

Colours:

call pgsci(ic(j)) [pfcsh.f]
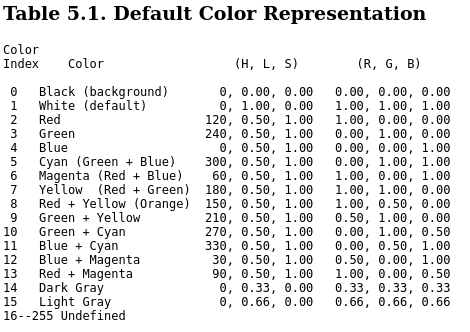
  (0 w, 1 b, 2 r, 3 g, 4 db, 5 lb, 6 mauve, 7 yellow, 8 orange,
  9 lgreen etc.) [flag.f]
call pgscr(16,r,g,b) [gdl.f, colpal.f]

Queries:

call pgqah, qcf, qch, qci, qcr, qcs, qfs, qhs, qinf, qls, qlw, qvp

Cursor and pen movement:

call pgband - read cursor posn
call pgcurs - read cursor posn
call pgdraw - line from current pen position to a point
call pglcur - use cursor to draw polyline
call pgmove - move pen
call pgncur - mark set of points using cursor
call pgolin - set of points using cursor
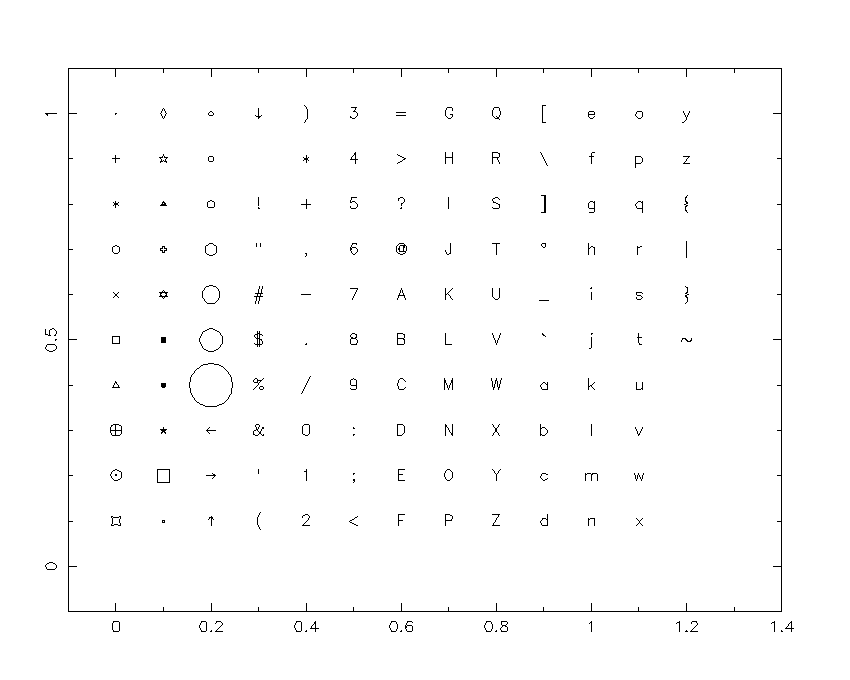
PGPLOT symbols 1 - 126 (called from e.g. PGPT, PGPNTS) are shown below,
with the top symbol in each row being number 1, 11, 21, 31... 121:


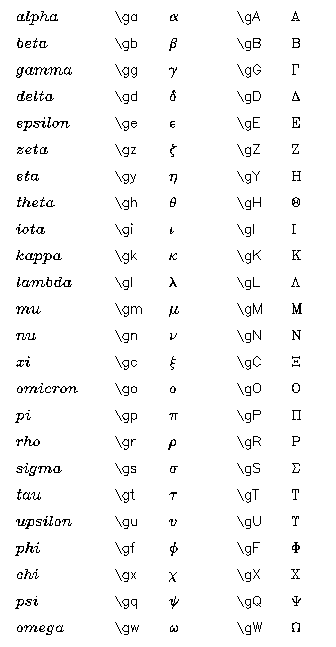
Super- and sub-script controls \u \d when written out by Fortran need to be expressed as \\u \\d.
PGPLOT's default colors:

Palette showing 216 colours in one screenful.
Palette of 16 usefully-different colours.
The default size of a gif is 850 x 650 pixels (=> ~ 5k gif), corresponding to 10 inch x 8 inch at 85 dpi. This is OK for simple blocky graphics, but not enough for plots with a lot of small detail, or for publication, and sloping straight lines come out 'stepped'. (Increasing the line width helps a bit.)The solution is to increase the number of pixels by increasing the page size (and usually the line width as well, otherwise the lines will look very thin if the picture is scaled smaller), by inserting after the line 'call pgbegin...' calls to pgpap and pgslw e.g. for 17.5 inch x 14 inch (1489 x 1131 pixels, => ~ 20k gif):
call pgpap(17.5,0.8)
call pgslw(6)
No other changes are needed to the code. This is usually high-enough resolution for display on a web page. For publication e.g. in a book, you may need 35 inch x 28 inch (2976 x 2381 pixels => ~ 50k gif):
call pgpap(35.0,0.8)
call pgslw(12)
To reverse the colours on a plot (e.g. white on black to black on white), xv can be used. NB for very large images (35 inch x 28 inch) xv crops the result to 1500 x 1135 pixels (?). Workaround is to use an online resource to invert the colours.
Old notes on plot size, may not be useful:
To set the plot size in device coordinates, use the following instead of pgbegin, pgenv:
	call pgbegin(0,device,1,1)
	call pgvsize(1.0,8.1,1.0,6.6)
	call pgwindow(x1,x2,y1,y2)
	call pgbox('BCNST',0.0,0.0,'BCNST',0.0,0.0)
where the pgvsize above gives 7.1 * 5.6 inches i.e.
18 * 14.3 cm with sufficient margin for axis captions.
This size is fine for html gifs (i.e. not too wide for typical
browser settings).
Default from pgenv is ~ 24 * 19 cm (aspect ratio of above chosen to
be the same).
 |