- An average seeing of <1.67 arcsec (FWHM of 5 pixels) was required for each acceptable pointing. This defines a practical upper limit for reliable image morphological classification.
- An average stellar ellipticity (due to trailing) of better than <0.2 was required.
-
At least g', r', i', z' images must
be present and reach to the average 5-s
 survey depth. The u' filter is only necessary for lower redshift quasars.
 - Fan, X. et al., 1999, AJ, 118. 1. Citation in text | ADS
- Fan, X., Strauss, M. A., Schneider, D. P., Gunn, J. E., Lupton, R. H., Anderson, S. F., 2000a, AJ, 119, 1. Citation in text | ADS
- Fan, X. et al,. 2000b, AJ, 120, 1167. Citation in text | ADS
- Fan, X., Strauss, M. A., Newman, J. A. et al., 2001a, AJ, 121, 31. Citation in text | ADS
- Fan, X., Strauss, M. A., Schneider, D. P., Gunn, J. E., Lupton, R. H., Anderson, S. F., Becker, R. H. et al., 2001b, AJ, 121, 54. Citation in text | ADS
- Gunn, J. E., Peterson, B. A., 1965, ApJ, 142, 1633. Citation in text | ADS
- Irwin, M. J., Lewis, J. R., 2000, New Astronomy Reviews (in press). Citation in text
- McMahon, Walton, Irwin, Lewis, Bunclark, Jones and Sharp, 2000, astro-ph/0001285. Citation in text | LANL
- Metcalfe, N., Shanks, T., Fong, R., 2000, ING Newsl, 3, 3. Citation in text
- Schmidt, M., Schneider, D. P., Gunn, J. E., 1995, AJ, 110, 68. Citation in text | ADS
- Sharp, R. G., McMahon, R. G., Irwin, M. J., Hodgkin, S. T., 2001, astro-ph/0103079. Citation in text | LANL
- Stern, D., Spinrad, H., Eisenhardt, P., Bunker, A. J., Dawson, S., Stanford, S. A., Elston, R., 2000, ApJ, 533, L75. Citation in text | ADS
- Warren, S. J., Hewett, P. C., Osmer, P. S., 1994, ApJ, 421, 412. Citation in text | ADS
- Zheng, W. et al., 2000, AJ, 120, 1607. Citation in text | ADS
| THE ING NEWSLETTER | No. 4, March 2001 |
|
|
THE ING WIDE FIELD IMAGING SURVEY | SCIENCE |
|
|
|
| Previous: | The Second Round of Wide Field Survey Observations | Up: | Table of Contents | Next: | Scientific Impact of Large Telescopes |
Other available formats: PDF | gzipped Postscript
High Redshift Quasars in the ING Wide Field Survey
Robert Sharp, Simon Hodgkin, Richard McMahon and Mike Irwin (Institute of Astronomy)
The 2.5m Isaac Newton Telescope (INT) is currently being used to carry out a series of wide field imaging programs under the generic title of the ING Wide Field Survey (WFS) project (McMahon et al., 2000; http://www.ing.iac.es/ Astronomy/science/wfs/). The Wide Field Camera on the INT consists of a mosaic of four EEV 2k×4k CCD detectors and covers ~0.29 deg2 of sky per exposure with a pixel size of 0.33''.
The largest of the survey programs is the Wide Angle Survey which aims to observe 100 deg2 in a filter set analogous to that used by the Sloan Digital Sky Survey (SDSS u', g', r', i', z' filters). Some of the survey fields are equatorial to enable complementary observations from telescopes in both hemispheres. All of the survey regions are associated with projects at other wavelengths such as the VLA FIRST radio survey, ISO ELAIS mid-IR and CIRSI near-IR programs, regions from the 2dF redshift survey and XMM X-ray survey fields.
Using an exposure time of 10 minutes
per filter the INT WFC reaches 5-
limiting magnitudes in URGO, g', r', i' and ZRGO of approximately
23, 25, 24, 23 and 22 respectively; bridging the gap between large area
shallow surveys such as SDSS (the INT survey goes 2 magnitudes deeper)
and deep narrow beam observations such as HDF and the WHT Deep Field (Metcalfe,
Shanks and Fong, 2000).
The mosaic data from all survey runs is pipeline processed in Cambridge (Irwin and Lewis, 2000; http://www.ast.cam.ac.uk/wfcsur/) and involves the following operations: bias-correction and trimming; non-linearity correction; flat fielding and gain correction; defringing; object catalogue generation; astrometric and photometric calibration; morphological classification of the detected objects; and merging of the object lists from different passbands. A provisional photometric calibration has been applied to the data to the ±0.05 magnitude level. An improved calibration, making use of overlap regions between adjacent survey pointings, is in preparation.
Hunting for Quasars
For a z=5 quasar, the rest frame
ultra-violet emission is observed at optical wavelengths (see Figure
1). Forests of neutral hydrogen clouds along the line of sight
to the quasar depress the quasar flux blueward of the Lyman- emission due to resonant Lyman-
absorption. At shorter wavelengths still, the effect of the Lyman series
limit (rest frame 912Å) for sufficiently dense absorbing clouds causes
the line of sight to the quasar to become virtually opaque to observations
made in a band bluer than the wavelength of the redshifted Lyman series
limit.
emission due to resonant Lyman-
absorption. At shorter wavelengths still, the effect of the Lyman series
limit (rest frame 912Å) for sufficiently dense absorbing clouds causes
the line of sight to the quasar to become virtually opaque to observations
made in a band bluer than the wavelength of the redshifted Lyman series
limit.
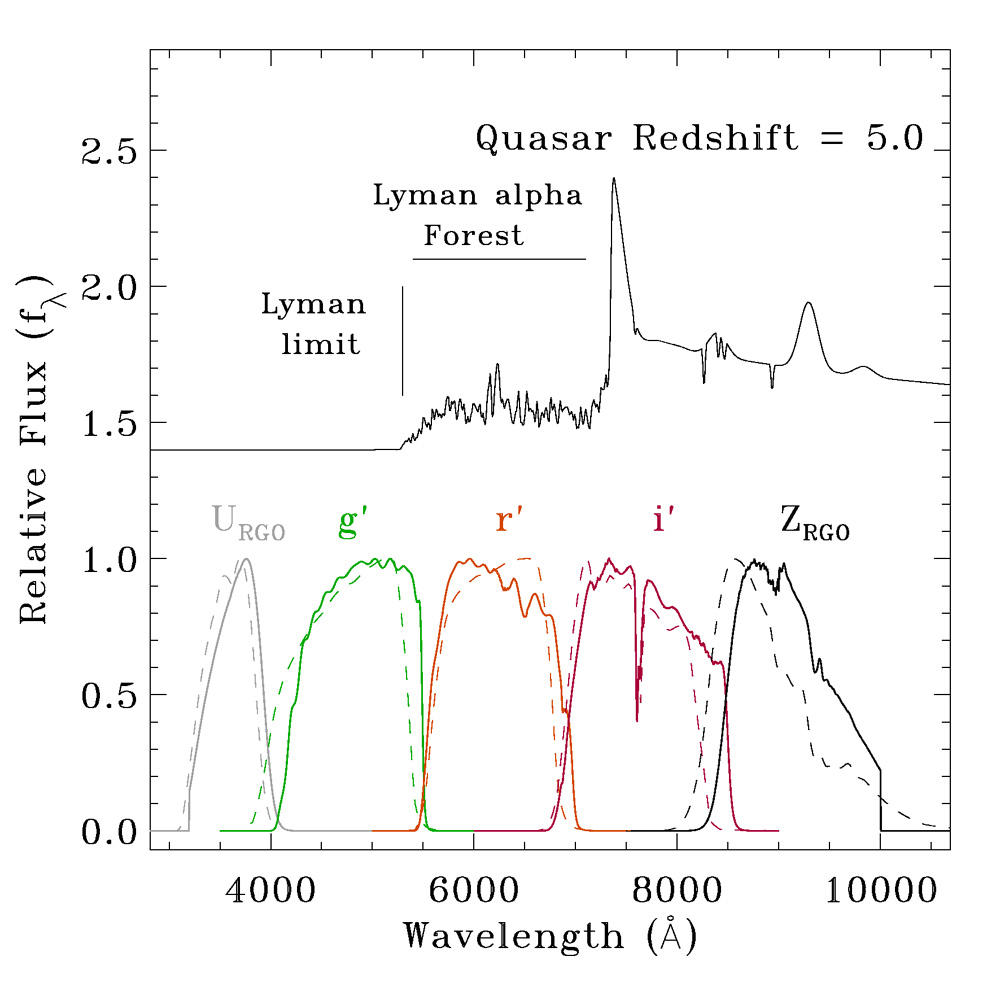 |
| Figure 1. By using a parameterization
of the absorption of the intergalactic medium, the colours of high redshift
quasars can be simulated to predict which regions of colour space should
be searched for quasar candidates. At redshift z=5 the Lyman-
emission line (strong in almost all quasar spectra) is in the i' pass band
and the Lyman- forest suppresses
the r' band. The object will generally be absent from g' and u' band images.
Normalized survey filter responses are also shown; Solid lines INT filter
set; dashed lines SDSS filter set. A representative CCD response function
and atmospheric transparency are included in the filter responses. [ JPEG
| TIFF ] |
The strategy for finding a z=5
quasar is therefore to search for point sources which are absent in u'
and g' images (due to the Lyman series limit), with a large r' i' colour
(suppression of the r' band by the Lyman-
forest) and fairly neutral i'z' colour (very cool stars and brown dwarfs
can generally be distinguished from quasars on the basis of a much redder
i'z' colour).
An area of 12 square degrees was
selected from the survey data taken between August 1998 and October 1999
which satisfied the following requirements:
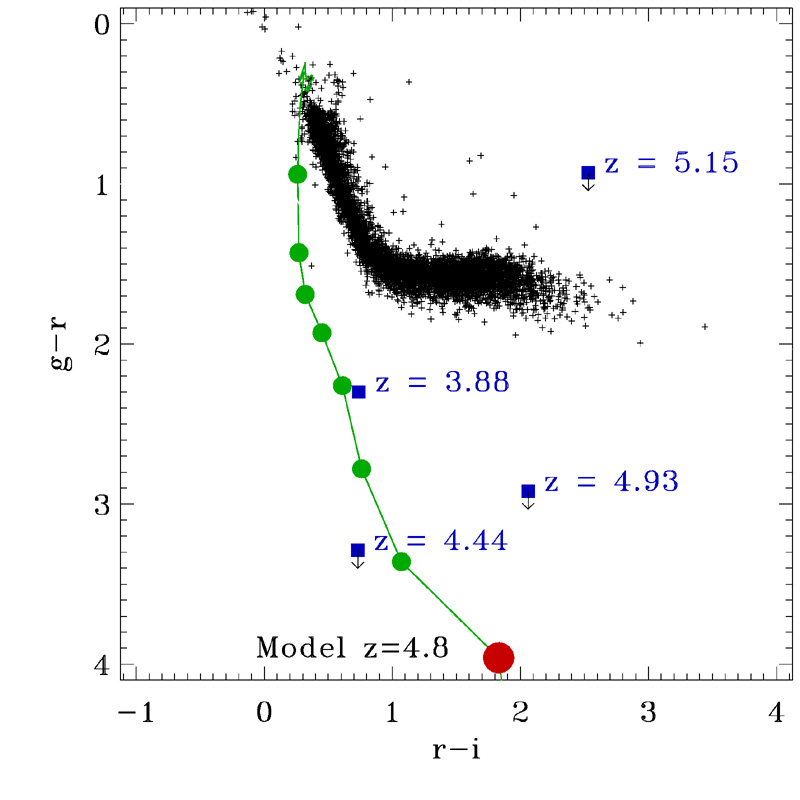
Figure
2 shows colour-colour diagrams from INT survey data. Synthetic quasar
sequences illustrate how these objects sit apart from the stellar locus.
Candidate quasars were selected from these diagrams for spectroscopic follow-up
on the William Herschel Telescope.
 |
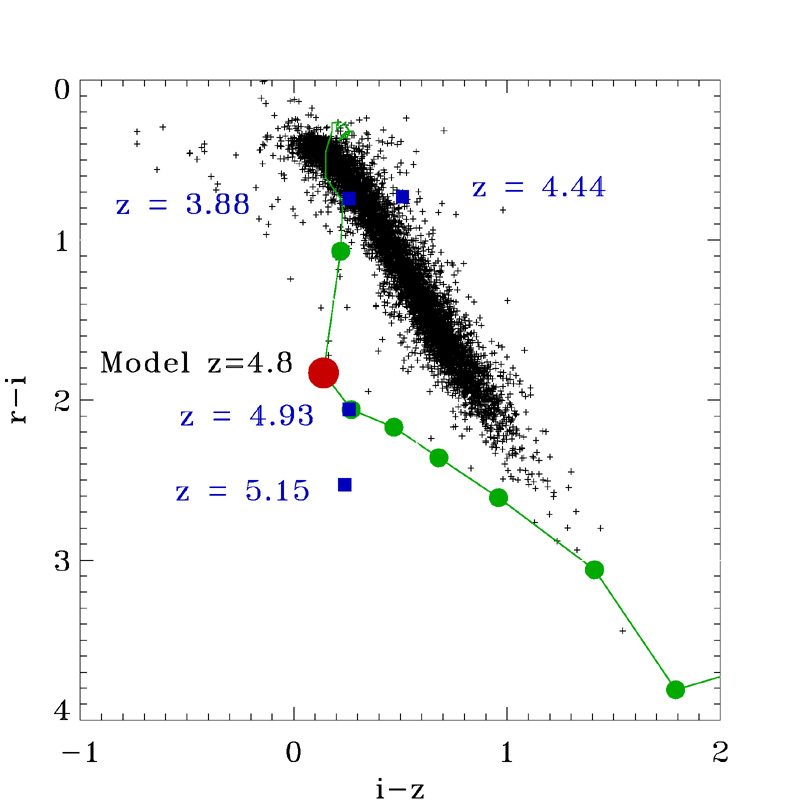 |
| Figure 2. Candidate objects are selected for follow-up observation based on their position in colour-colour diagrams. The main sequence stellar locus is clearly visible in this compilation of high galactic latitude fields observed as part of the INT WFS. Using data from all available pass bands (and investigating three and four dimensional colour spaces) reduces the rate of miss identification due to photometric errors. The inclusion of near IR J or H band photometry aids the separation of quasar candidates from low luminosity M and L dwarfs which are common even in high galactic latitude fields. The four high redshift quasars currently identified in the survey are shown as squares. The three highest redshift objects are not detected in the g' band and are shown as upper limits. A model quasar colour evolution track is overlayed. The circular divisions mark redshift steps of 0.2 from the labeled z=4.8 position. [ JPEG1 | TIFF1 | JPEG2 | TIFF2 ] | |
The current sample has been selected with a quasar candidate magnitude limit of i' or z'>>21. This limit was chosen to allow useful signal-to-noise spectra to be taken with a 4m-class telescope in 1800 seconds of observation.
WHT Spectroscopic Follow-up
Follow-up observations with the WHT and the ISIS spectrograph were undertaken in June 2000 (Sharp, McMahon, Irwin, Hodgkin in preparation). Only the red arm of the ISIS spectrograph was used as all candidates show very little flux in the bluer passbands. With the R158R grating and the TeK4 CCD the spectral resolution is 2.90Å per pixel, and we set up to cover the range 60009000Å.
Between 13×900 second exposures
were taken and data were reduced in real time at the telescope to allow
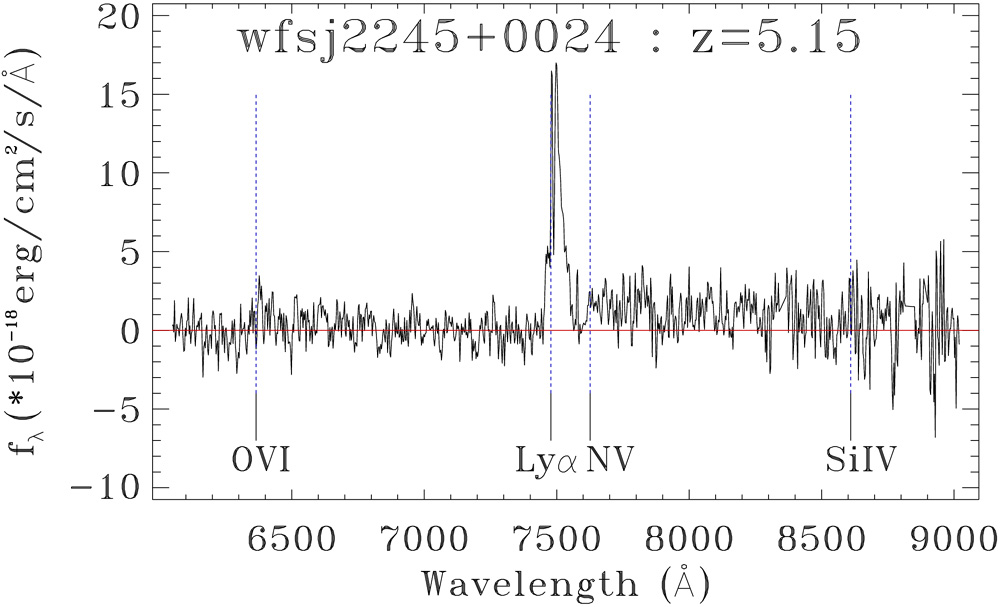
on-line identification of candidates. Four high redshift quasars were identified
during this run, one of which, wfsj2245+0024, is currently the fourth highest
redshift quasar known (see Figure 3).
 |
 |
| Figure 3
(left). At redshift z=5.15,
wfsj2245+0024 is the fourth highest redshift quasar known. It was found
by the contrast between the red r'i' colour and the relatively blue i'z'
colour. The strong emission line is Lyman-
and the obvious continuum break across here confirms the identification
of this object as a high redshift quasar. [ JPEG
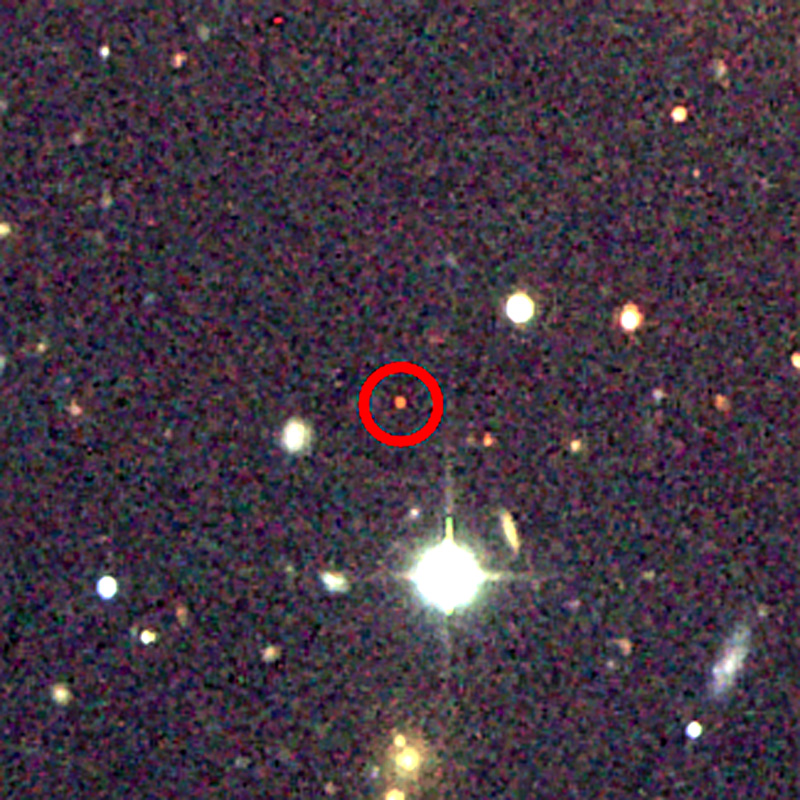
| TIFF ]. Figure 4 (right). A colour composite image of
wsfj2245+0024 made from the INT WFS 600 second exposures in g', r' and
i'. The object was identified as a candidate high redshift (z>5) quasar
by the red colour. [ JPEG | TIFF
] |
|
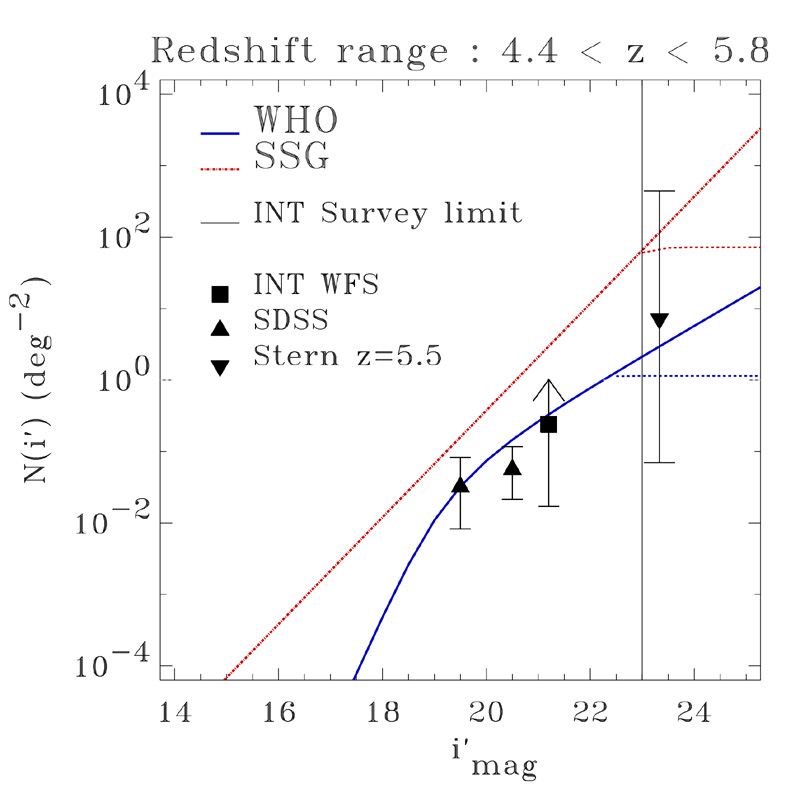 |
| Figure 5. The comparison between two
integrated quasar luminosity functions shows the extent of the current
uncertainty over the redshift range for which the riz selection technique
is sensitive. There is an order of magnitude discrepancy between the
extrapolations of these two parameterizations in the apparent magnitude
range where most of the energy is contributed to the
ionizing background light. SSG Schmidt, Schneider, Gunn, 1995, AJ,110, 68; WHO Warren, Hewett, Osmer, 1994, ApJ, 427, 412. [ JPEG | TIFF ] |
This preliminary study has shown that the ING Wide Field Survey is ideally suited to searching for rare faint objects such as high redshift quasars. The work reported here is now being extended to larger areas.
This will enable us to quantify the quasar luminosity function at high redshift which in turn will allow a fuller understanding of the contribution of quasars to the extra galactic background light and the re-ionization of the Universe. The faint measurements facilitated by the INT WFS are vital as they help to pin down the shape and normalisation of the faint end of the luminosity function. The region where the luminosity function turns over will delineate those objects that contribute most to the of the energy budget of the early universe.
We can extend this work to even
higher redshifts, i.e. by looking for i'-band dropouts. The detection of
even a single quasar at z>6 will allow the Gunn-Peterson measurement to
test current predictions for the onset of re-ionization.
|
|
|
|
|
||
|
|
|
|
|||
| wfsj2245.6+0024 | 5.15 | 23.96 | 21.43 | 21.19 |
|
| wfsj1612.7+5255 | 4.90 | 22.21 | 20.15 | 19.89 |
|
|
|
|||||
| SDSS 10440125 | 5.80 | >22.83 | 21.40 | 18.67 |
|
| RD J0301+0020 | 5.50 | 26.2 | 23.38 | 22.84 |
|
| SDSSp J1208+0010 | 5.27 | 22.66 | 20.37 | 20.17 |
|
| SDSSp J12040021 | 5.03 | 20.72 | 18.89 | 18.56 |
|
| SDSSp J0338+0021 | 5.00 | 21.61 | 19.54 | 19.19 |
|
| SDSSp J16050112 | 4.92 | 22.42 | 19.36 | 19.37 |
|
| SDSSp J02110009 | 4.9 | 21.97 | 19.51 | 19.26 |
|
References:
Email contact: Robert Sharp (rgs@ast.cam.ac.uk)
| Previous: | The Second Round of Wide Field Survey Observations | Up: | Table of Contents | Next: | Scientific Impact of Large Telescopes |
| GENERAL | THE ING WIDE FIELD IMAGING SURVEY | SCIENCE | TELESCOPES AND INSTRUMENTATION | OTHER NEWS FROM ING | TELESCOPE TIME |