- Arnaboldi, M., Capaccioli, M., Douglas, N., Kuijken, K., Freeman, K., Axelrod, T., Taylor, K., Gilmozzi, R., & Kudritzki, R., SAIT Symposium, Naples 1999. Citation in text
- Douglas, N. G. & Taylor, K., 1999, MNRAS, 307, 190. Citation in text | ADS
- Douglas, N. G., Gerssen, J., Kuijken, K., & Merrifield, M. R., 2000, MNRAS, 316, 795. Citation in text | ADS
- Fisher, D., Illingworth, G., & Franx, M., 1995, ApJ, 438, 539. First citation in text | Second citation in text | ADS
- Freeman, K. C., et al., 2000, in ASP Conf. Ser., 197, Dynamics of Galaxies: from the Early Universe to the Present, ed. F. Combes, G. A. Mamon, & V. Charmandaris, (San Francisco: ASP), 389. Citation in text
- Irwin, J. A. & Sarazin, C. L., 1996, ApJ, 471, 683. Citation in text | ADS
- Jacoby, G. H., Ciardullo, R., & Ford, H. C., 1990, ApJ, 356, 332. Citation in text | ADS
- Lee, M. G., Kim, E., & Geisler, G., 1997, AJ, 114, 1824. Citation in text | ADS
- Lee, H., Richer, M. G., & McCall, M. L., 2000, ApJ, 530, L17. Citation in text | ADS
- Monet, D., et al., 1998, The PMM USNO-A2.0 Catalog (Washington, D.C.: U.S. Naval Observatory). Citation in text
- Romanowsky, A. J., & Kochanek, C. S., 2001, ApJ, submitted, astro-ph/0008062. Citation in text | LANL
- Sancisi, R., Thonnard, N., & Ekers, R. D., 1987, ApJ, 315, L39. Citation in text | ADS
- Zepf, S. E., Beasley, M. A., Bridges, T. J., Hanes, D. A., Sharples, R. M., Ashman, K. M., & Geisler, D., 2000, AJ, 120, 2928. First citation in text | Second citation in text | Third citation in text | ADS
| THE ING NEWSLETTER | No. 4, March 2001 |
|
|
THE ING WIDE FIELD IMAGING SURVEY | SCIENCE |
|
|
|
| Previous: | NAOMI Adaptive Optics at the WHT | Up: | Table of Contents | Next: | New WHT Prime Focus Small Fibre Module |
Other available formats: PDF | gzipped Postscript
Extragalactic Planetary Nebula Kinematics with the WHT
Aaron J. Romanowsky1, Nigel G. Douglas1, Magda Arnaboldi2 and Konrad Kuijken1
1: Kapteyn Astronomical Institute; 2: Osservatorio Astronomico di Capodimonte
In
spiral galaxies, the observability to large radii of cold gas disks has
facilitated a general understanding of the distribution of mass in their
outer parts. Elliptical galaxies, being gas poor, are not amenable to this
approach, and other tracers are necessary. The standard approach is to
observe the kinematics of the stars using integrated light spectroscopy.
However, an elliptical's surface brightness drops off rapidly at large
radii, making such observations quite difficult in the outer parts where
any dark matter would become dominant( an effective radius Reff).
One approach especially suitable for elliptical galaxies is to measure the kinematics of bright objects within their outer parts: globular clusters (GCs) and planetary nebulae (PNe). With a suitably large number of measured velocities, and with careful dynamical models, these objects can be used to effectively constrain the mass distribution of ellipticals.
PNe have some advantages over GCs. Primarily, they can be expected to directly represent the underlying bulk stellar population of the galaxy (GCs comprise a disjoint system with quite different properties), and thus their kinematics can be combined with the integrated stellar kinematics in the inner parts to model the galaxy over a large range of radii. Also, PN velocity measurements are more straightforward, as there is simply a strong emission line of [O III] at 5007Å to be observed.
The traditional procedure for obtaining PN kinematics in a galaxy is to locate a sample of PNe using narrow-band imaging, and to subsequently use a multi-object spectrograph to obtain their velocities. This is described in more detail below, in connection with our observations of the galaxy NGC 4472.
But more efficient in many cases is a new technique called counter-dispersed imaging, wherein the detection and velocity measurements of the PNe are combined into one observational step. We are members of a team which is building a specialised instrument to use this technique: the Planetary Nebula Spectrograph, soon to be commissioned at the WHT. This instrument is further described below.
NGC 4472 with AF2/ WYFFOS: Observational Procedures
NGC 4472 (= M49) is a giant elliptical galaxy in the Virgo Cluster which has PN position data already available. The PNe were located using a combination of broad- and narrow-band images of a 16'´×16' field centred on the galaxy, taken by X. Hui at the KPNO Mayall 4-m telescope on 27 March 1995. Point sources which were visible only in the narrow-band image (with a passband at the 5007Å line) were identified as PN candidates. With a small supplement from Jacoby, Ciardullo, & Ford (1990), there were a total of ~200 PN candidates.
We used AF2/WYFFOS on four half-nights,
2528 May 2000, with R. Corradi as support astronomer. WYFFOS is
of course the multi-fibre spectrograph and AF2 is the robotic device which
positions the fibres at the WHT prime focus. We selected the high efficiency
H1800V IDS grating, which gave a reciprocal dispersion of 0.9 Å per
pixel. In general the instrumentation all worked very well, and we obtained
about 10 hours of data on two different fields. There are strong physical
restrictions on AF2's placement of fibres on a centrally-concentrated target
area, so we could use only ~25 of the 100 available science fibres at one
time.
The most important concern in the observational procedure was astrometric
accuracy, an issue which had stymied previous attempts to use multi-slit
and multi-fibre spectrographs to observe PNe at Virgo Cluster distances.
First, the pixel coordinates in the original detection image of the PN
candidates must be converted to RA/Dec for input to AF2. We accomplished
this with IRAF, using reference stars from the USNO-A2.0 catalogue (Monet
et al., 1998). But the number of suitable reference stars (~75) was
insufficient to adequately map the plate distortions of the wide-field
detection image, resulting in astrometric uncertainties of ~2" in the galaxy's
perimeter the most important region for kinematical purposes. We found
by trial-and-error at the telescope that a low-order plate fit was the
best.
Second, AF2 must also be given fiducial stars on which to guide during observations. It is crucial that these fiducial stars are a subset of the reference stars used to determine the PN coordinates. However, the small number of USNO stars in our field that were suitably bright for guiding made it difficult to place enough fiducial fibres. Additionally, the guide fibres typically did not fit well on many of the fiducial stars at once, indicating that there was significant proper motion in the USNO stars.
Despite these difficulties, we
were able to get most of the object fibres positioned to within the tolerances
of their 2.7"-diameters. By placing a fibre in each field on one especially
bright PN candidate (which turned out to be an HII region see below),
we could verify the positioning after a half-hour exposure.
NGC 4472: Results
With most of the data so far analysed,
we have identified 24 PN candidates. There are some rare background objects
that can masquerade as PNe the sure way to determine if an object is
a PNe is by the detection of a second [O III] line at 4959Å, with
a 1:3 flux ratio to the 5007Å line. Since our signal-to-noise ratio
is too low to measure the 4959Å line for most of the objects individually,
we sum the spectra to look at the aggregate line ratio (see Freeman
et al., 2000), and determine that almost all of the candidates are bona
fide PNe. These PNe are spread throughout the galaxy, with galactocentric
radii of 2' 8' = 8 40 kpc = 1 5 Reff (see Figure
1). The overall velocity dispersion of the sample is 299 ± 46
km/s.
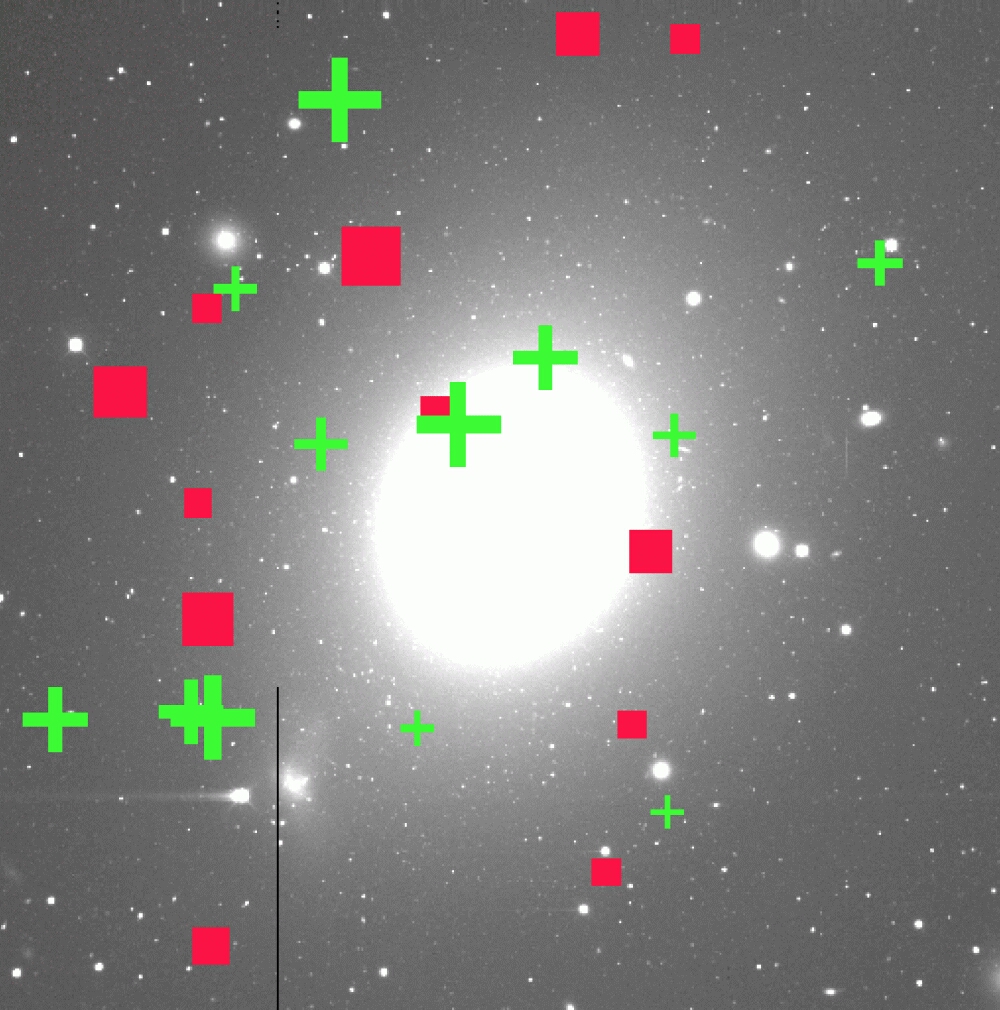 |
Figure 1. Planetary nebula velocities in NGC 4472, relative to a systemic velocity of 977 km/s. Green crosses represent negative velocities, and red boxes represent positive velocities, where the symbol sizes are proportional to the velocities. North is at the top and east at the left. The underlying image is from X. Hui, with a field-of-view of 16'×16'. [ JPEG | TIFF ] |
One feature that is apparent is
that the velocity dispersion is higher (at 95% significance) on one side
of the major axis than on the other (350 ± 63 km/s vs 143 ±
48 km/s; see Figure 2). This is a surprising result
which will require confirmation with more PN velocities. Checking to see
if the same feature appears in the galaxy's system of GCs, which have had
144 velocities measured (Zepf
et al., 2000), we also find a velocity difference at 90% significance
(351 ± 30 km/s vs 262 ± 25 km/s). With these PN data, combined
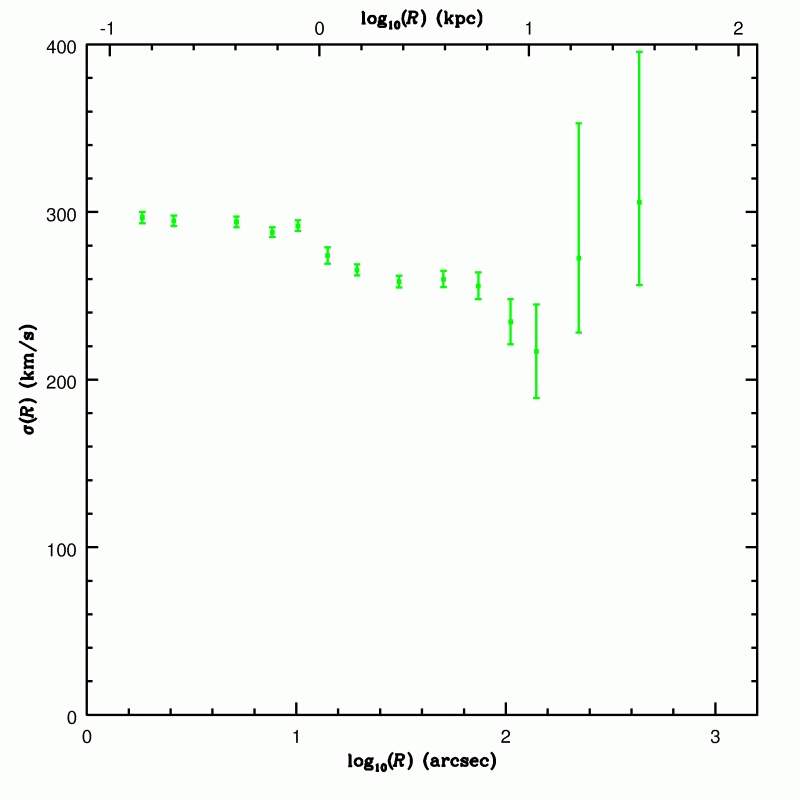
with integrated light spectroscopy from Fisher,
Illingworth, & Franx (1995), we construct a projected velocity
dispersion profile  p(R)
(Figure 3). Although the integrated light spectroscopy
is consistent with a dispersion profile that decreases rapidly outside
10 kpc, the PN data indicate that the dispersion profile either remains
constant, or even rises, through 30 kpc.
p(R)
(Figure 3). Although the integrated light spectroscopy
is consistent with a dispersion profile that decreases rapidly outside
10 kpc, the PN data indicate that the dispersion profile either remains
constant, or even rises, through 30 kpc.
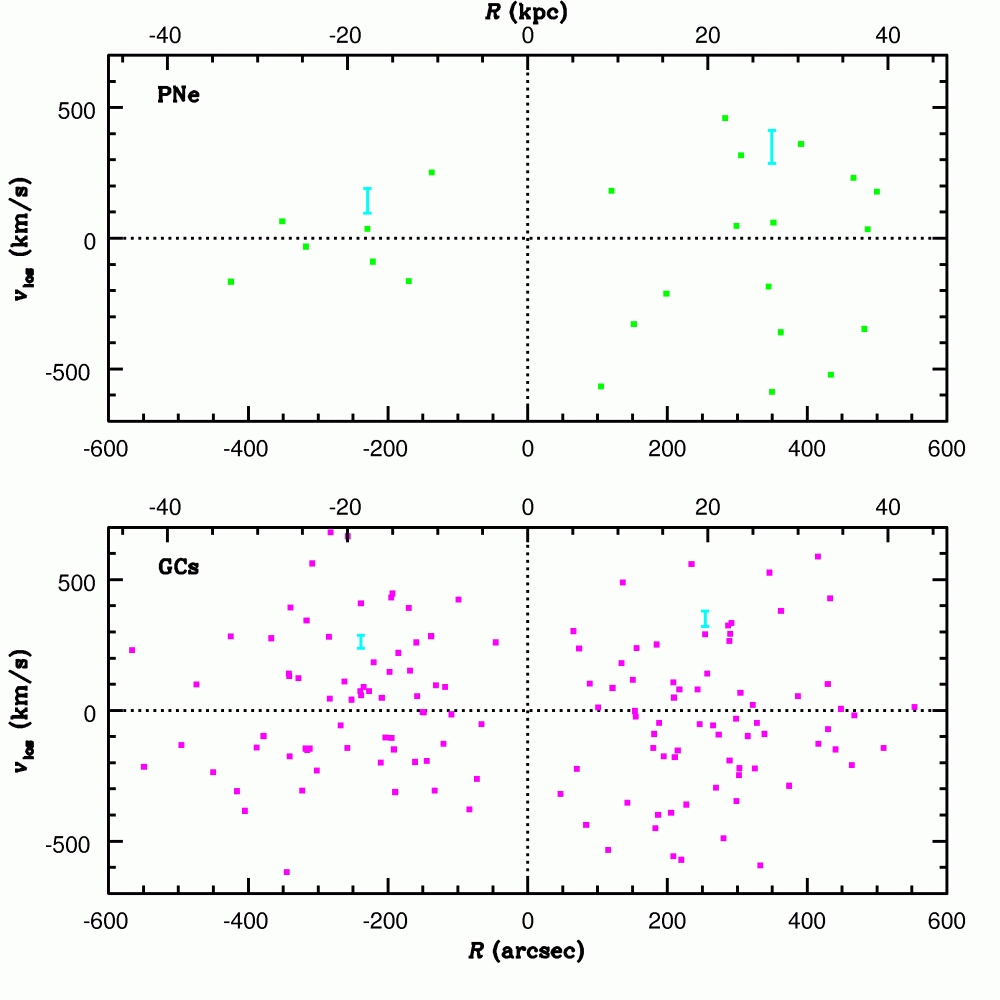 |
Figure 2. Line-of-sight velocities of planetary nebulae (top) and globular clusters (bottom) as a function of radius, relative to the central velocity of NGC 4472. Objects with a positive radius lie on the northeast side of the galaxy's major axis, and those with a negative radius on the southwest side. The overall velocity dispersion on either side is marked with error bars. [ JPEG | TIFF ] |
 |
 |
| Figure 3 (left). Stellar
projected velocity dispersion as a function of radius for NGC 4472, with
1- error bars. The first 12 points
come from the integrated light spectroscopy of Fisher,
Illingworth, & Franx (1995). The last 2 points represent our planetary
nebulae data. [ JPEG | TIFF
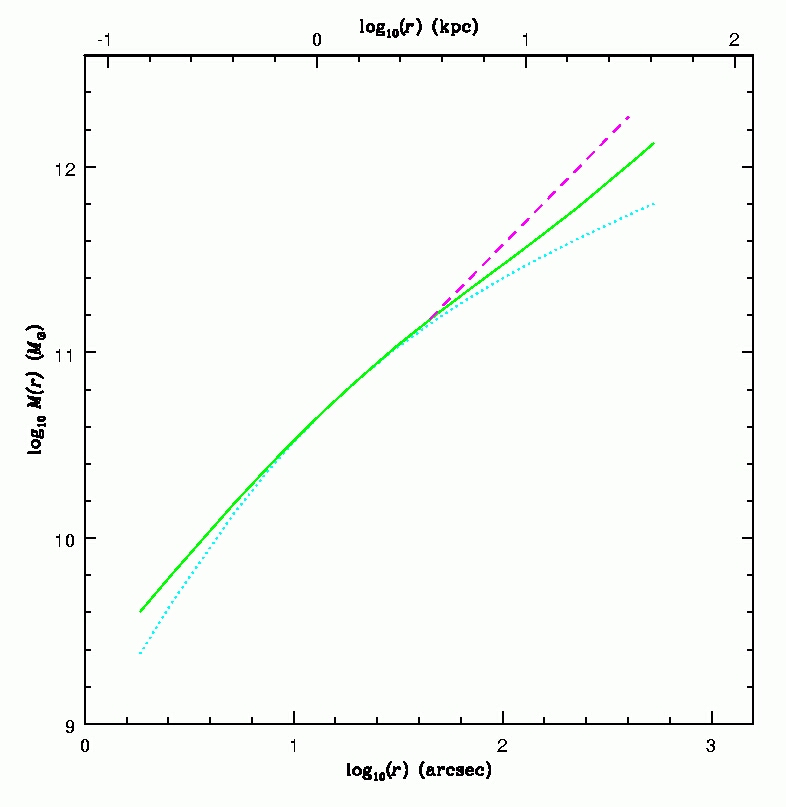
]. Figure 4 (right). Enclosed mass as a function of radius for NGC 4472.
The solid line shows the results derived from the stellar kinematics (integrated
light + planetary nebulae), assuming an isotropic distribution function.
The dashed line shows the results from the globular cluster kinematics,
also assuming isotropy (Zepf
et al., 2000). The dotted line shows a constant mass-to-light ratio
model. [ JPEG | TIFF ] |
|
We next construct a crude dynamical model, using the Jeans equations and assuming an isotropic stellar orbit distribution. We find a mass profile M(r)~r0.9 at 4 40 kpc (see Figure 4). This is a steeper growth curve than for a constant mass-to-light ratio galaxy (~r0.5), suggesting the presence of a dark halo. A similar analysis with GC data yielded M(r) ~r1.1 (Zepf et al., 2000). In the near future we will make a more rigorous analysis of the combined PN and GC data set using the orbit modelling methods of Romanowsky & Kochanek (2001).
We found another interesting
feature serendipitously. One especially bright PN candidate turned out
to be not a PN at all, but an HII region, as indicated by the H line at 4861Å in addition to the [O III] lines at 4959Å and
5007Å. Two other objects that we observed in the same vicinity turned
out to have the same redshift. Thus, these three objects are bright HII
clumps in a contiguous region of gas, of at least 1 kpc in extent surprising,
since such a galaxy should have little gas and star formation. Using SIMBAD,
we discovered that these HII regions are part of a structure which has
been studied on several occasions. They appear to belong to a reservoir
of gas which was somehow stripped out of the nearby dwarf irregular galaxy
UGC 7636 during an interaction with NGC 4472. This structure has been observed
in HI emission (e.g., Sancisi,
Thonnard & Ekers, 1987), X-ray absorption (Irwin
& Sarazin, 1996) and broad-band imaging (Lee,
Kim & Geisler, 1997), and our brightest object was spectroscopically
found to be an HII region (Lee,
Richer & McCall, 2000). We were able to determine highly accurate
velocities for the HII regions, which may help shed light on the past dynamical
history of UGC 7636 and its lost gas cloud.
line at 4861Å in addition to the [O III] lines at 4959Å and
5007Å. Two other objects that we observed in the same vicinity turned
out to have the same redshift. Thus, these three objects are bright HII
clumps in a contiguous region of gas, of at least 1 kpc in extent surprising,
since such a galaxy should have little gas and star formation. Using SIMBAD,
we discovered that these HII regions are part of a structure which has
been studied on several occasions. They appear to belong to a reservoir
of gas which was somehow stripped out of the nearby dwarf irregular galaxy
UGC 7636 during an interaction with NGC 4472. This structure has been observed
in HI emission (e.g., Sancisi,
Thonnard & Ekers, 1987), X-ray absorption (Irwin
& Sarazin, 1996) and broad-band imaging (Lee,
Kim & Geisler, 1997), and our brightest object was spectroscopically
found to be an HII region (Lee,
Richer & McCall, 2000). We were able to determine highly accurate
velocities for the HII regions, which may help shed light on the past dynamical
history of UGC 7636 and its lost gas cloud.
Planetary Nebula Spectrograph
The technique of counter-dispersed imaging was introduced by Douglas & Taylor (1999). A galaxy is simply imaged through a slitless spectrograph tuned to the 5007Å line. When this image is studied, the background light of the galaxy and the images of foreground stars are found to be blurred, but the PNe are instantly recognisable as bright point-like images, due to their powerful emission line at this wavelength. Each PN will be slightly displaced from its true position on the sky by an amount determined by its exact emission wavelength, and hence by its velocity.
A second image is taken in which
the dispersion direction is reversed with respect to the sky. This can
be done sequentially by rotating the PA through 180°, as in Douglas
et al. (2000), or simultaneously using duplicate spectrograph arms
(see Figure 5).
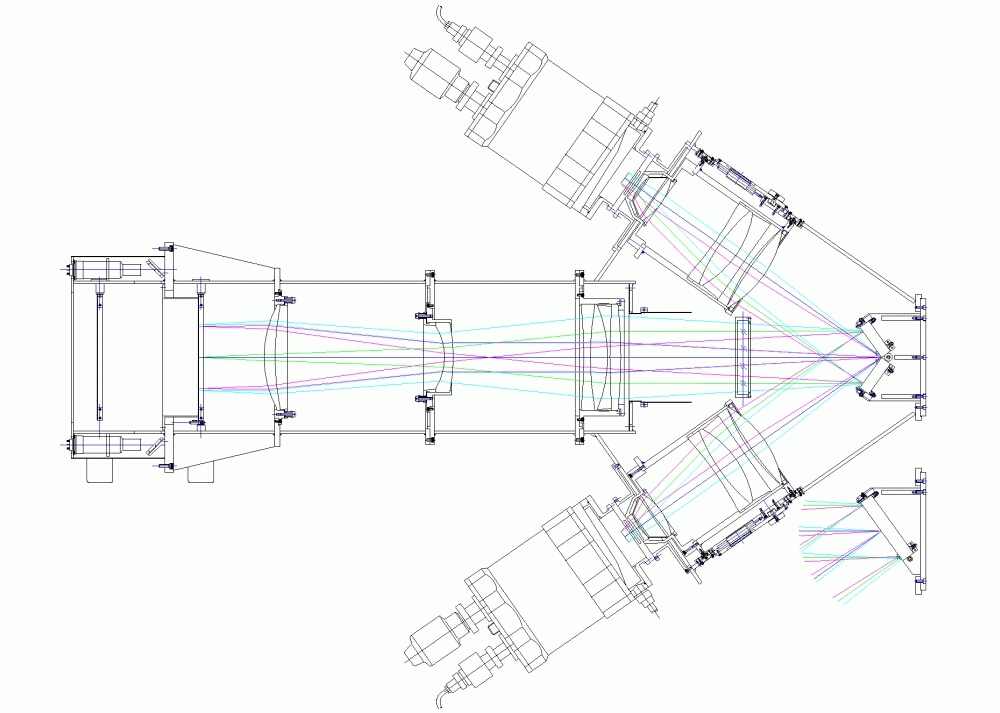 |
| Figure 5. Sketch showing the optical arrangement of the Planetary Nebula Spectrograph. On the right-hand side, a pair of diffraction gratings can be seen to split the light beam into two identical spectrograph arms, each with a different dispersion direction. [ JPEG | TIFF ] |
The PNe seen in the first image will be readily identified in the second, but with the direction of their displacement reversed. Therefore, these two images taken together yield position and velocity, while the brightness can be obtained from either image. So in one night we hope to do as well as, or better than, the traditional procedure does in two or three.
Our first observing programme
will entail the observation of a large sample of nearby elliptical galaxies.
Further information may be found at http://www.aao.gov.au/local/www/pns/pns.html
and the PNS consortium is listed below (Arnaboldi et al., 1999).
We thank Don Pollacco, Renzo Sancisi and Nial Tanvir for useful conversations.
References:
Email contact: Aaron Romanowsky (romanow@astro.rug.nl)
| Previous: | NAOMI Adaptive Optics at the WHT | Up: | Table of Contents | Next: | New WHT Prime Focus Small Fibre Module |
| GENERAL | THE ING WIDE FIELD IMAGING SURVEY | SCIENCE | TELESCOPES AND INSTRUMENTATION | OTHER NEWS FROM ING | TELESCOPE TIME |