 | |||
|
| Home > Public Information > Scientific Highlights > 1993 |
|
in 1993* |
[ SUPERNOVA 1993J | SOLAR SYSTEM | STARS | GALAXIES | OBSERVATIONAL COSMOLOGY | OTHER ]
|
|
||
 On
March 28th 1993, supernova 1993J was discovered in M81. After SN1987A,
this was the closest core-collapse supernova to have occurred this century
and the closest observable from the north. RGO and La Palma astronomers
immediately set in motion an extensive programme of astrometric, photometric
(UVBRI) and low- and high- dispersion spectroscopic monitoring. The INT
spectrum of SN1993J obtained one day after the discovery was the first
recorded anywhere at any wavelength. Early spectra yielded a reliable estimate
of the extinction towards the supernova, enabling a bolometric light curve
to be calculated. Shortly after being collected, data are copied to RGO
in Cambridge where they are reduced on a timescale of a few days. They
are then placed in an on-line archive which can be accessed from anywhere
in the world. In this manner the most comprehensive set of optical photometric
and spectroscopic data is being offered to the community. Over 70 sites
worldwide have availed themselves of this unique facility. On
March 28th 1993, supernova 1993J was discovered in M81. After SN1987A,
this was the closest core-collapse supernova to have occurred this century
and the closest observable from the north. RGO and La Palma astronomers
immediately set in motion an extensive programme of astrometric, photometric
(UVBRI) and low- and high- dispersion spectroscopic monitoring. The INT
spectrum of SN1993J obtained one day after the discovery was the first
recorded anywhere at any wavelength. Early spectra yielded a reliable estimate
of the extinction towards the supernova, enabling a bolometric light curve
to be calculated. Shortly after being collected, data are copied to RGO
in Cambridge where they are reduced on a timescale of a few days. They
are then placed in an on-line archive which can be accessed from anywhere
in the world. In this manner the most comprehensive set of optical photometric
and spectroscopic data is being offered to the community. Over 70 sites
worldwide have availed themselves of this unique facility.
The initial optical rise of the supernova was very rapid, reaching maximum only about 3 days after the explosion date. The presence of hydrogen lines in the spectrum showed that SN1993J was a type II event. Unusually, the UBVRI light curves went through two maxima at 3 and 20 days after the explosion. To study the evolution of the supernova luminosity a bolometric (UV, optical and IR) light curve was derived using La Palma UBVRI photometry plus infrared observations from other observatories. It was shown that the supernova peak luminosity exceeded 2.5 x 10⁹ solar luminosities and the temperature peaked at over 17000K. The supernova cooled rapidly to 8000K, with the photospheric velocity declining from 13000 to 4000 kms-1. The second rise was brought about by the decay energy released from 56Ni created deep in the core of the explosion. The decay energy diffused (and mixed) upwards, eventually meeting the recombination wave which was moving inwards with respect to the ejecta. The rapid initial decline of the light curve and the speed with which it went into the second rise implies that at the time of the explosion, the progenitor must have been a relatively low mass for a type II explosion. The hydrogen envelope was probably less than 0.5 solar masses and the helium mantle could not have been larger than about 4 solar masses. This, in turn, implies the progenitor mass was about 15 solar masses on the main sequence, including about 10 solar masses of hydrogen. Thus, as the progenitor evolved, it must have lost about 10 solar masses of its envelope. The most likely mechanism for this mass loss is via mass transfer to a close companion. Indeed the transfer may have become so rapid that a common envelope, extending as far as one light year, might have been generated. Thus the picture of the supernova progenitor which has developed is a K supergiant which, by the time it exploded, had been stripped of most of its hydrogen envelope due to mass loss onto a companion blue supergiant. Among the evidence that SN1993J does indeed have an extended envelope released before the explosion is the observation of very narrow optical emission lines in the early spectra. These lines are caused by ionisation of a progenitor wind by the extreme ultraviolet flash from the supernova, followed by its recombination. In addition, near infrared photometry, when compared with ING optical photometry, reveals the development of an infrared excess since about day 50. The most plausible explanation is an infrared echo, ie the re-radiation of the supernova light released near maximum by dust in the progenitor wind lying some light months from the supernova By day 50, the bolometric light curve was falling exponentially with a e-folding time of 54 days. There was no observed slowdown for a long period. This is quite different from the behaviour of SN1987A where there was a period of 100 days in which the bolometric light curve slowed to match the radioactive decay (with an e-folding time of 111 days). This also points to a low mass in SN1993J: as early as day 50 a significant and increasing fraction of the gamma rays from the 56Ni must have been escaping. About a month after the explosion, the SN1993J spectrum appeared less and less like that of a type II event. Helium, oxygen and calcium lines increased in prominence, suggesting that the supernova was changing into a type Ib event. Supernova of type Ib form a rather mysterious subclass thought to arise from massive progenitors which have lost their hydrogen envelopes. More ING spectra, obtained when the supernova was about 300 days old, confirm its metamorphosis into a type Ib. SN1993J may be a kind of missing link between type II and type Ib. It suggests that rather than there being discrete sub-types of core collapse supernovae, there is in fact a continuum of progenitors with a range of hydrogen envelope masses. During the first few nights following
the discovery of supernova 1993J, researchers observed the interstellar
Ca II and Na I absorption lines in its spectrum at high spatial resolution
(FWHM ~ 5-6 kms-1) using the Utrecht Echelle
Spectrograph on the WHT. They found a crowd of absorption components in
the radial velocity range between -135 and +165 kms-1.
In order to understand the features, the group re-examined previous surveys
of local interstellar gas, high velocity gas and intergalactic gas in the
field. They also observed the line of sight to the supernova at 21cm using
the 100m radio telescope at Effelsberg. The components between -85 and
-165 kms-1 originate in intergalactic gas
within the M81 group of galaxies which has been tidally pulled from one
of the galaxies in the group. Components at -135 and -119 kms-1
originate within M81, indicating that the supernova is embedded in the
inner region of the galaxy. The remaining components arise in our own galaxy,
including the halo.
|
||
|
|
||
|
||
| More
information
ING facilities involved:
|
SATURN
| More
information
ING facilities involved:
|
POST-AGB STARS
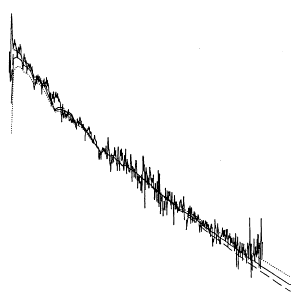 Most
stars pass through a brief evolutionary phase towards the end of their
lifetimes known as the post-asymptotic giant branch or post-AGB. Lasting
10000 years or less, this is one of the shortest and least-well understood
stages of stellar evolution. However, many of these stars reveal anomalous
chemical compositions that cannot be understood in terms of the nucleosynthesis
and dredge-up processes that occur on the AGB. Researchers used the UES
on the WHT to obtain complete spectral coverage in the wavelength range
3850-4950Å of the hot post-AGB star Barnard 29 in the globular cluster
M13. A typical metallicity of -1.64 ± 0.11 dex was derived, in agreement
with the mean [Fe/H] value from previous M13 studies. More importantly,
carbon is depleted by more than 2.0 dex, and nitrogen is enhanced. This
result establishes the existence of a class of carbon-poor post-AGB objects
which have undergone the first and second dredge-ups but have left the
AGB before the onset of the third dredge-up in which carbon is brought
to the stellar surface.
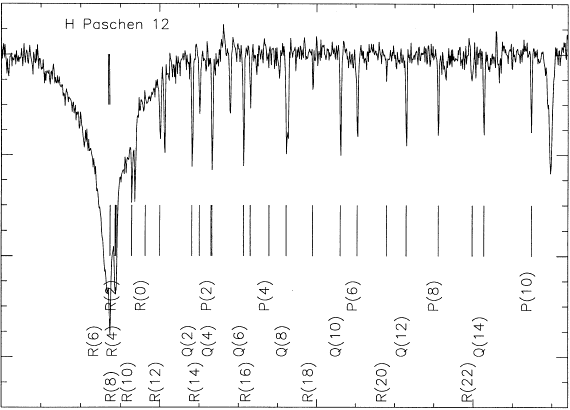 Other
researchers observed the post-AGB star HD56126 also with the UES on the
WHT using two different grating settings covering the wavelength range
4380-10410Å. The spectrum is rich in absorption lines from s-process
elements such as zirconium, ytrium and lanthanum which are brought to the
stellar surface by dredge-up. This confirms the post-AGB nature of the
star. But the most important and unexpected result was the detection of
diatomic carbon C2 and CN absorption lines
in the optical spectrum. A study of these lines shows that they are formed
in the AGB remnant. This is the first time that molecular lines from an
AGB remnant have been detected in absorption at optical wavelengths. A
comparison of the expansion velocity of optical molecular lines with the
submillimetre data allows a new field of study of the asymmetry of the
AGB remnant. The UES is ideal for this kind of study because of its large
wavelength coverage.
| More
information
ING facilities involved:
|
H II REGIONS
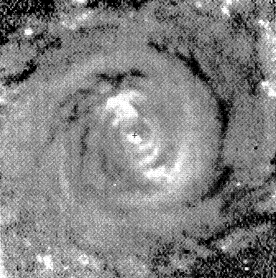 Two
TAURUS H alpha data cubes were taken in May 1987 of the inner ring of bright
HII regions in the nearby galaxy NGC4736 (M94) have been reduced, combined
and analysed. This ring is of particular interest for the dynamics of galaxies,
as it shows mild yet significant deviations from circular rotation, indicating
either bulk streaming motions or a tilt with respect to the 'normal disk'
of the galaxy.
The spatial resolution of the
data, sampled in fully three dimensions, is unprecedented. It allows detailed
analysis of the gas morphology and kinematics. The inclination and major
axis position angle were derived from the morphology of the H II distribution
and from the kinematics, which also allowed the determination of the kiematic
centre position, the systematic velocity, and the rotation velocity of
the gas in the ring as a function of radius. Subtraction of a model velocity
field, constructed using parameter values found from the kinematics, confirms
the presence of velocities deviating significantly from circular rotation
in the south-eastern quadrant of the ring, as found by earlier workers.
| More
information
ING facilities involved:
|
LYMAN GALAXIES
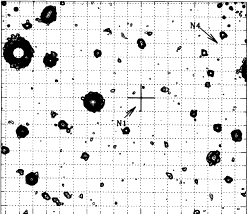 When
absorbing material with a sufficiently high hydrogen column density is
located in front of a distant QSO (as viewed from the Earth), a very pronounced
discontinuity is produced in the spectrum of the QSO near 912Å, the
Lyman limit, in the rest frame of the absorber. the identification of galaxies
responsible for such absorption systems leads to a wealth of information
about the distribution and evolution of galaxies at high redshift. Researchers
have used the WHT to extend this work to galaxies producing Lyman limit
systems at z=3. Such galaxies are expected to have a nearly flat continua
longwards of the Lyman break, and to be undetectable shortwards of the
break because of intrinsic and intervening absorption by neutral hydrogen.
They can thus be recognised in deep images taken through appropriately
chosen filters, one of which includes the region below the Lyman limit.
At
z=3 this region is redshifted into the observable U band and ultra deep
imaging in U is therefore the key to successful identification. The Tektronix
chip at the auxiliary port of the WHT is ideal for this work because of
the combination of good seeing, fine spatial sampling and high sensitivity.
This programme has been highly successful. In all four fields imaged so
far there is an object close to the sight line with the colours expected
for a galaxy at the redshift of the QSO absorber. Such objects are therefore
the most likely candidates identified so far for 'normal' galaxies at z=3;
they have luminosities typical of a large spiral. The projected separations
from the QSO sight line and therefore their approximate dimensions, are
about 10 - 20 kpc.
 | More
information
ING facilities involved:
|
OTHER HIGHLIGHTS
Researchers obtained CCD photometry of a sample of galaxies to investigate the colours and colour gradients in the bulges. Results indicated that half the bulges an intermediate age population was present.
All three ING telescopes were used to study a recently identified X-ray transient and preliminary results have shown that the compact object could be a black hole with a mass greater than 3.9 solar masses.
The cataclysmic variable UX
Uma was observed using the INT Faint Object Spectrograph and results were
in qualitative agreement with basic models for accretion disks.

