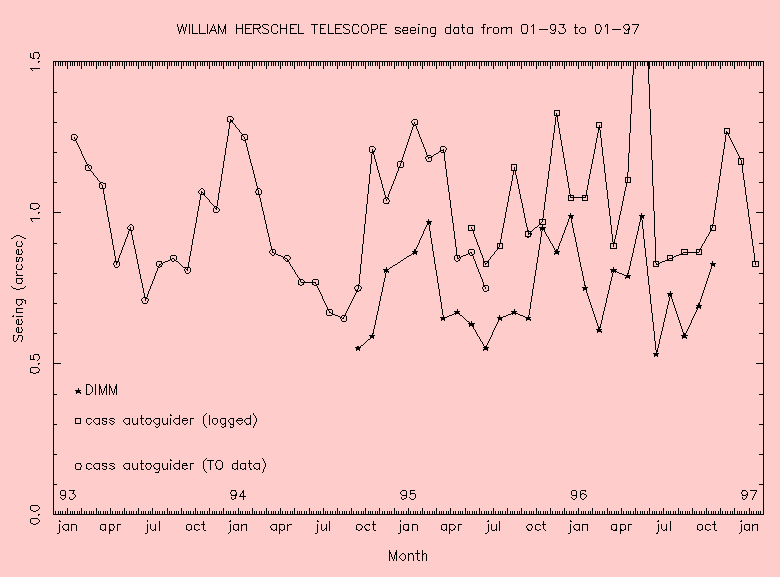
The figure below shows the seeing measured by the WHT cassegrain autoguider and the DIMM for the period from January 1993 to January 1997. The values shown are medians for the month. We operate the system on average for just less than half the nights of the month - even fewer in winter where bad weather makes operation of the DIMM in particular quite difficult. Let us call the difference between the two curves (WHT - DIMM) the 'seeing deficit'.

Both DIMM and autoguider show a marked seasonal variation. The DIMM's best monthly median seeing of 0.55 arcsec was in June 1995. In winter the DIMM seeing is worse and the monthly median approaches 1.0 arcsec. Excellent seeing was obtained at the WHT during July and August 1994 when the telescope operators recorded a median value of 0.65 arcsec. Scatter of the points from a smooth line is largely associated with statistical errors of the limited data set. We estimate the standard deviation of the daily median seeing to be about 0.4 arcsec.
The increase in WHT seeing that we have observed during the winter months is a reflection of an increase in natural seeing. Indeed what surprised us is that the seeing deficit appears to be constant, within statistical error, throughout the year and not dependent on differences in thermal conditions between summer and winter, as we originally imagined.
However, during 1996 the seasonal variation is greatly disturbed by the good seeing in Feb-Apr followed by bad seeing (worst monthly average on the WHT) in May last year. How much this may be due to poor sampling has yet to be established. Yet the trends are similar in both DIMM and WHT. The DIMM was decomissioned in November 1996. The seasonal trend continues to be bucked by January 1997's results. Clearly this requires further investigation.

The above plot was a useful exercise because the seeing for a given month can be compared from year to year and the envelope of variation is shown. It also reveals the asymmetric nature of the yearly trend with respect to civil time: the seeing cycle corresponds with the PATT semester system, beginning in February! Seeing seems to improve slowly over the first 7 months to reach an envelope minimum in July/August, then quicky disimproves by November, before apparently levelling off for Jan/Dec. Curiously this mirrors the time behaviour on the much shorter scale of one night. A 1996 IAC preprint by Muñoz-Tuñón and Varela shows how seeing improves much more slowly than it disimproves. Although it may be due to completely different physical causes, this is consistent with the nature of atmopheric seeing as a chaotic variable: similarity on different scales.
There's no glaring difference between manually and automatically logged data, though the latter may be more variable. At present I am investigating the quality of sampling of this data.