


Previous: Catalogue format
Up: No Title
Next: Filter throughput
Previous Page: Example
Next Page: Filter throughput
Previous: Catalogue format
Up: No Title
Next: Filter throughput
Previous Page: Example
Next Page: Filter throughput

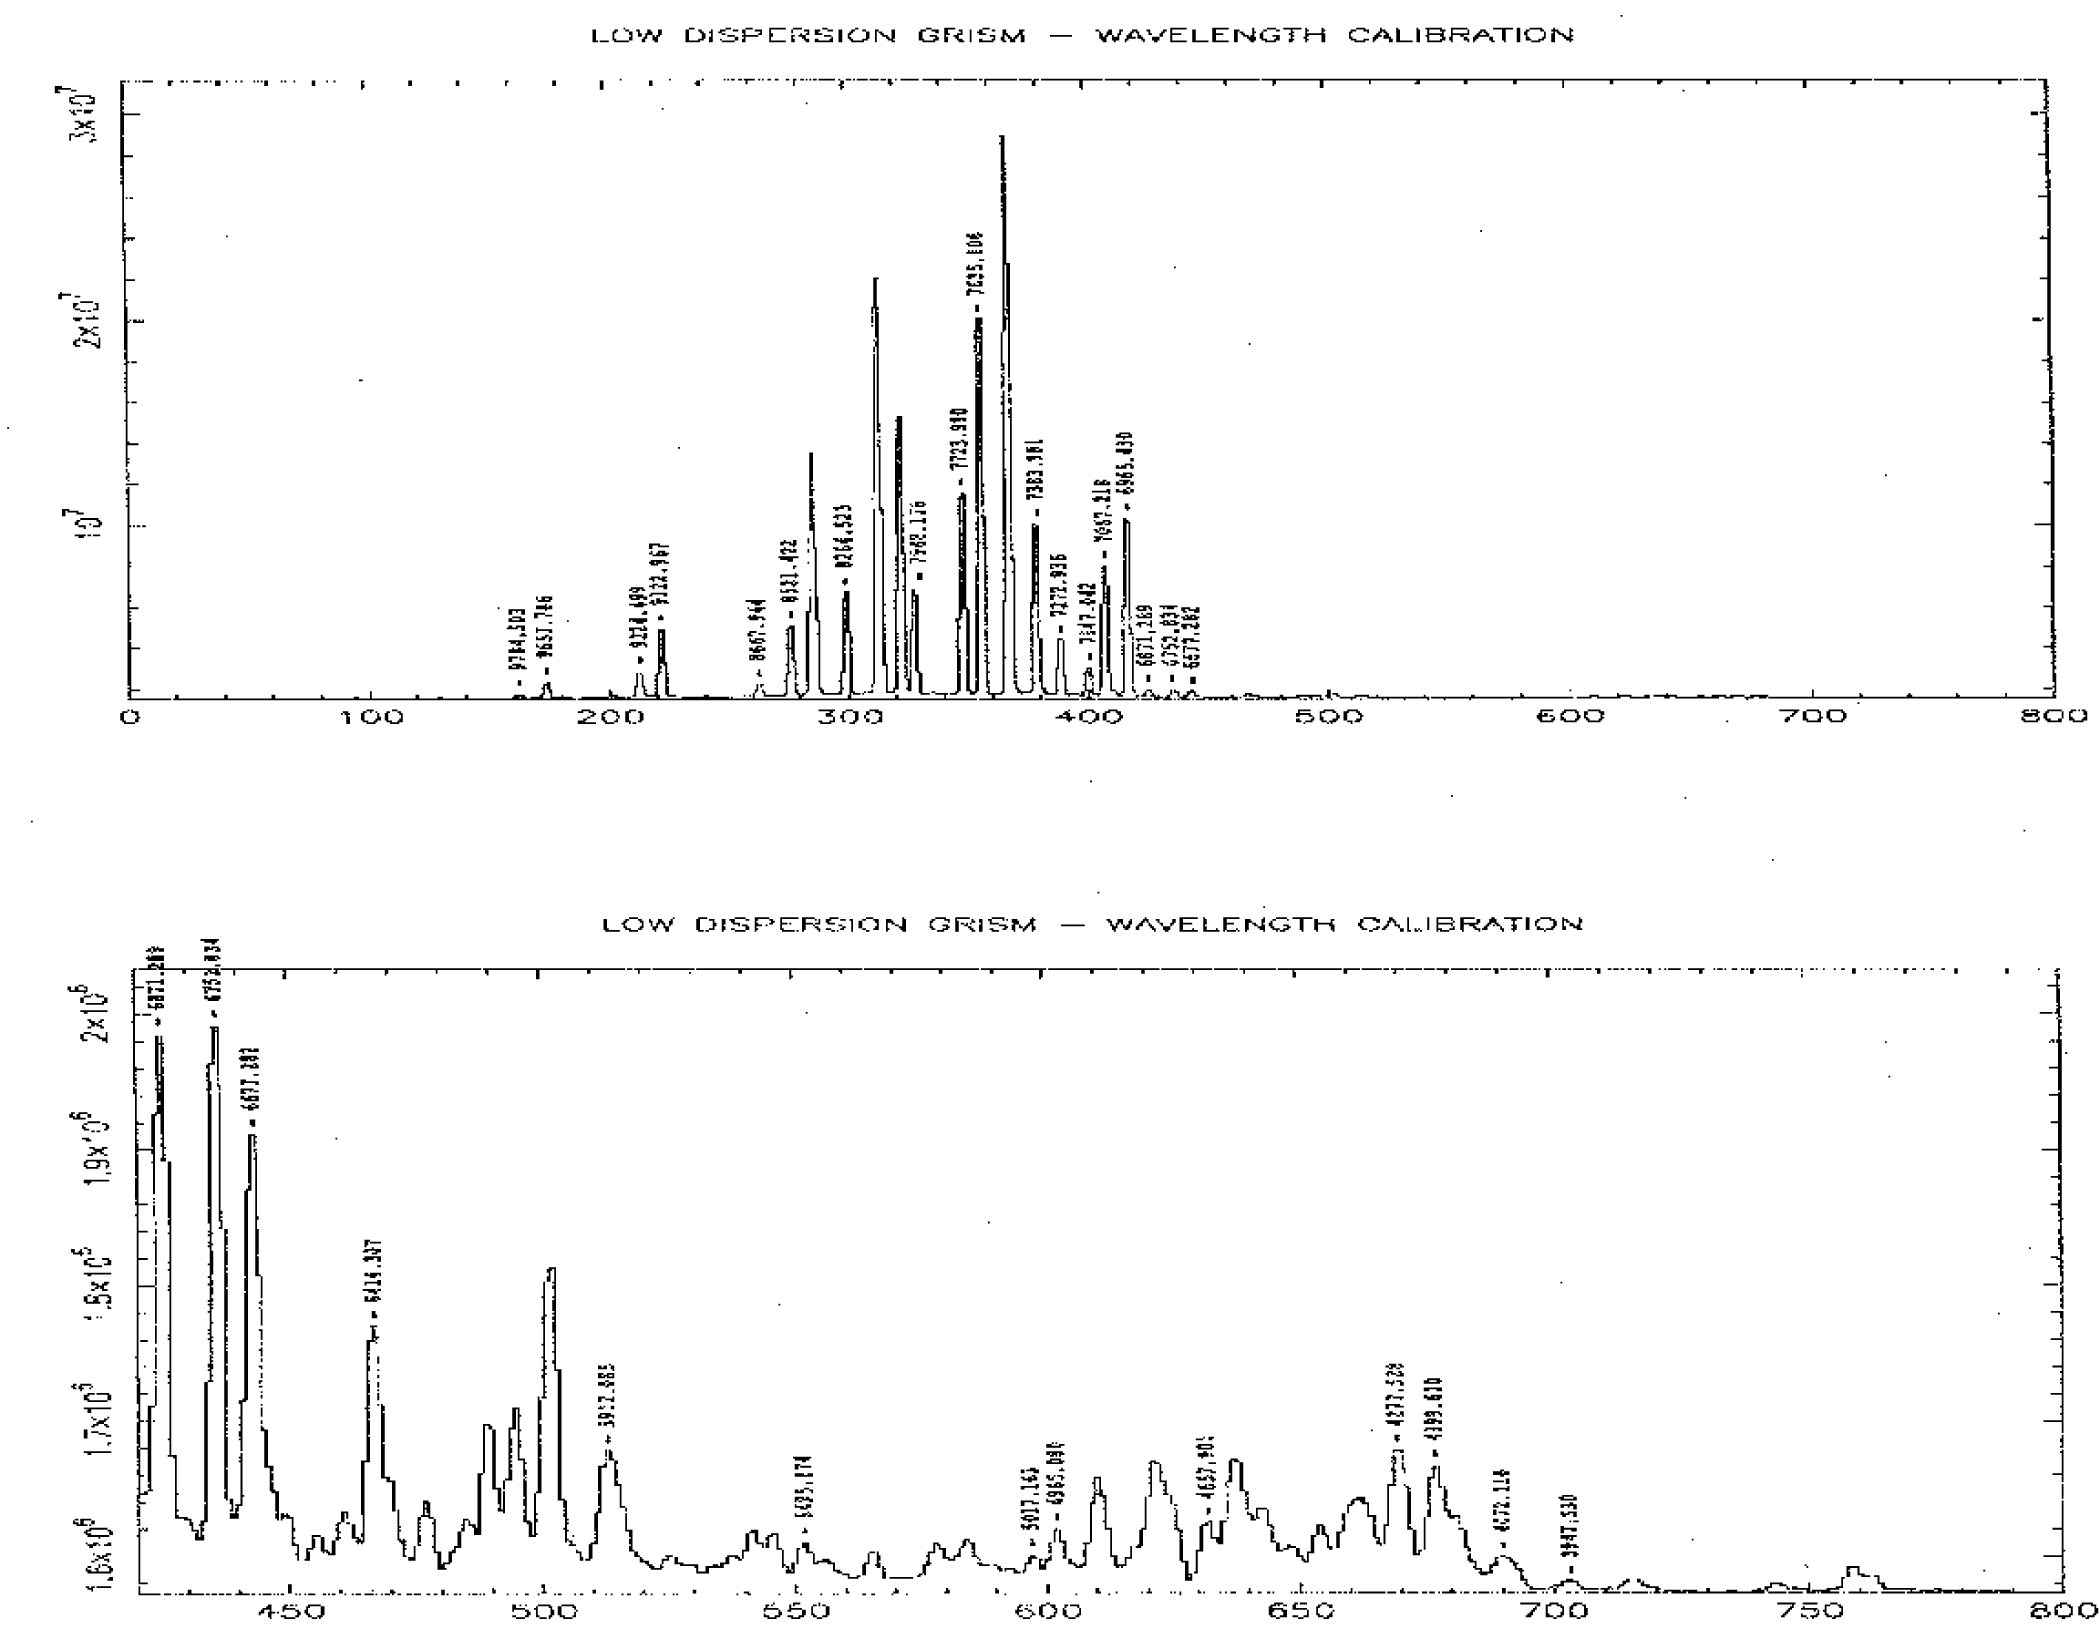
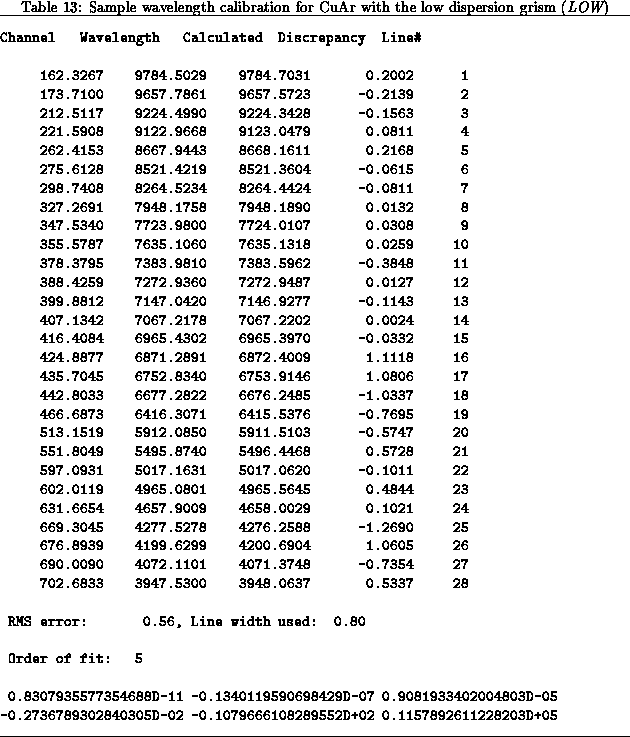
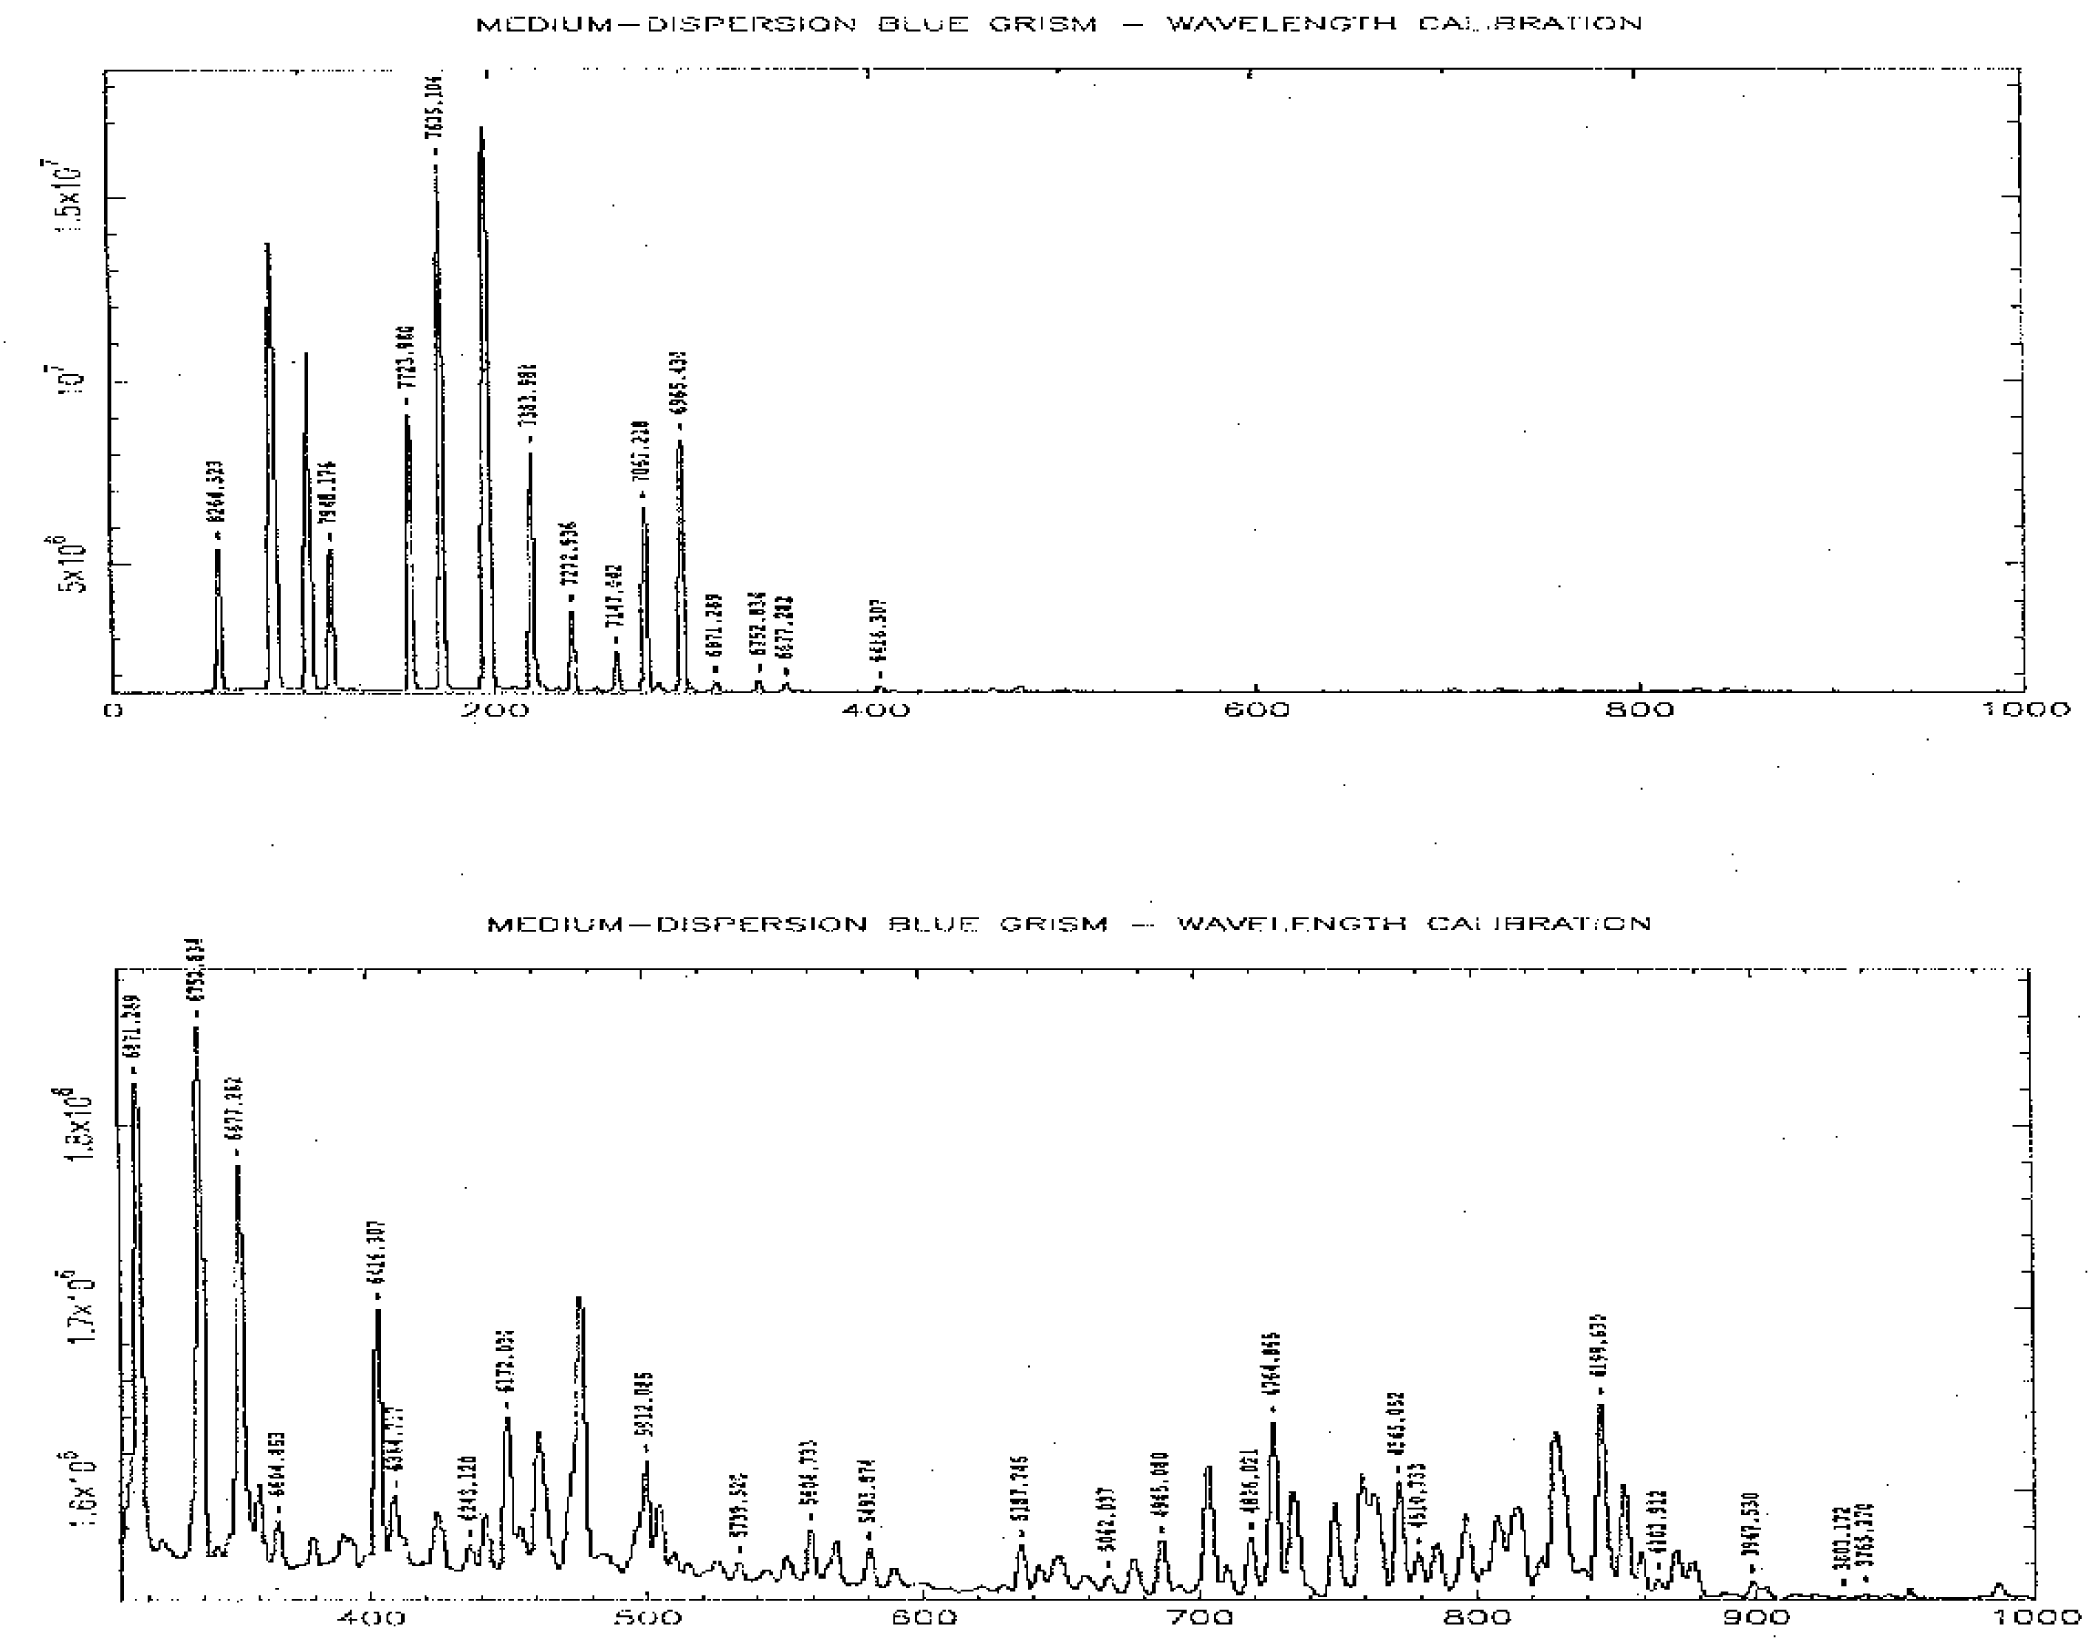
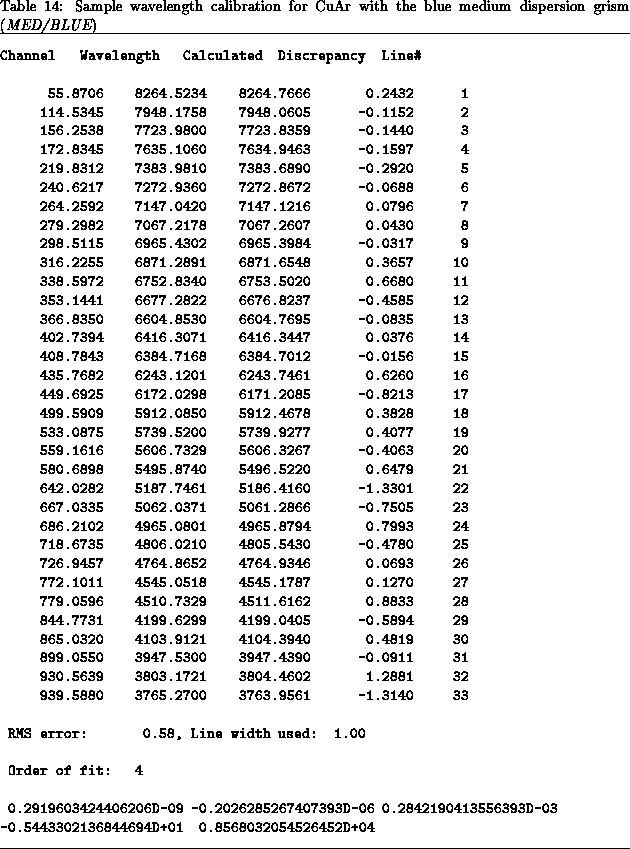
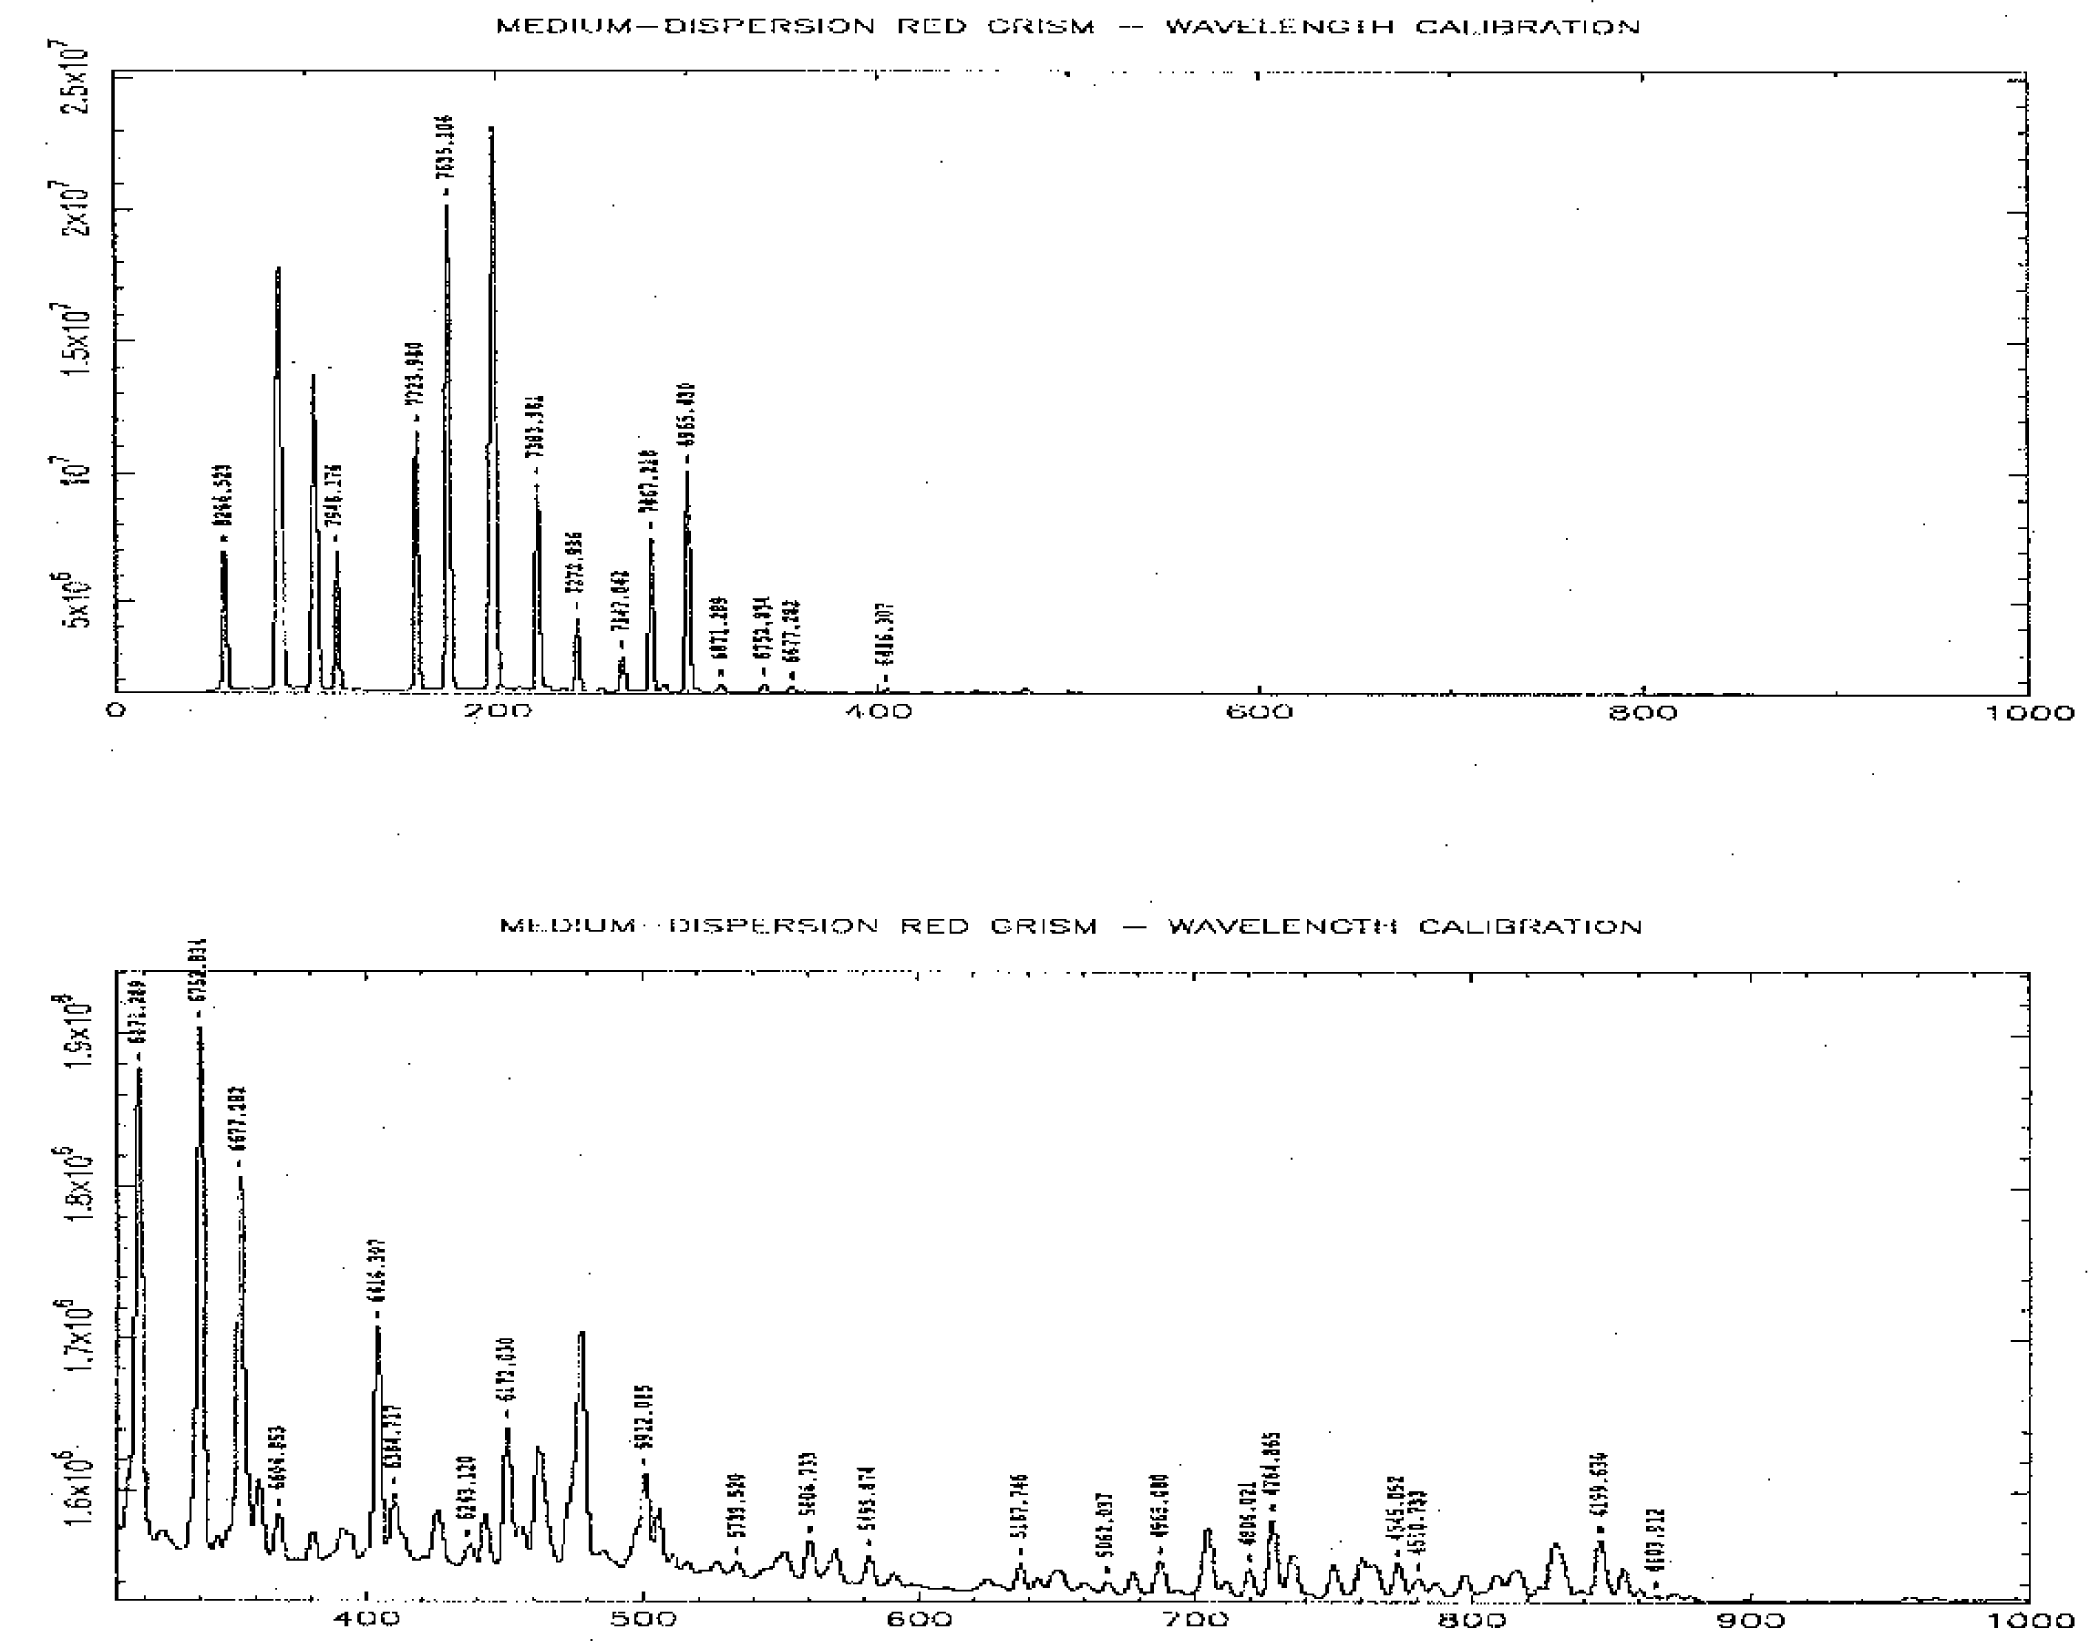
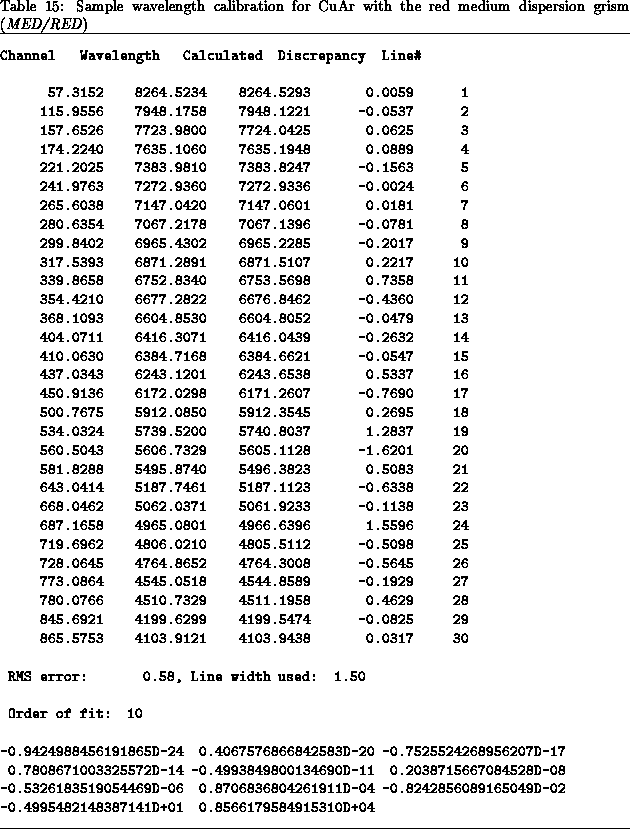
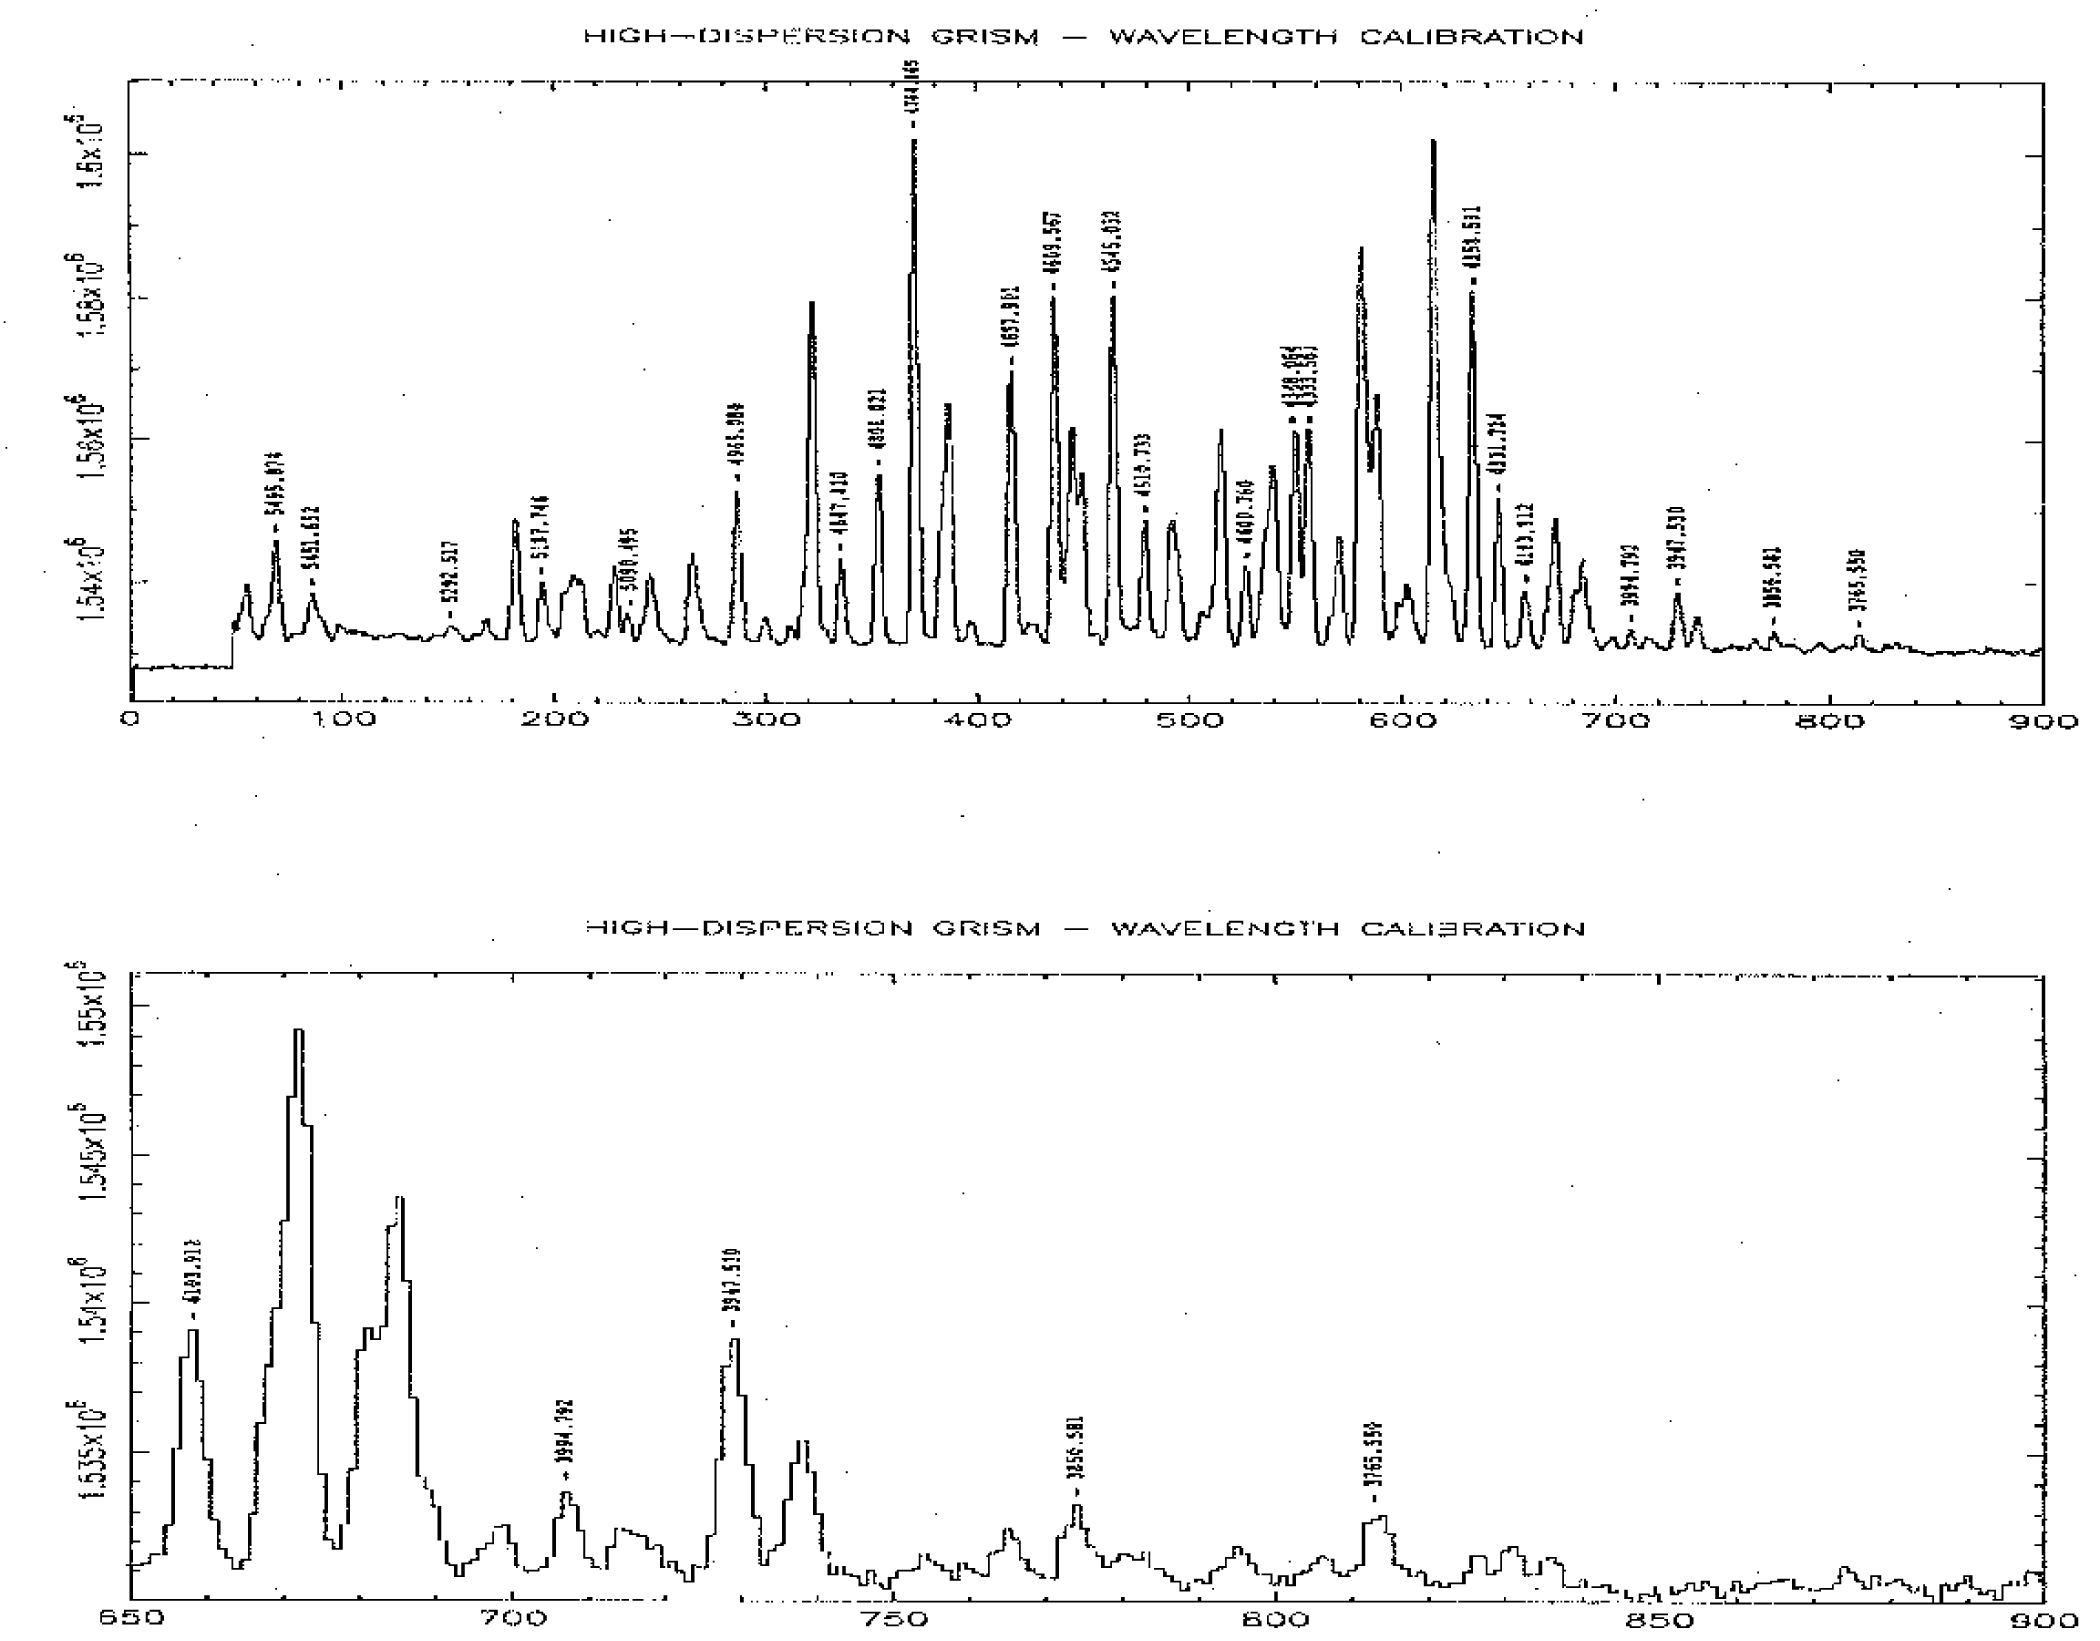
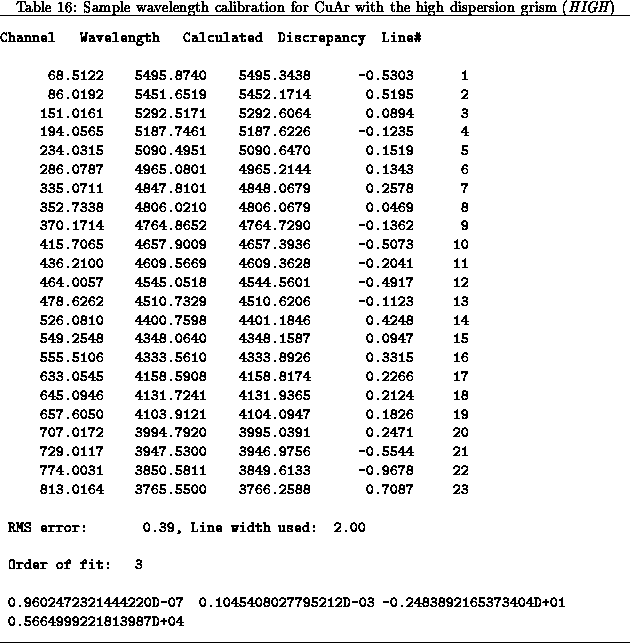
For each grism, data for the spectrum of a CuAr arc lamp is given in two ways: (1) a plot of a sample spectrum with wavelengths marked (Figs 13-16) and (2) a table showing the results of a sample wavelength-position fit. (Tables 13-16). The actual relationship between wavelength and position will depend on the position of the slit.